Data visualization types are essential tools for transforming raw data into meaningful insights. By presenting information visually, these techniques help businesses make informed decisions quickly and effectively.
This guide will explore various data visualization methods, their applications, and how to choose the right one for your needs.
Chart Types and Their Applications
Heatmaps, Treemaps, and Bubble Charts

Heatmaps use color-coding to represent data values, making it easy to spot patterns and trends. They’re particularly useful for displaying large datasets and identifying correlations between variables.
To create a heatmap in Google Sheets:
- Select your data range
- Click “Insert” > “Chart”
- Choose “Heatmap chart” from the chart type options
- Customize colors and labels as needed
For a detailed walkthrough, check out our guide on creating informative heatmap visualizations in Google Sheets.
Treemaps display hierarchical data using nested rectangles. Each rectangle’s size represents a quantitative value, while color can indicate another variable.
To create a treemap:
- Organize your data hierarchically
- Use a treemap-specific tool or library (e.g., D3.js)
- Assign size and color values to your data points
- Customize the layout and interactivity
Bubble charts plot data points as circles on an x-y axis, with the circle size representing a third variable. They’re excellent for comparing multiple variables simultaneously.
To create a bubble chart:
- Prepare your data with at least three variables
- Select your data range in Google Sheets
- Click “Insert” > “Chart”
- Choose “Bubble chart” from the chart type options
- Assign your variables to the x-axis, y-axis, and bubble size
Sankey Diagrams and Alluvial Diagrams
Sankey diagrams visualize the flow of resources or information between different stages or categories. They use arrows or bands whose widths are proportional to the flow quantity.
To create a Sankey diagram:
- Prepare your data with source, target, and value columns
- Use a specialized tool like Google Charts or D3.js
- Define your nodes and links
- Customize colors and layout
Alluvial diagrams are similar to Sankey diagrams but focus on showing how categorical data changes over time or across multiple dimensions.
To create an alluvial diagram:
- Organize your data with categories and their values across different dimensions
- Use a tool like RAWGraphs or ggalluvial in R
- Define your stratum and axes
- Adjust colors and labels for clarity
Box Plots and Violin Plots
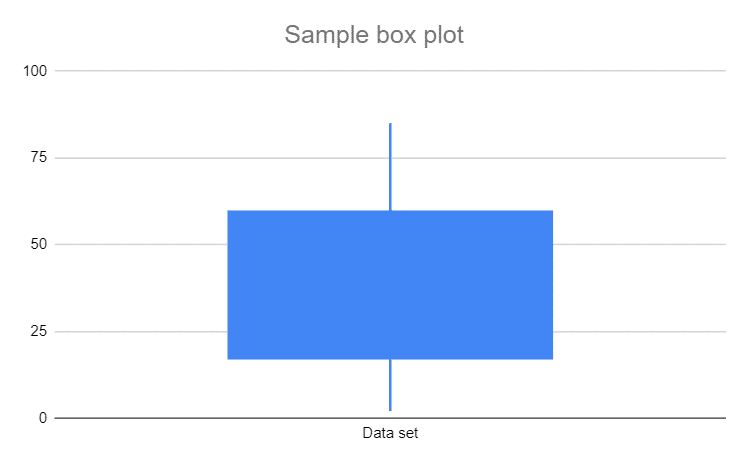
Box plots display the distribution of a dataset through quartiles, helping identify outliers and compare distributions.
To create a box plot:
- Prepare your dataset
- Calculate the minimum, first quartile, median, third quartile, and maximum
- Use a statistical software package or specialized charting tool
- Plot the box (representing the interquartile range) and whiskers (extending to the min and max)
Violin plots combine box plots with kernel density plots, providing a more detailed view of data distribution.
To create a violin plot:
- Prepare your dataset
- Use a statistical software package like R or Python with specialized libraries
- Plot the density estimation on both sides of the central axis
- Add a mini box plot inside the violin shape for additional detail
Choosing the Right Data Visualization for Your Dataset
Match Visualization Types to Data Characteristics
Selecting the appropriate visualization depends on your data type and what you want to communicate:
For comparing values: Bar charts, column charts, or bullet charts
For showing trends over time: Line charts or area charts

Stop exporting data manually. Sync data from your business systems into Google Sheets or Excel with Coefficient and set it on a refresh schedule.
Get Started
For displaying proportions: Pie charts, donut charts, or stacked bar charts
For revealing relationships: Scatter plots or bubble charts
For analyzing distributions: Histograms, box plots, or violin plots
Decision-making Framework for Selecting Visualizations
- Identify your data type (categorical, numerical, time-series, etc.)
- Determine your communication goal (comparison, composition, distribution, or relationship)
- Consider your audience’s familiarity with different chart types
- Evaluate the complexity of your data and choose a visualization that balances detail with clarity
- Test different options to see which best conveys your message
Common Pitfalls to Avoid in Visualization Selection
- Overcomplicating: Don’t use complex charts when simpler ones will do
- Mismatching: Ensure your visualization type suits your data and message
- Overlooking context: Provide necessary context to avoid misinterpretation
- Ignoring accessibility: Choose colors and formats that are accessible to all users
- Distorting data: Avoid manipulating scales or using misleading visual elements
Data Visualization Techniques and Best Practices
Strategies for Presenting Complex Data Clearly
- Use layering: Start with a high-level view and allow users to drill down for details
- Implement consistent color schemes and layouts across related visualizations
- Provide clear titles, labels, and legends to guide interpretation
- Use annotations to highlight key points or explain complex aspects
- Simplify complex datasets by focusing on the most relevant information
Combine Multiple Visualization Types for Comprehensive Insights
Integrating different chart types can provide a more complete picture:
- Use small multiples to compare similar charts across categories
- Combine a map with a bar chart to show geographic and quantitative data
- Pair a line chart with a heatmap to show trends and intensity simultaneously
Best Practices for Creating Impactful Data Presentations
- Know your audience and tailor your visualizations to their needs and expertise
- Tell a story with your data, guiding viewers through your insights
- Use white space effectively to avoid cluttered designs
- Ensure consistency in design elements across your presentation
- Practice data integrity by accurately representing your data without distortion
Tips and Tricks: Data Visualizations for Business Intelligence
Tailor Visualizations for Executive Dashboards
When creating visualizations for executive dashboards:
- Focus on key performance indicators (KPIs) relevant to high-level decision-making
- Use simple, easily digestible chart types like bullet charts or gauge charts for quick comprehension
- Implement clear hierarchies of information to guide the viewer’s attention
- Provide context with benchmarks or historical data for comparison
For inspiration, check out our collection of top Salesforce dashboard examples for sales leaders.
Integrate Visualizations with BI Platforms
To effectively integrate your visualizations with BI platforms:
- Ensure data consistency across all visualizations and reports
- Use APIs or native integrations to connect your data sources to your BI tool
- Implement role-based access controls to manage data visibility
- Set up automated data refreshes to keep visualizations up-to-date
Geospatial Visualizations and Their Business Applications
Geospatial visualizations can provide valuable insights for businesses:
- Heat maps for showing density of customers or sales across regions
- Choropleth maps for displaying data variations by geographic area
- Point maps for pinpointing specific locations of interest
- Flow maps for visualizing movement or transactions between locations
To create effective geospatial visualizations:
- Choose the appropriate map type for your data
- Use color effectively to represent data values
- Provide interactive features like zooming and filtering
- Include relevant contextual information like city names or landmarks
Elevate Data-Driven Decision Making with Effective Visualizations
Data visualization types are powerful tools for transforming raw data into actionable insights. By choosing the right visualization for your data, implementing interactive elements, and following best practices for design and communication, you can create impactful visualizations that drive informed decision-making in your organization.
Remember that the most effective visualizations are those that clearly communicate your data’s story while allowing users to explore and gain deeper insights. As you continue to work with data visualization, experiment with different types and techniques to find what works best for your specific needs and audience.
Ready to take your data visualization to the next level? Get started with Coefficient and discover how our powerful tools can help you create dynamic, data-driven visualizations that transform your business intelligence efforts.


