
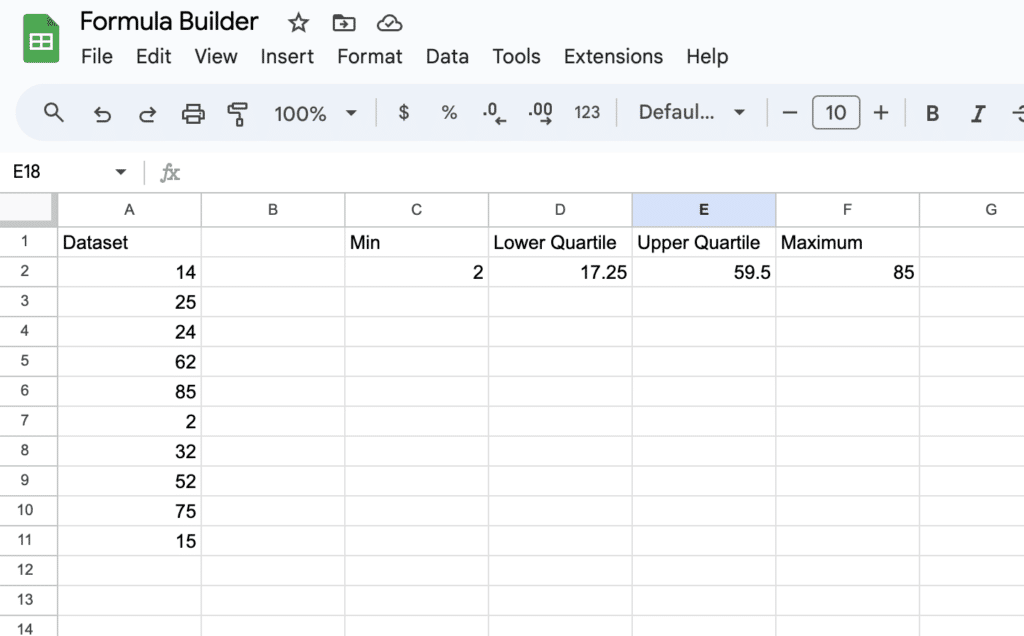
Prepare your data by calculating the minimum, lower quartile (Q1), upper quartile (Q3), and maximum values using Google Sheets functions
Click on the “Insert” tab and select “Chart” from the drop-down menu
In the Chart window, select “Candlestick chart” from the Chart type section (since Google Sheets doesn’t offer true box plots)
Customize your chart by selecting the “Customize” tab to adjust colors, font, and other settings
Click “Insert” to add the box plot to your sheet
Box plots are a popular type of graph used to display data distribution. They are commonly used in statistical analysis to compare data sets and identify outliers. On marketing and sales teams, they are often used to plot sales, inventory, and other metrics. Google Sheets is a powerful tool that can be used to create charts, similar to box plots, quickly and easily.
Creating Box Plots in Google Sheets
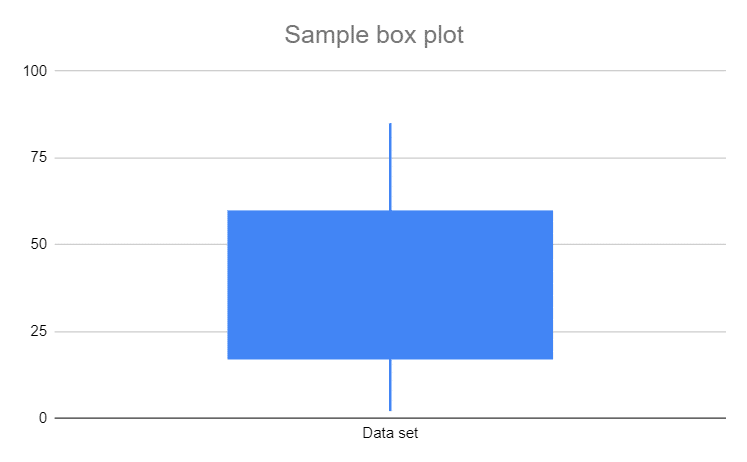
Google Sheets doesn’t offer box plots. However, they do offer a very similar chart called candlestick charts, which is the next best metod.
The only difference is that you can’t see the median since candlestick charts don’t use that data. The good news, however, is that the essential data is still there, which is typically enough for most use csaes.
To learn how to make a candlestick chart, similar to a box plot in Google Sheets, follow these steps:
- First, select the data that you want to create a box plot for.
- Click on the “Insert” tab and select “Chart” from the drop-down menu.
- In the “Chart” window, select “Candlestick chart” from the “Chart type” section.
- Customize your chart by selecting the “Customize” tab, where you can adjust the colors, font, and other settings.
- Click “Insert” to add the box plot to your sheet.
Using AI to Generate Your Chart
To make a box plot / candlestick chart, you’ll need a minimum, lower quartile, upper quartile, and maximum. All of these formulas in the sheet below have been generated by a simple AI prompt to create the formulas.
To use AI for your formulas and box plot, you can use Coefficient’s free Formula Builder to automatically create the Google Sheets formulas.
First, you’ll need to install the free Google Sheets Extension. You can get started with Formula Builder here.
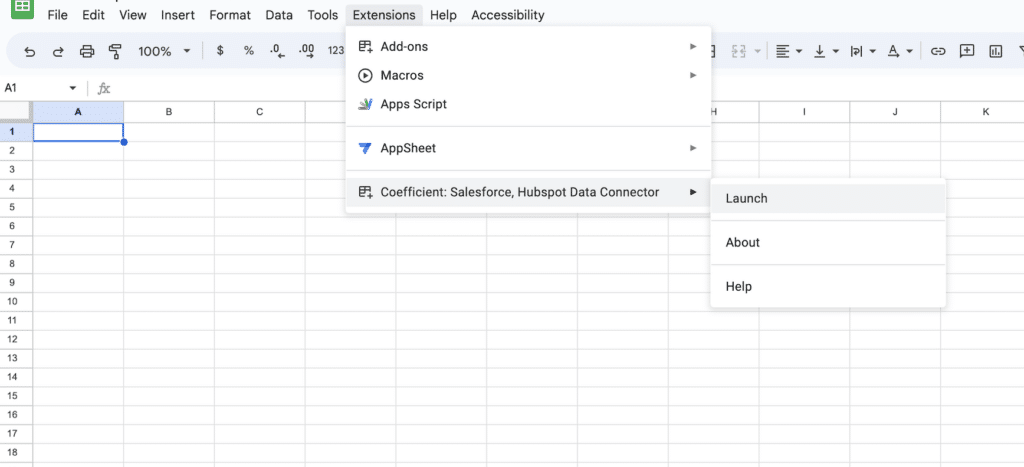
After you submit your email, follow along, and accept the prompts to install. Once the installation is finished, navigate to Extensions on the Google Sheets menu. Coefficient will be available as an add-on.
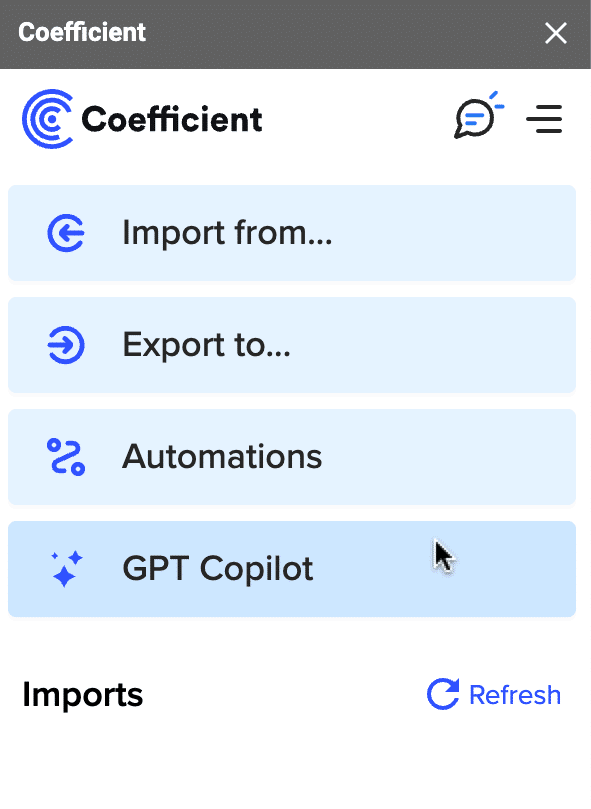
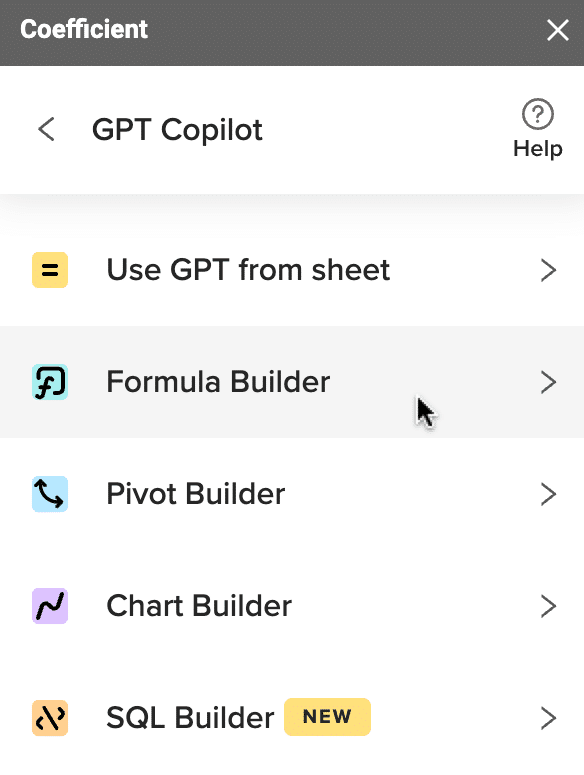
Now launch the app. Coefficient will run on the sidebar of your Google Sheet. Select GPT Copilot on the Coefficient sidebar.

Supercharge your spreadsheets with GPT-powered AI tools for building formulas, charts, pivots, SQL and more. Simple prompts for automatic generation.

Then click Chart Builder.
Type a description of a formula into the text box. For this example, let’s calculate the average score for students that scored 50 and above.
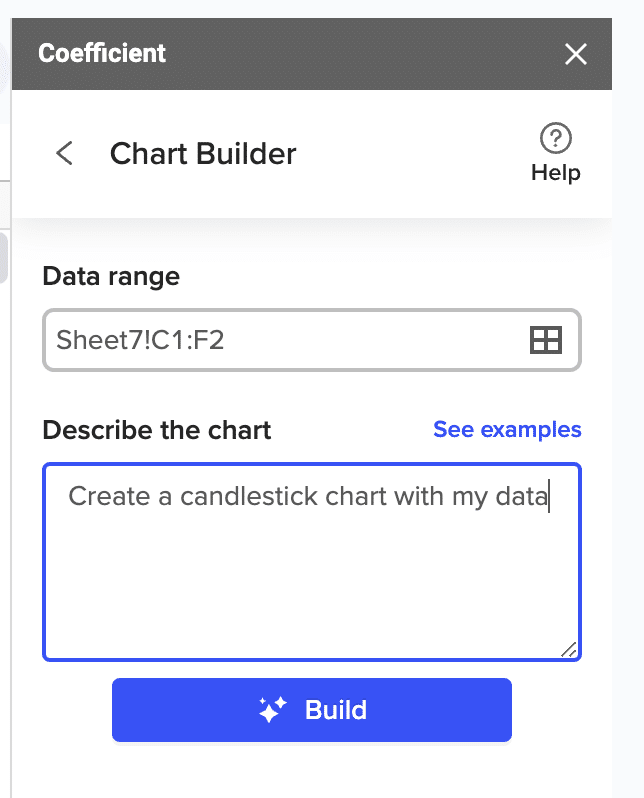
Simply type: Create a candlestick chart with my data. And your chart will be generated.
Other Tips for Making Box Plots in Google Sheets
It’s important to note that box plots and candlestick charts are most useful when comparing multiple sets of data.
To create a box plot for multiple sets of data, simply select all the data that you want to include in the plot.
In addition to creating a basic box plot, you can learn how to make a box plot with outliers on Google Sheets as well as add additional data to your chart.
You can just add the mean, median, and quartile values to your box plot by selecting the “Customize” tab and selecting the appropriate options.
In conclusion, creating a box plot in Google Sheets is a simple process that can help you better understand the distribution of your data. With a few clicks, you can create a professional-looking chart that is easy to read and interpret.


