Tableau is a key tool for anyone looking to turn data into understandable visual insights. One of its simplest yet most powerful visuals is the line chart, great for showing trends over time.
This guide will take you step-by-step through creating your own Tableau line chart, turning basic data into a clear and polished visualization.
Understanding Line Charts in Tableau
Line charts are straightforward: they connect data points with lines, making it easy to see changes and trends. They’re invaluable in data analysis for their ability to clearly communicate these trends and patterns over time.
Preparing Data
Before we dive into creating our Tableau line chart, let’s address a common challenge many face: managing and preparing data from diverse sources.
Coefficient makes the task of preparing your data straightforward and seamless. It allows you to import real-time data directly from your business systems into Google Sheets or Excel, ensuring your datasets are up-to-date and ready for visualization in Tableau.
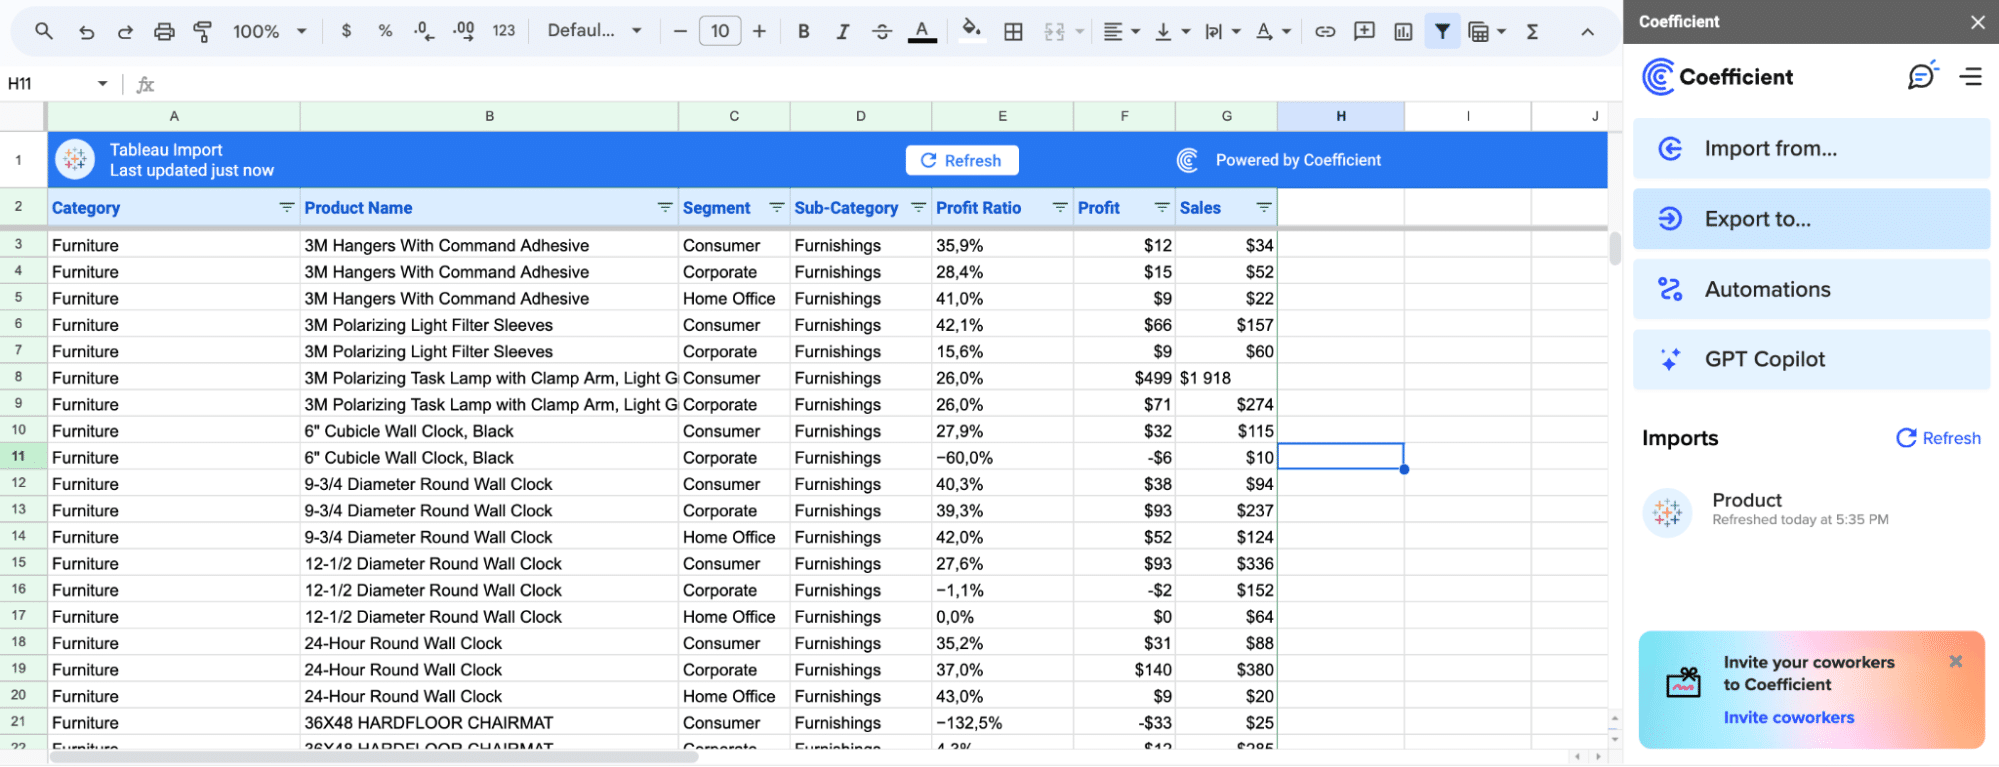
This method greatly improves the effectiveness and relevance of your analysis by providing access to the latest data.
Step-by-Step Guide to Creating a Tableau Line Chart
In this example, we will be visualizing Tesla’s stock data over time. Line charts are invaluable for analyzing trends and patterns, and this tutorial will walk you through the basics.
Step 1: Open Tableau and Connect to Your DataSet
Start by opening Tableau and connecting to your dataset. In this example, we’re using a dataset that includes Tesla Inc.’s time-series data.
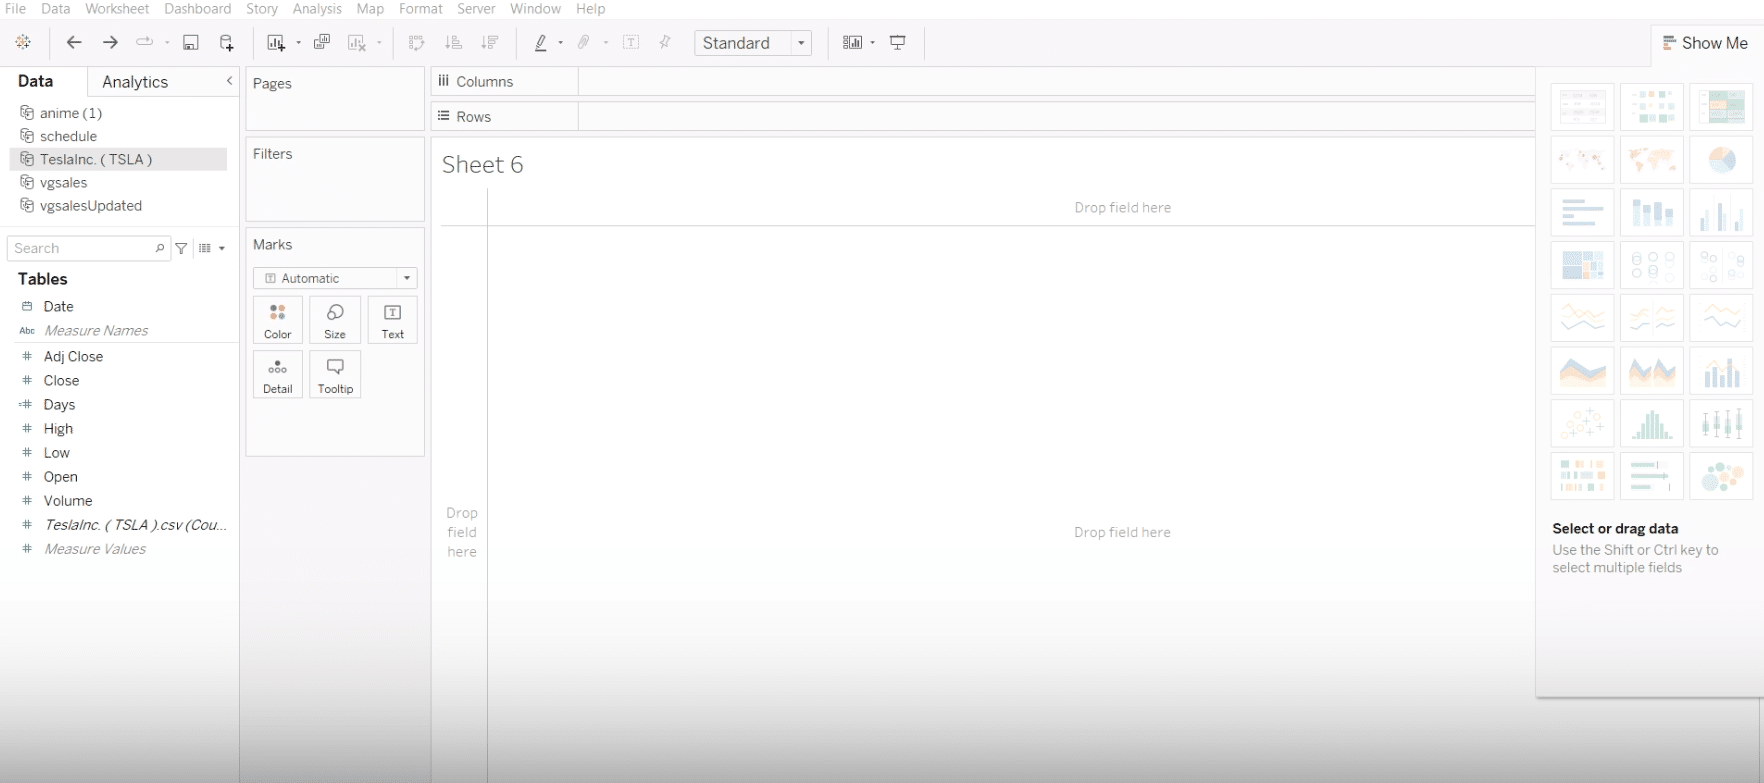
Screenshot: Connecting to data in Tableau – Alt Text: “Connecting to Dataset in Tableau”, File Name: “tableau-connecting-to-dataset.png”
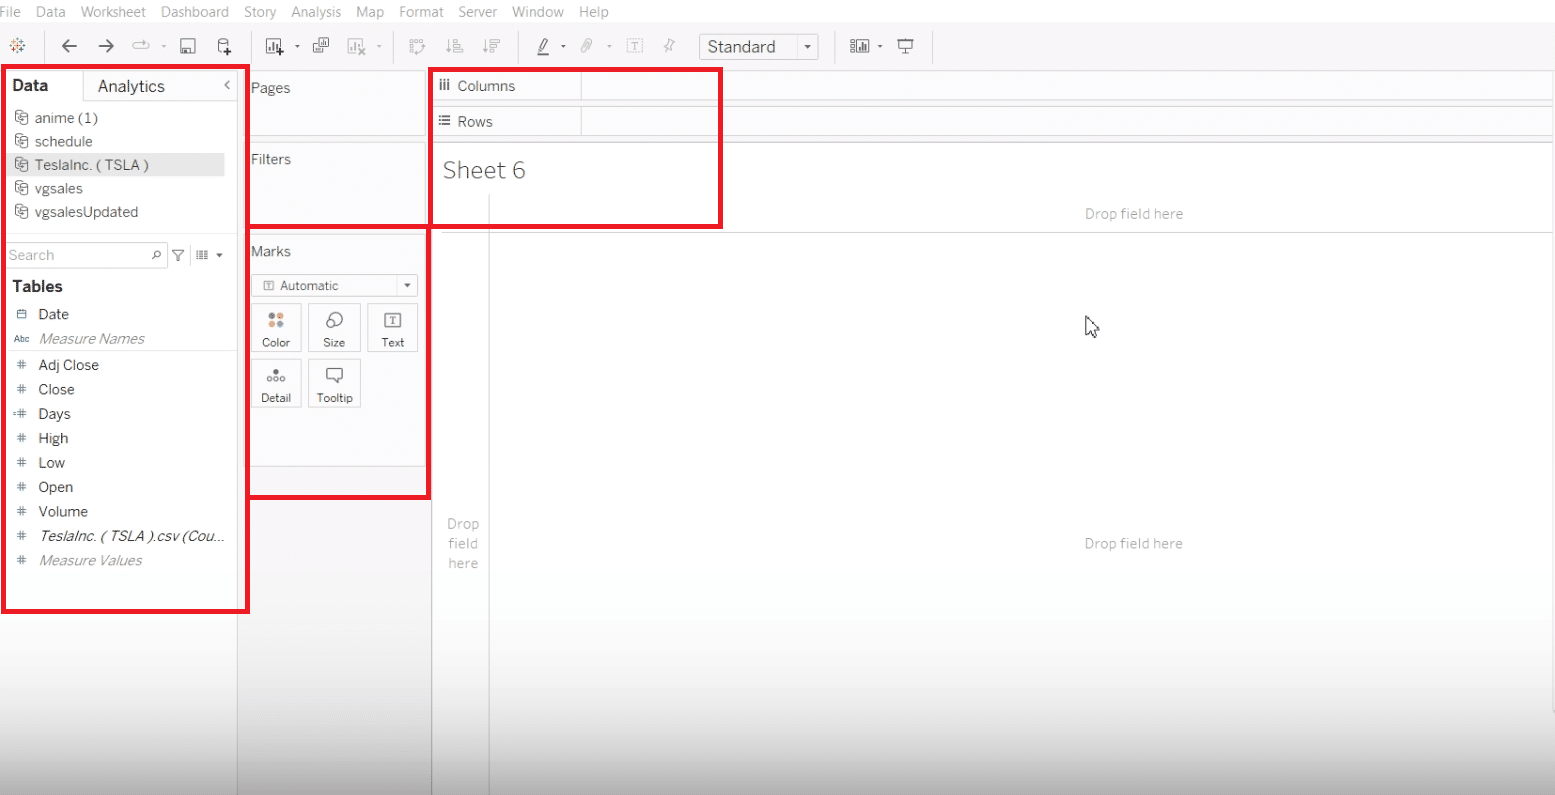
Step 2: Understanding the Data Panel
Familiarize yourself with the data panel to know what data you are working with. This is crucial, especially for Tableau beginners.
Step 3: Setting Up the Line Chart
Line charts require one date dimension and one or more measures.
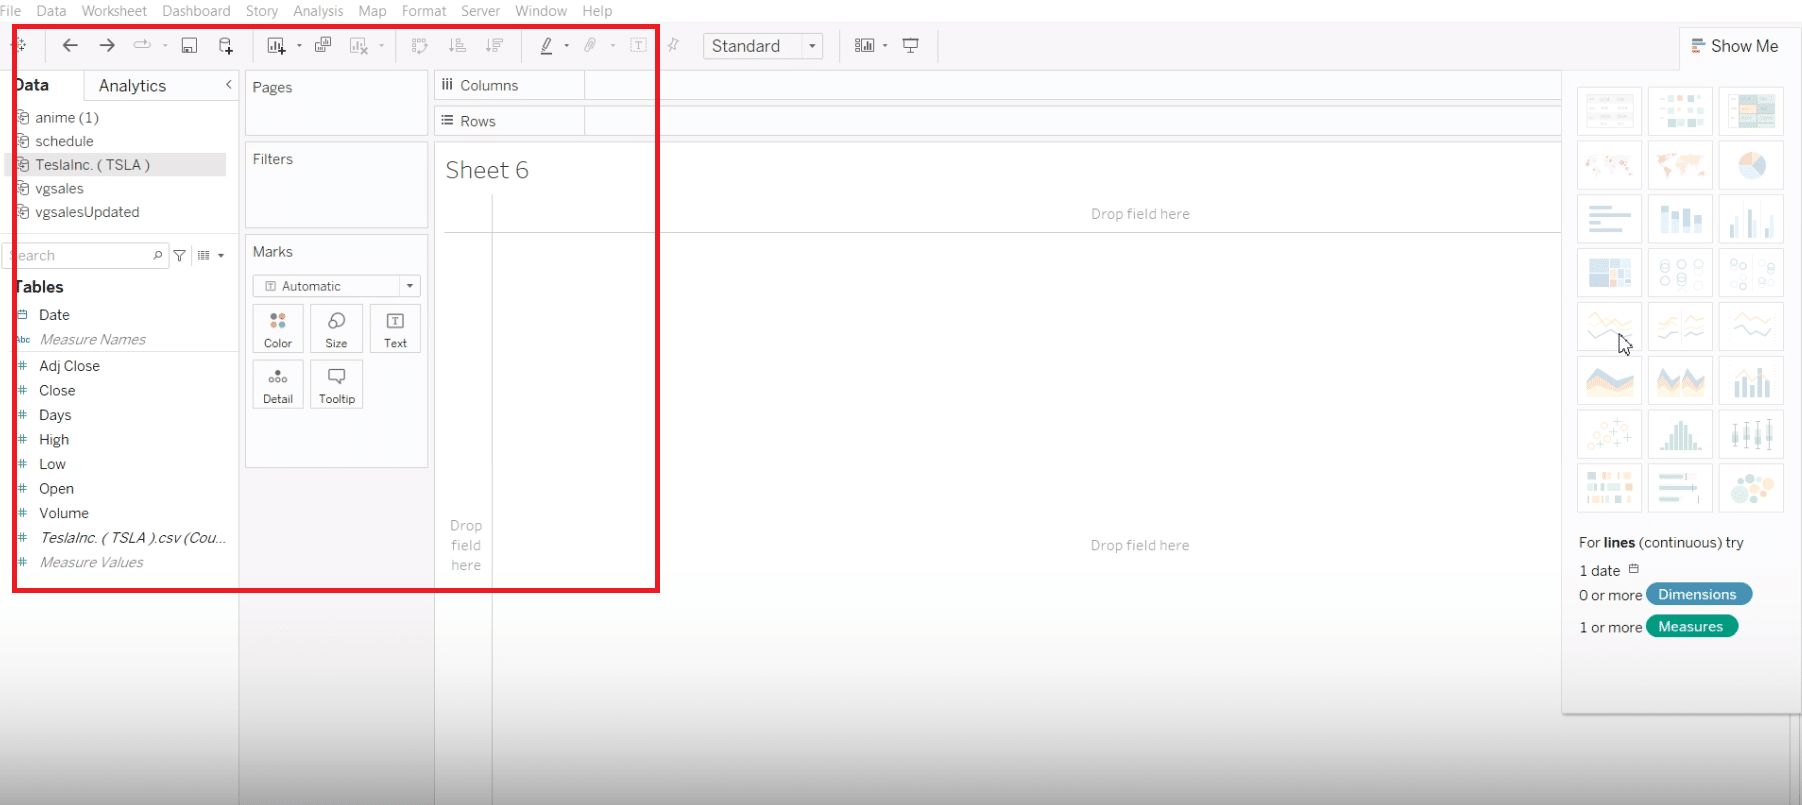
Drag the date dimension for Tesla’s data into the columns section.

Stop exporting data manually. Sync data from your business systems into Google Sheets or Excel with Coefficient and set it on a refresh schedule.
Get Started
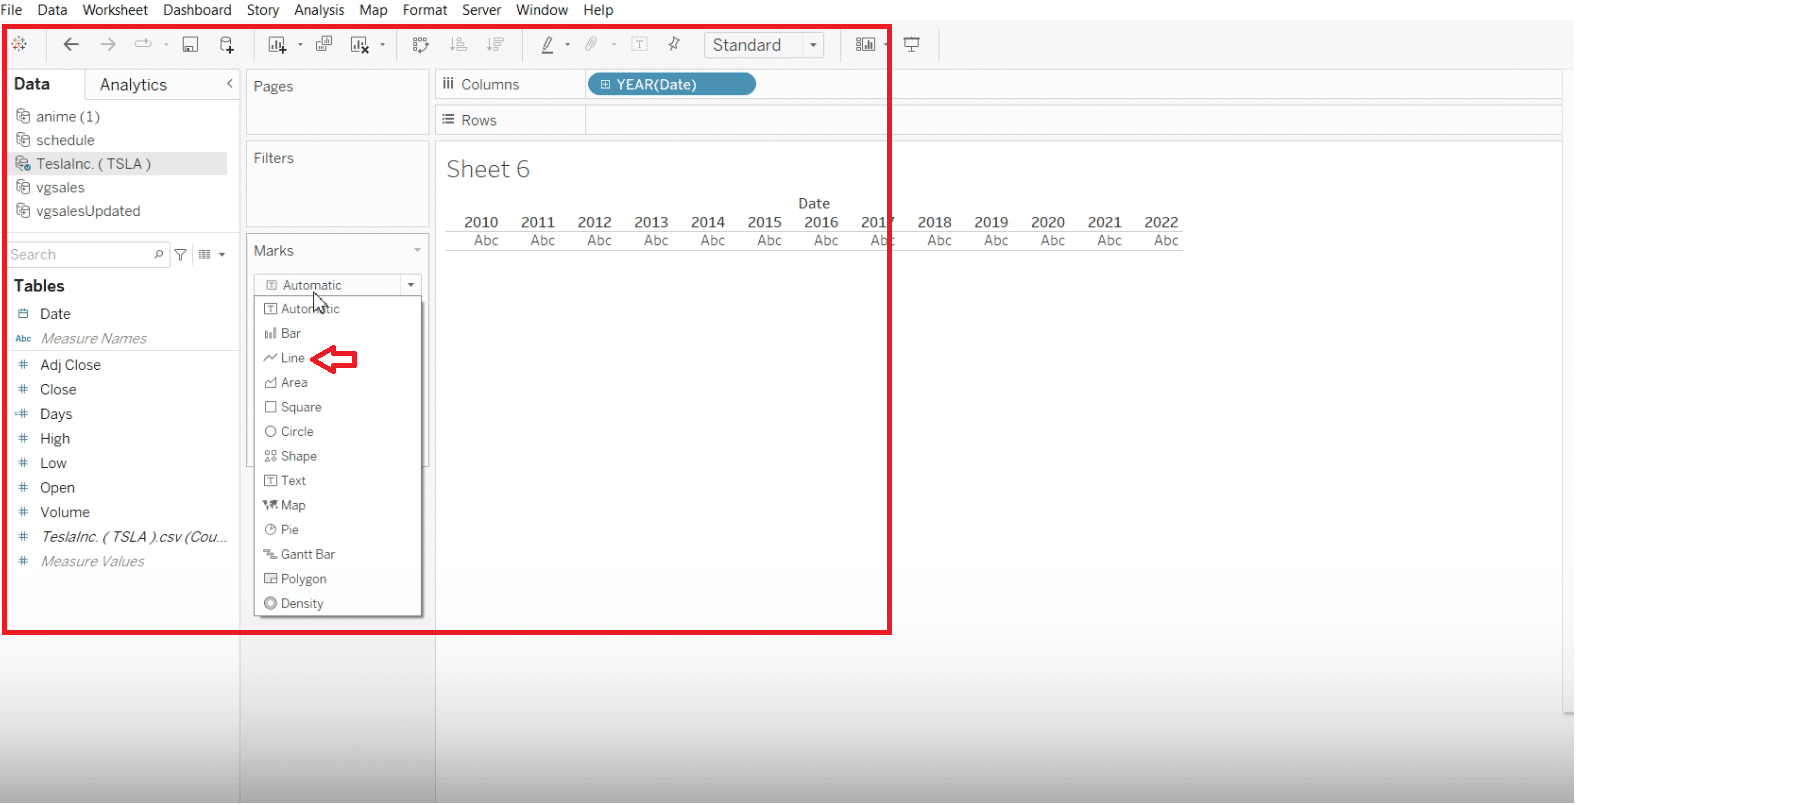
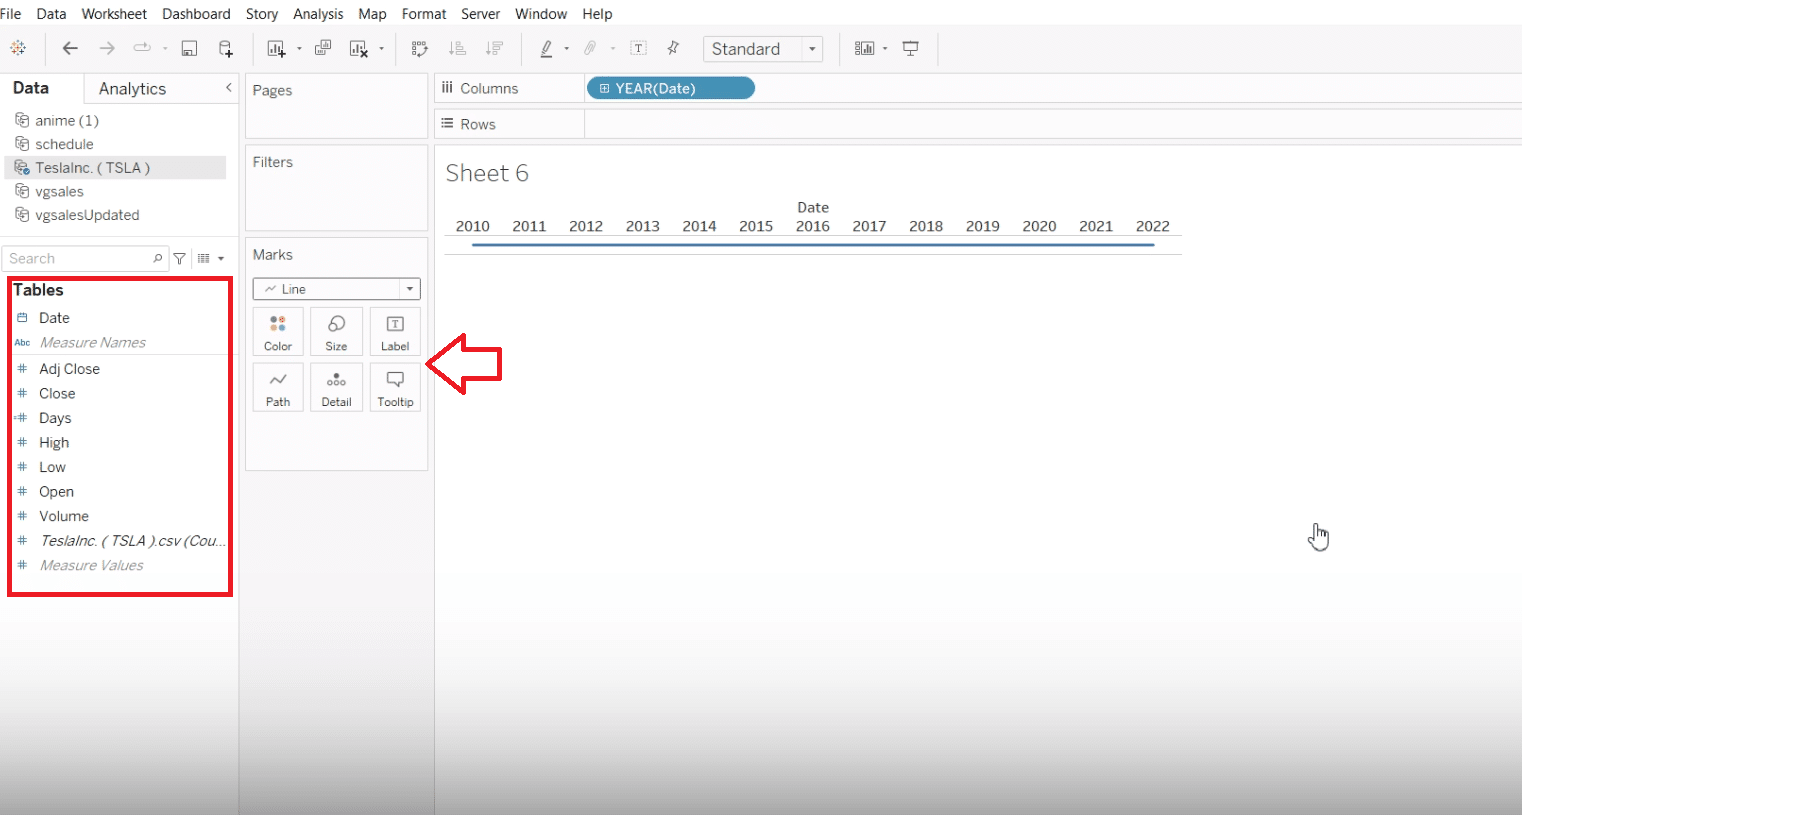
Step 4: Creating the Initial Line Chart
Change the mark type to ‘Line’ to initiate the line chart creation.
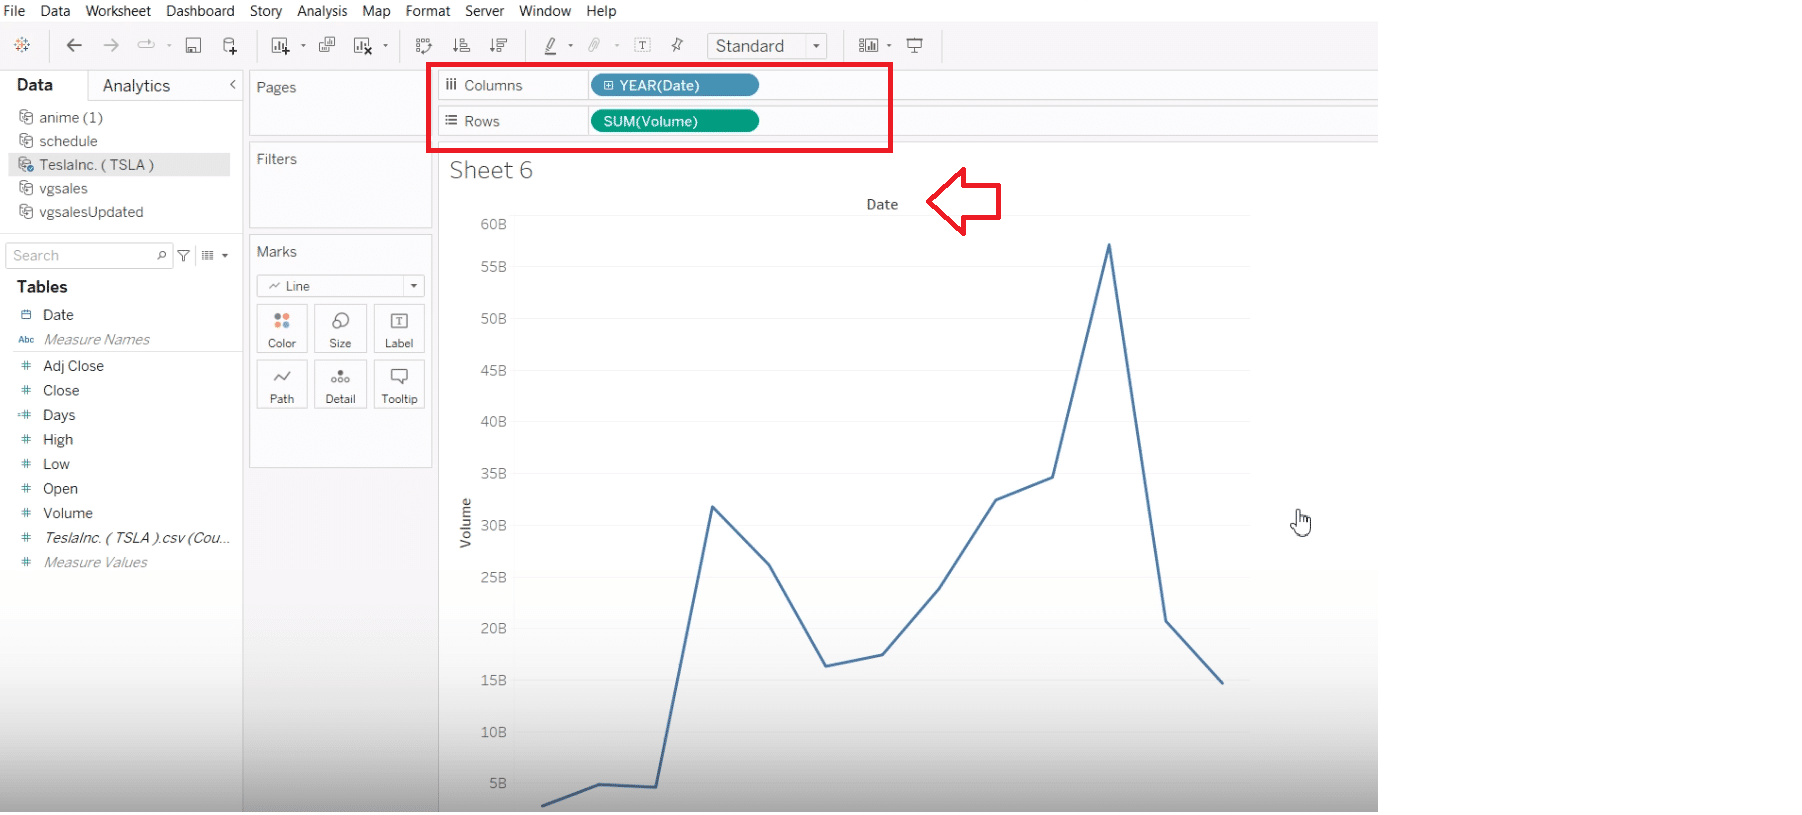
Drag the stock volume measure into rows to visualize Tesla’s stock volume over time.
Step 5: Enhancing the Line Chart
Visualize data points such as high or low by color.
Consider variations like the sum or count of days stocks were held.
Step 6: Filter and Adjust Visuals
Apply filters for specific years or break down data by month or day to examine the stock’s trend closely.
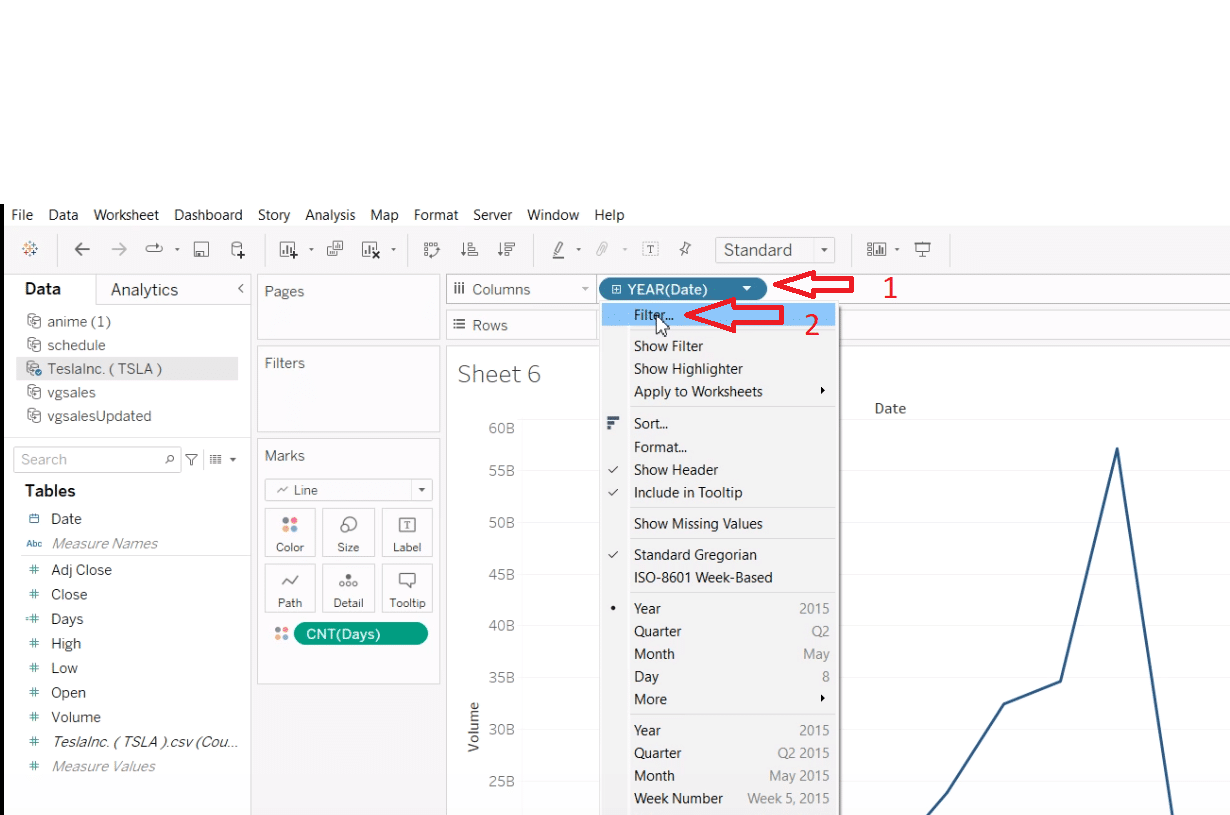
Tableau Line Chart: Tips & Best Practices
- Maintain a Clean and Organized Layout: Keep your visualization clutter-free. Use titles, labels, and legends effectively, without overwhelming your audience. Prioritize readability and comprehension.
- Optimize for Performance: Large datasets, like stock market data, can slow down your visualization. Optimize your workbook’s performance by aggregating data, using extracts instead of live connections when possible, and minimizing the use of complex calculations in visualizations.
- Choose the Right Level of Detail: While it’s tempting to include as much detail as possible, too much granularity can lead to overplotting and confusion. Decide on the appropriate level of detail based on your audience and the story you want to tell.
- Use Tooltips Wisely: Tooltips can provide additional context and data that aren’t immediately visible. Customize them to include meaningful information that complements your line chart without distracting from the main insights.
- Iterate and Solicit Feedback: After developing your visualization, seek feedback from potential users or stakeholders. Iterative design, based on constructive feedback, can greatly improve the effectiveness and usability of your final product.
Conclusion
Mastering Tableau’s advanced techniques and best practices enables you to transform complex data into insightful visualizations effortlessly. With continuous exploration and creativity, you can elevate your storytelling and make informed decisions.
To further streamline your data analysis and visualization process, consider integrating Coefficient for seamless data management across Tableau, Google Sheets, and Excel. Start enhancing your Tableau journey with Coefficient today and bring your data narratives to life.


