Sales forecasting is pivotal for any business operation, especially for go-to-market strategies where predicting future sales helps in strategizing and planning effectively. However, businesses often grapple with challenges such as maintaining data accuracy and managing data from various sources, making efficient forecasting a daunting task.
Recognizing these challenges, this guide aims to simplify sales forecasting in Excel, offering a blend of manual methods and automated solutions with Coefficient—a tool that seamlessly integrates Salesforce CRM data into Excel for more dynamic forecasting.
How to Forecast in Excel: A Step-by-Step Guide
Coefficient is a no-code, two-way Excel Connector for Salesforce, HubSpot, and many other platforms, trusted by over 350,000 go-to-market professionals and data analysts for live data analysis and reporting.
Coefficient not only simplifies your sales forecasting process but also automates it, saving you time and reducing errors.
Now let’s walk through how you can automate your sales forecasting process in Excel.
It’s by far the fastest, easiest, and most accurate way to forecast in Excel. Let’s walk through how it works in Salesforce.
Step 1: Connecting Salesforce to Excel
Start by launching Coefficient from your workbook.
To install Coefficient, open Excel from your desktop or in Office Online.
Click ‘File’ > ‘Get Add-ins’ > ‘More Add-Ins.’
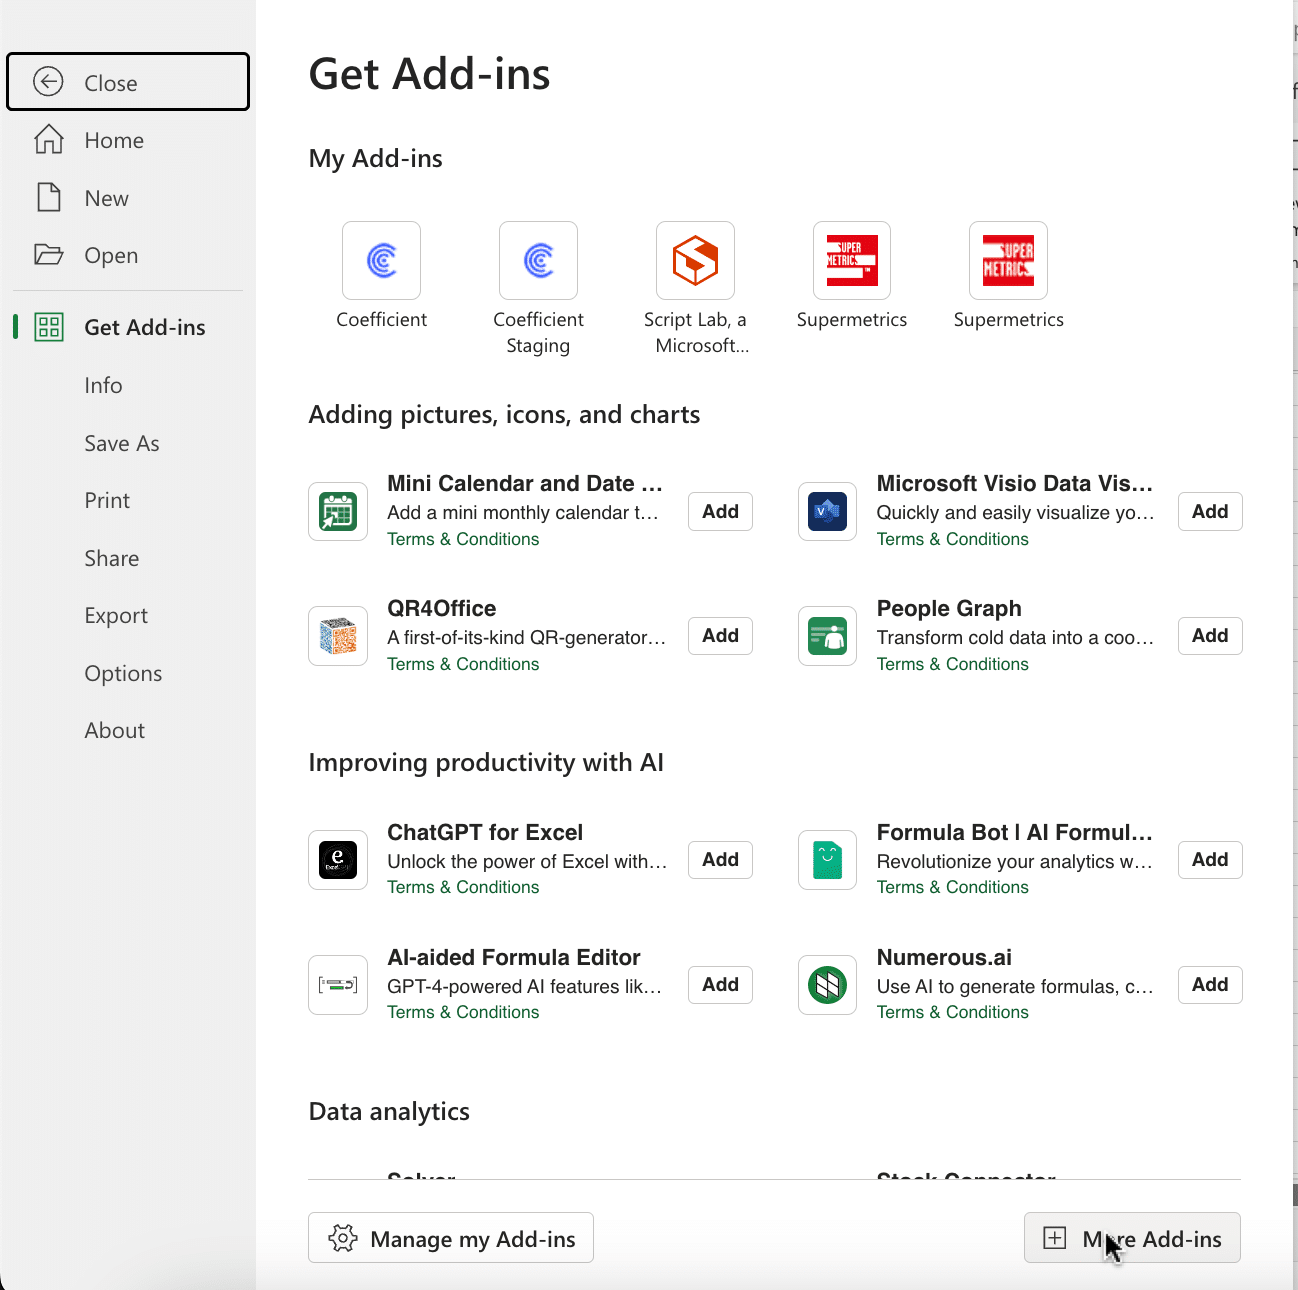
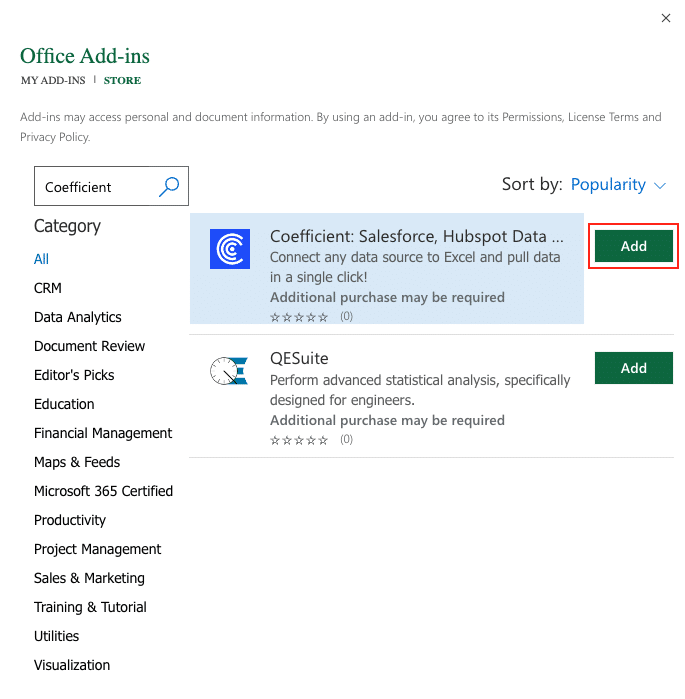
Type “Coefficient” in the search bar and click ‘Add.’
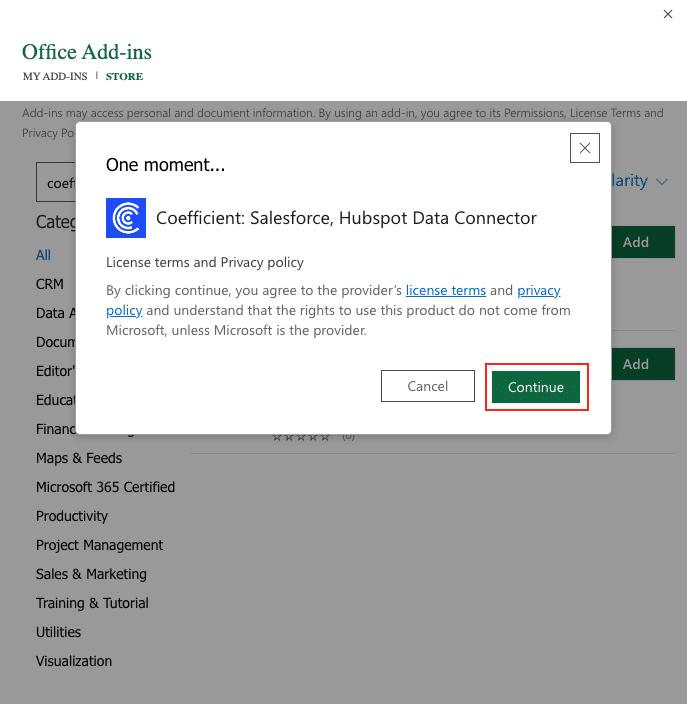
A pop-up will open up. Follow the prompts to complete the installation.
Once finished, you will see a “Coefficient” tab at the top navigation bar.
Click ‘Open Sidebar’ to launch Coefficient.
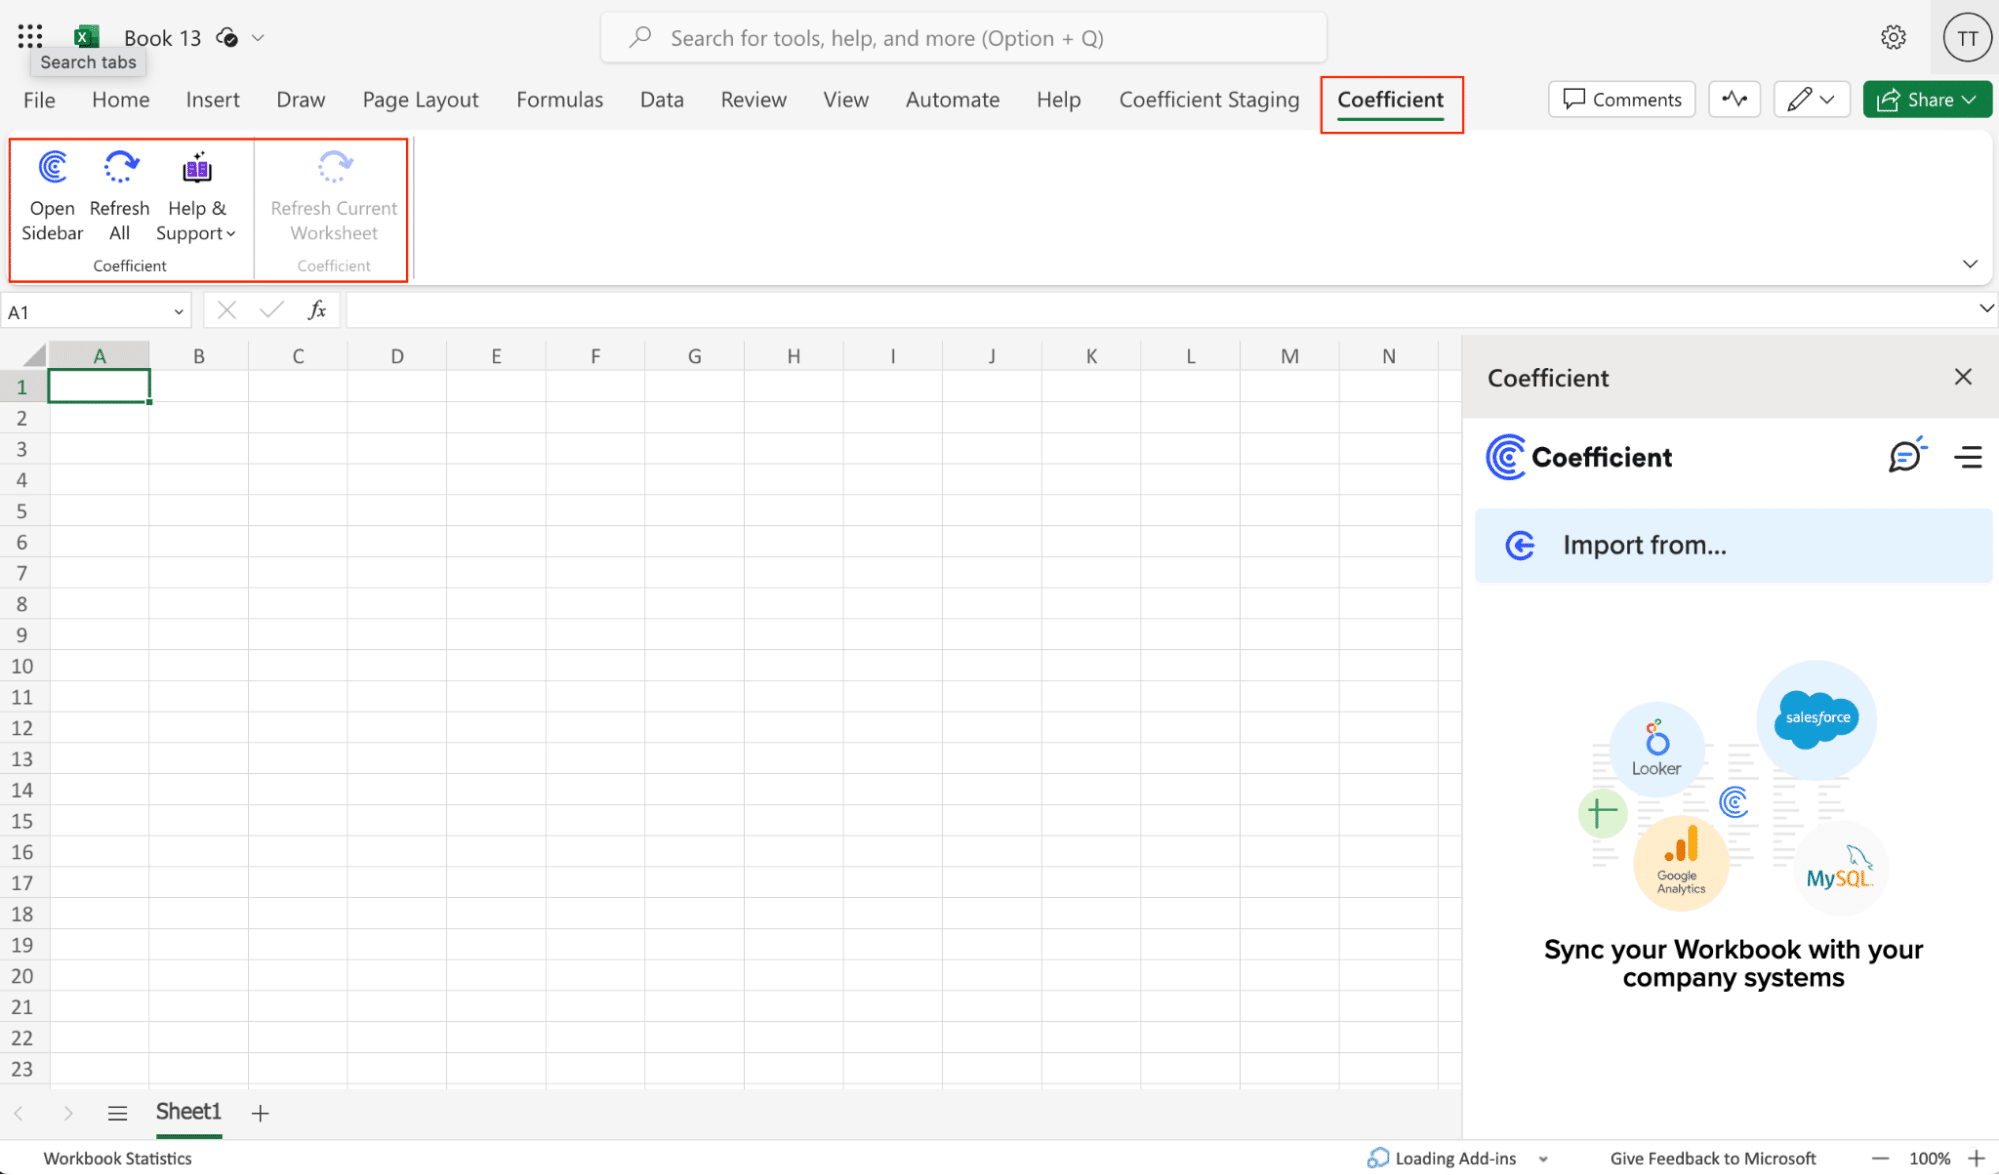
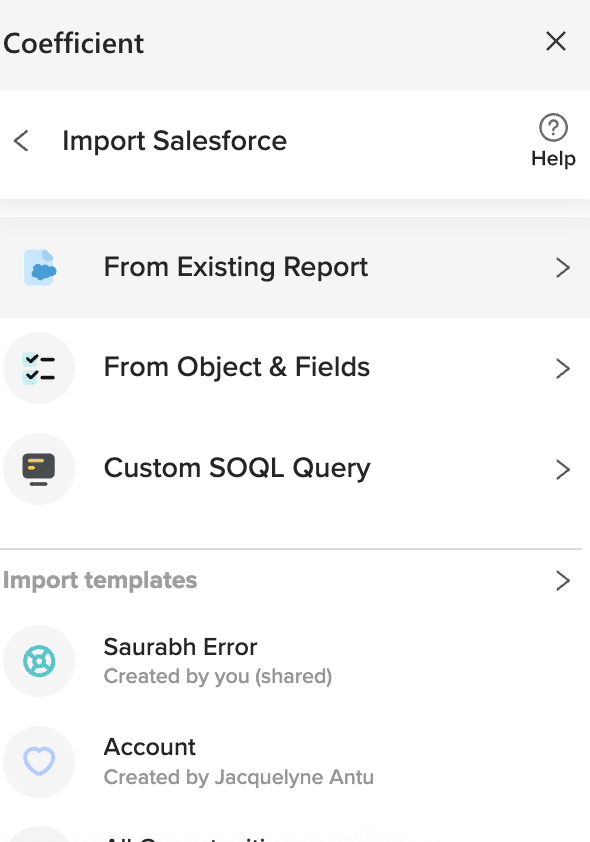
Once Coefficient’s sidebar opens, choose ‘Import from…’, then select ‘Salesforce’ as your data source.

Select ‘From Objects & Fields.’
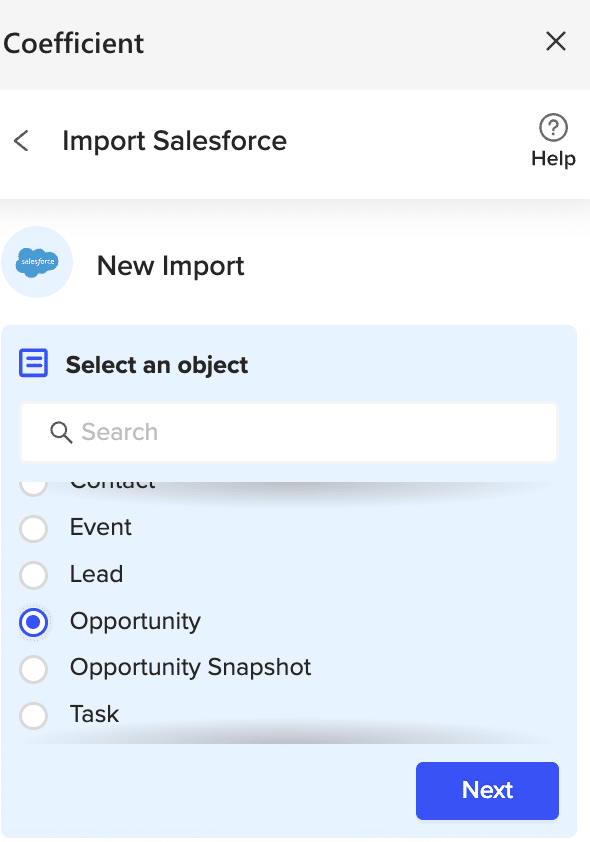
Choose the ‘Opportunity’ object and click ‘Next.’
Select the following fields from the menu: ‘Name,’ ‘Close Date,’ ‘Forecast Category,’ ‘Stage,’ ‘Amount,’ and ‘Probability.’
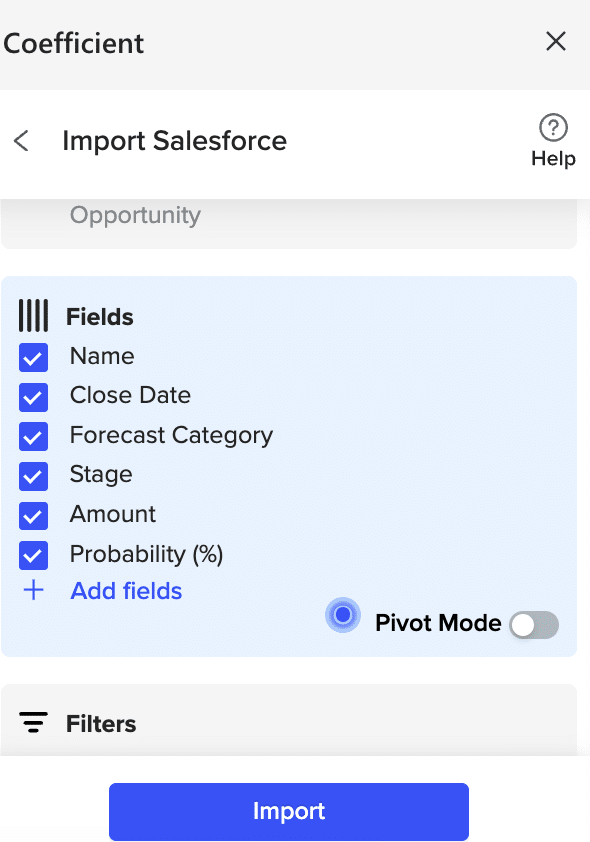
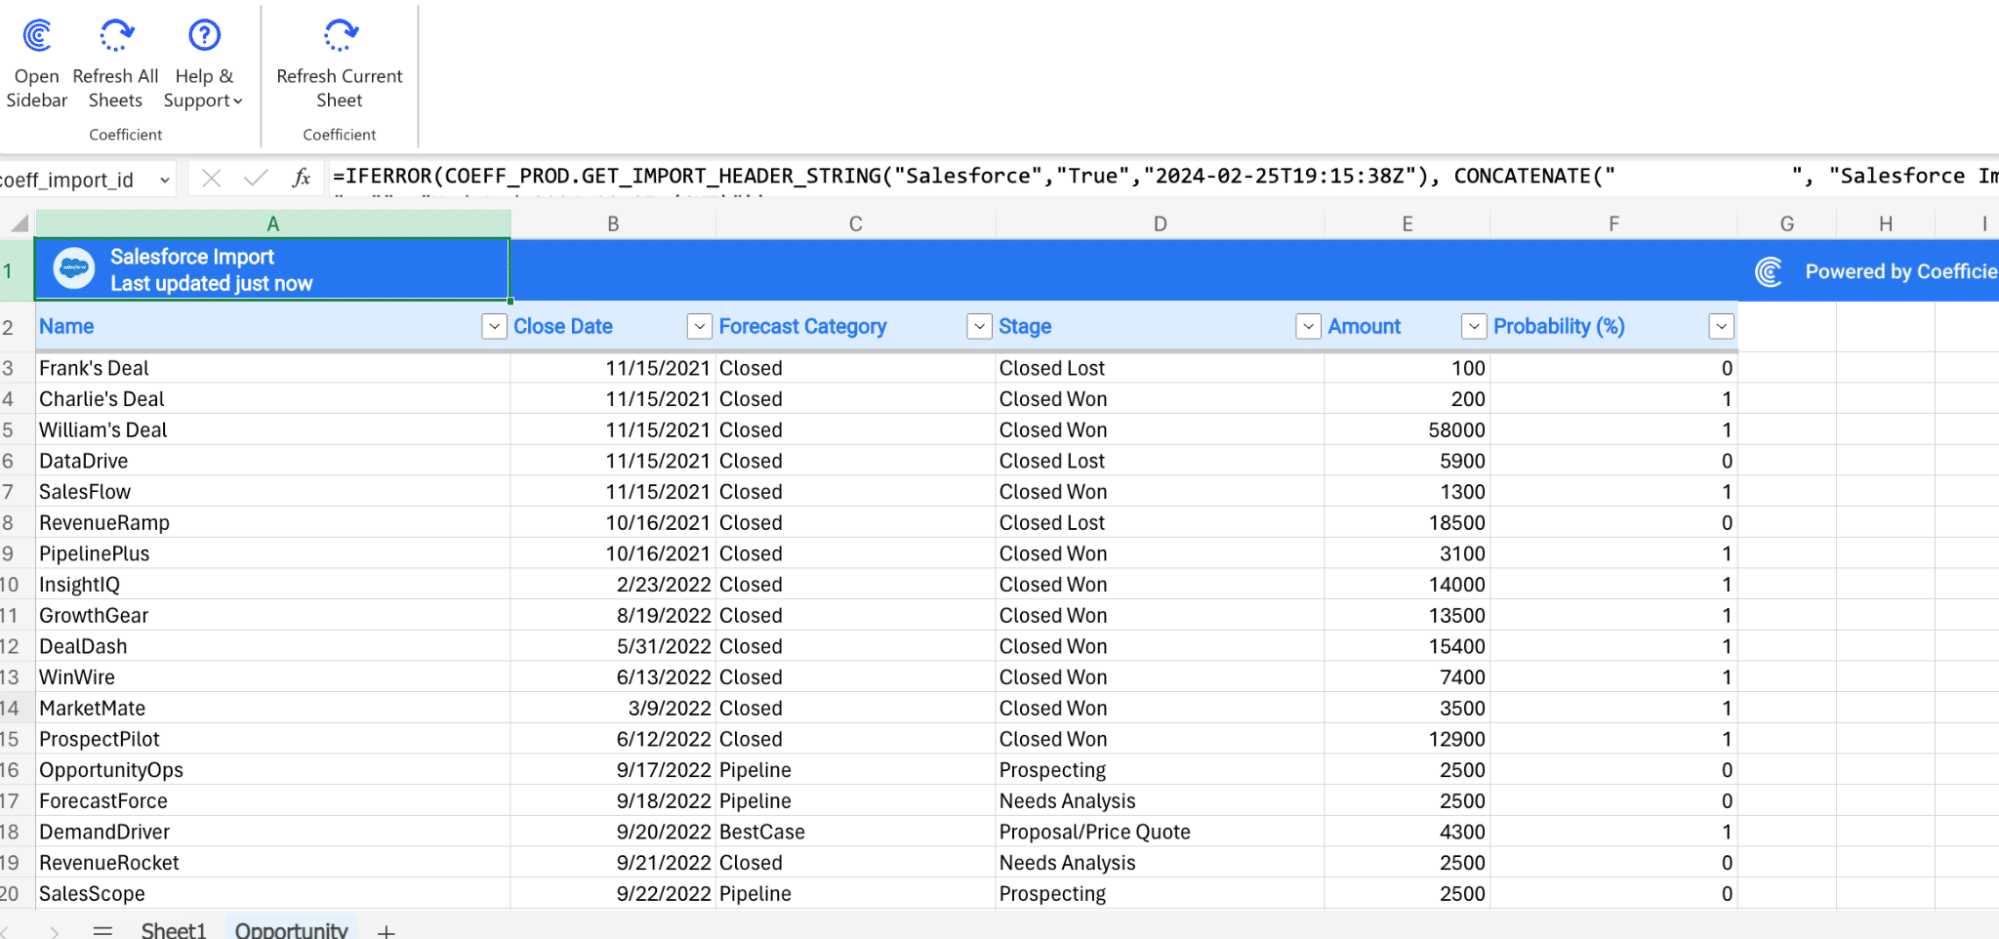
After selecting your fields, click ‘Import’ to send your data to Excel.
Step 2: Calculating Forecasted Revenue in Excel
Now it’s time to calculate forecasted sales:
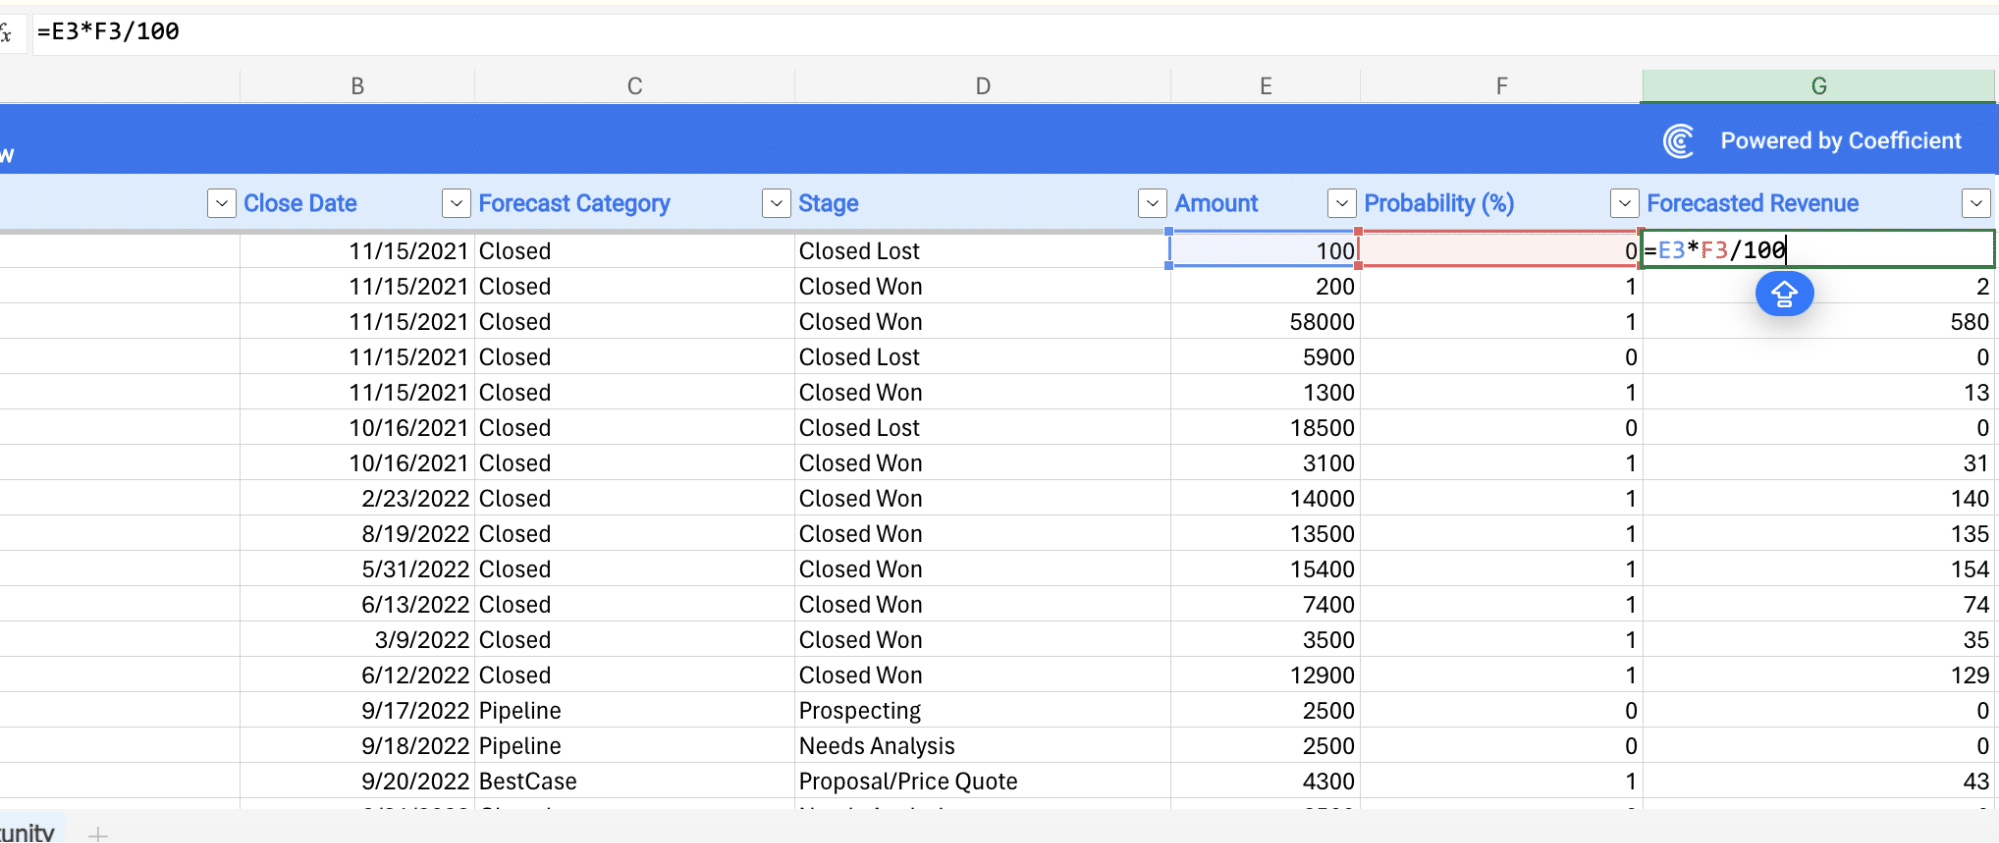
Create a Calculated Field: In Excel, adjacent to your imported data, create a column labeled ‘Forecasted Revenue.’
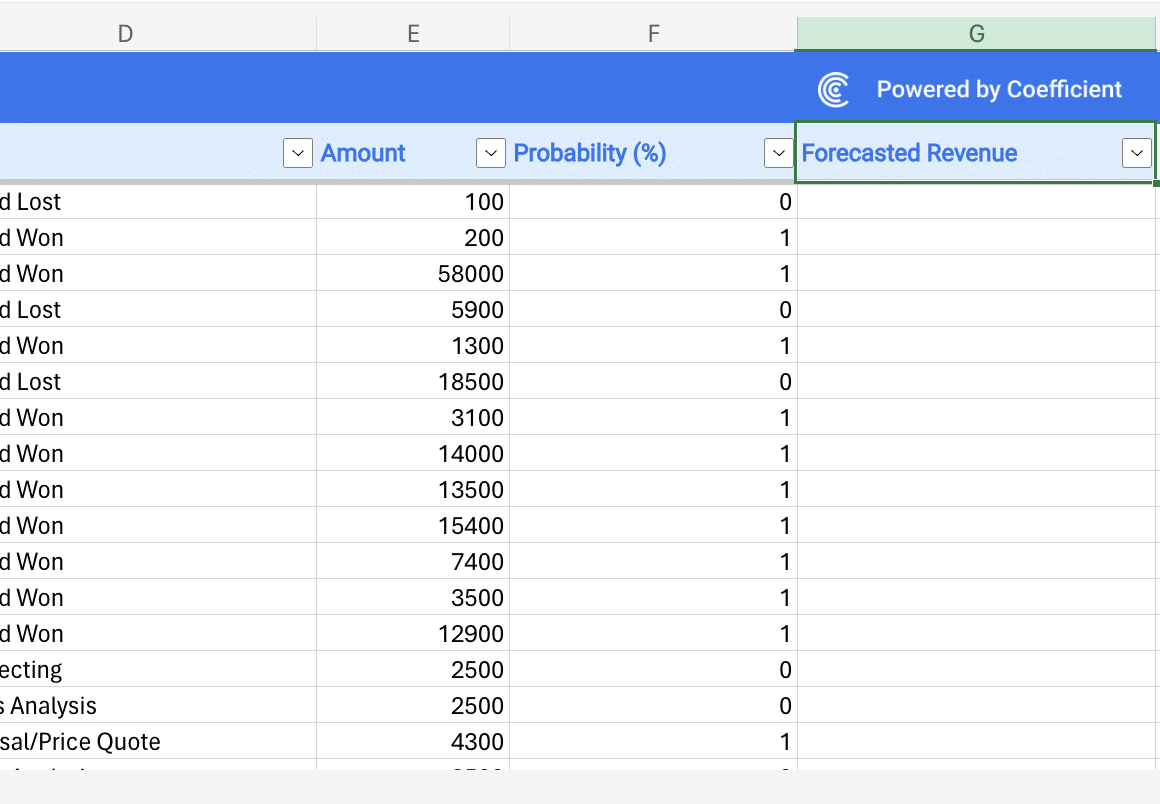
Enter the Forecast Formula: Forecasted Revenue is calculated by multiplying your ‘Amount’ times your ‘Probability’ divided by 100. In this example, =E3*F3/100.
Step 3: Analyzing the Data
With your forecasted revenue calculated, move on to analyzing the data:

Stop exporting data manually. Sync data from your business systems into Google Sheets or Excel with Coefficient and set it on a refresh schedule.

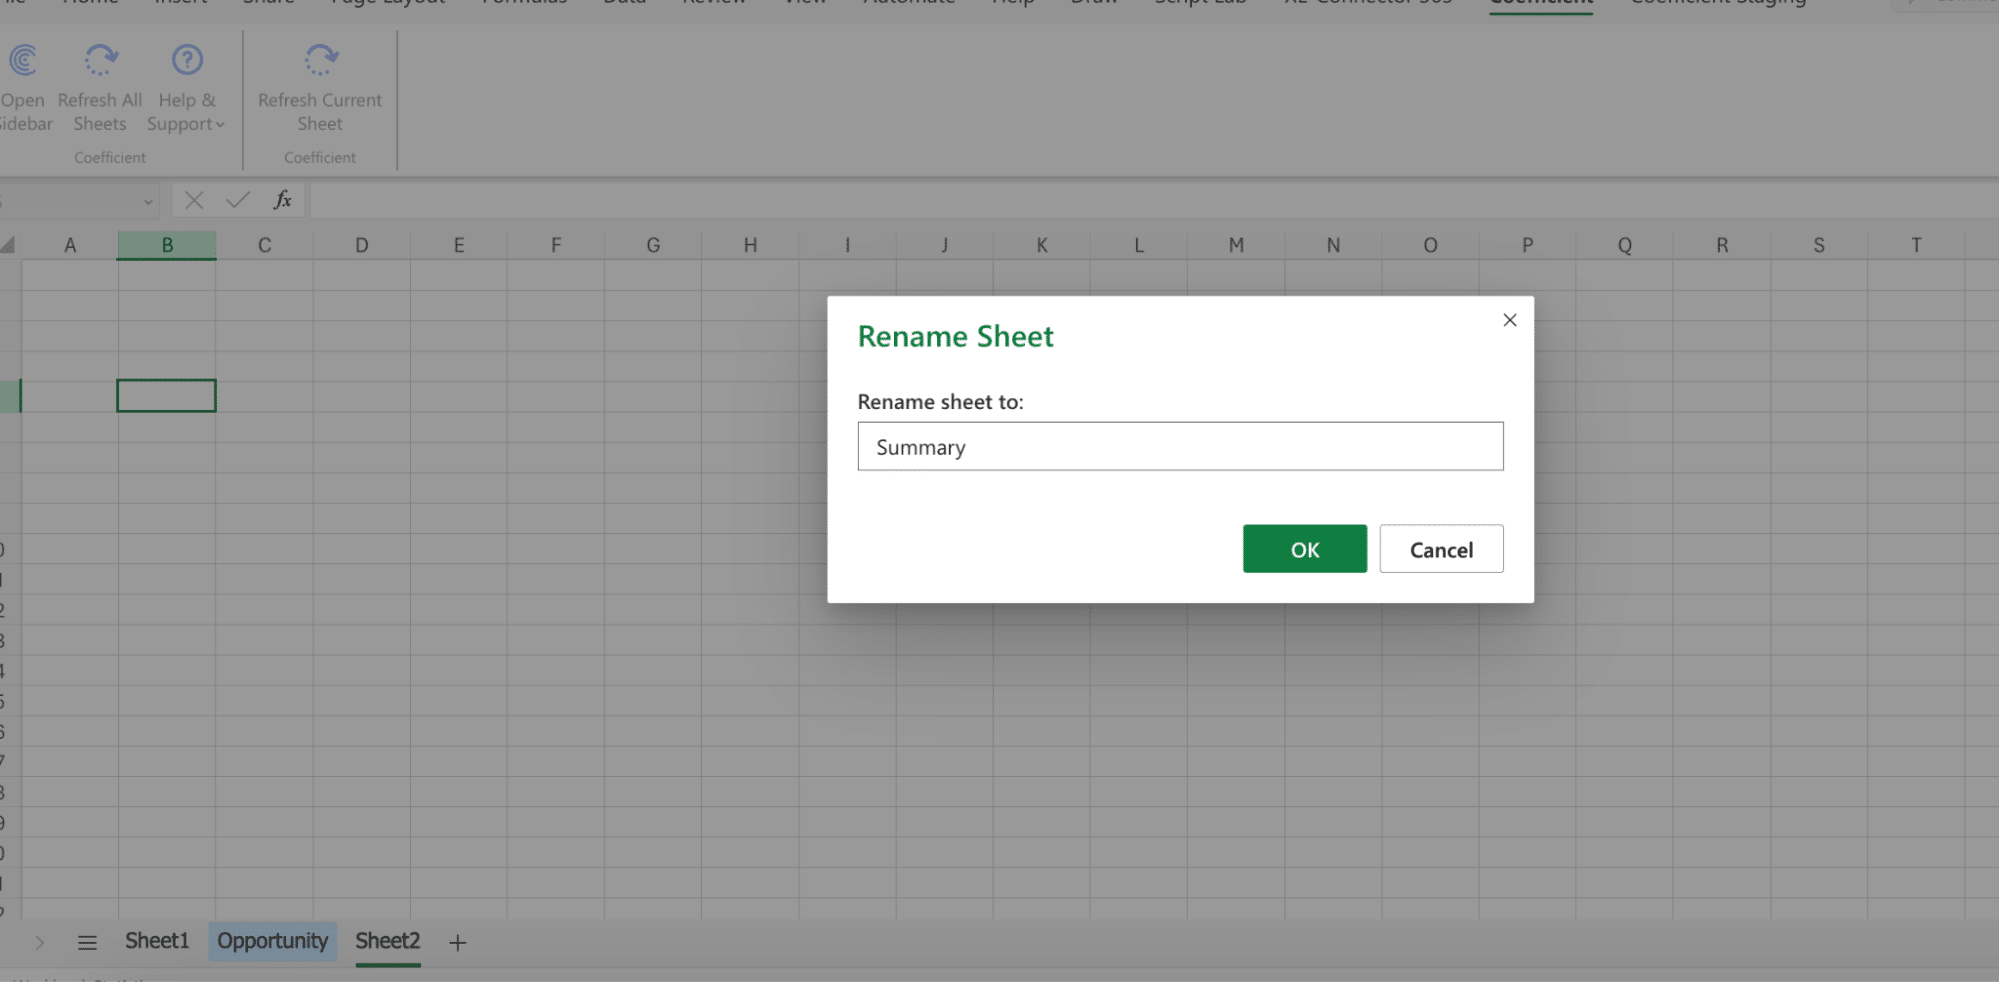
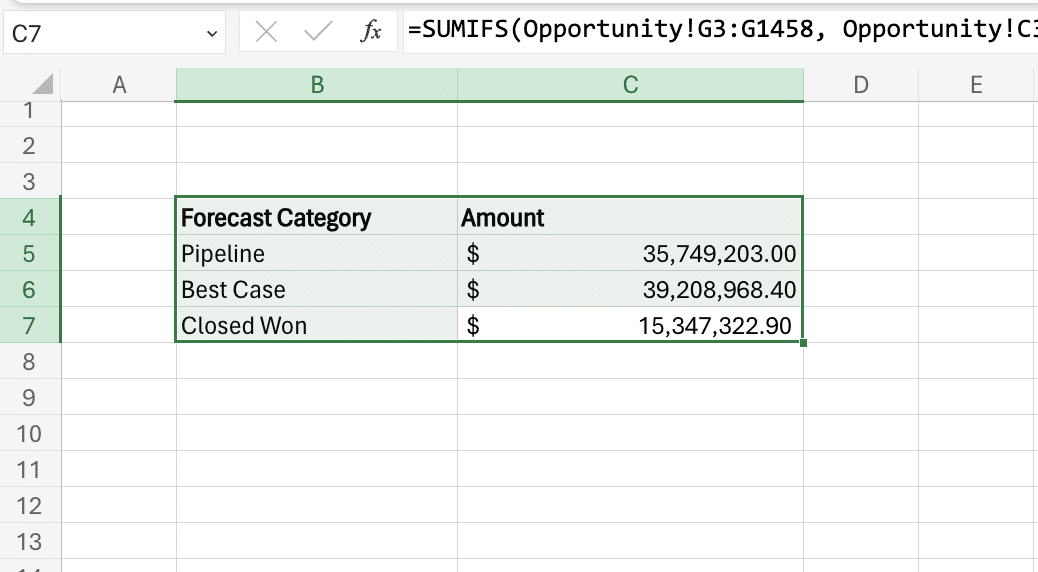
Start a Summary Sheet: Create a new sheet named ‘Summary.’
Assign Values: List out categories like ‘Forecast Category,’ ‘Pipeline,’ ‘Best Case,’ and ‘Closed Won’.
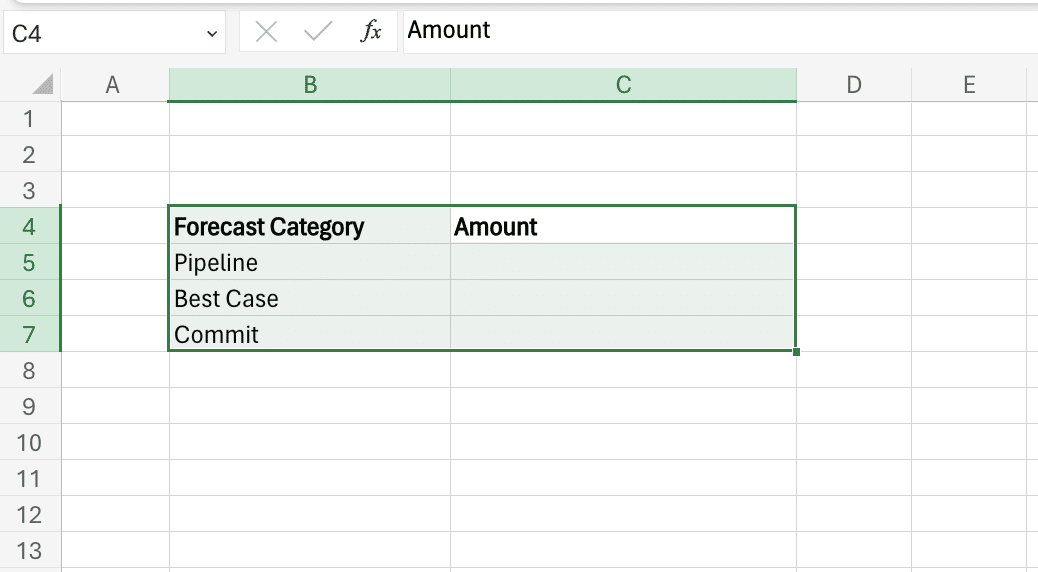
Summarize the Forecasted Revenue: Utilize Excel’s ‘SUMIFS’ formula to sum up forecasted sales revenue by the Salesforce forecast categories:
=SUMIFS(ImportedSheet!ForecastedRevenueColumn, ImportedSheet!ForecastCategoryColumn, CategoryCell)
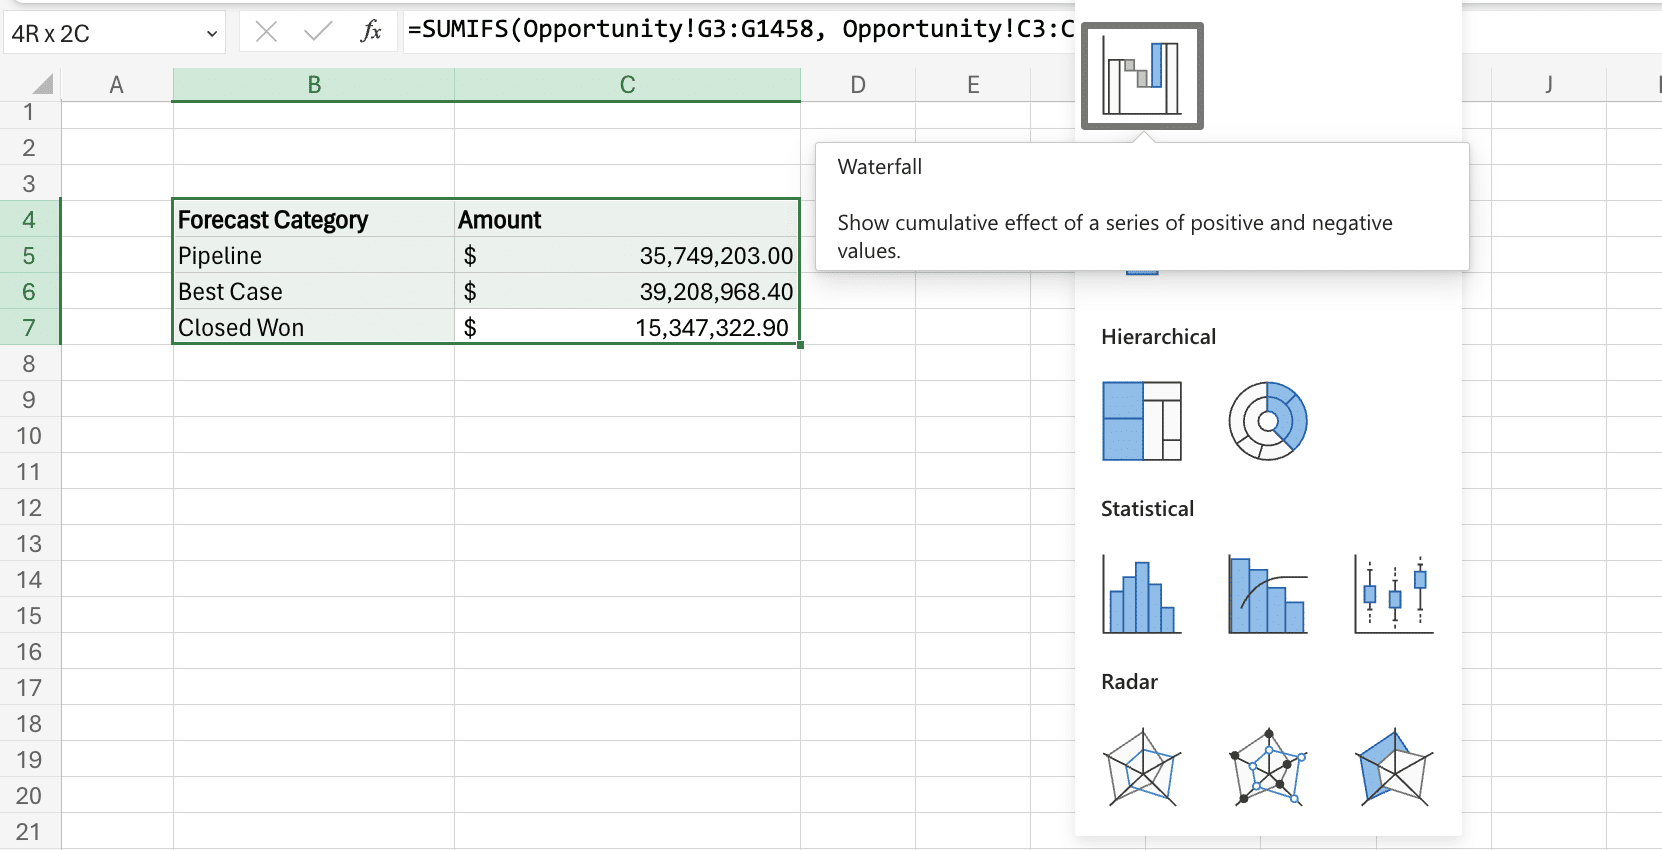
Step 4: Visualizing the Sales Forecast
Now, it’s time to visualize our forecasting data.
Insert a Chart: Go to ‘Insert > Chart’ and select a relevant chart type; a Waterfall chart works well for this visualization.
Customize the Chart: Customize your chart to display estimated sales revenue by forecast category.
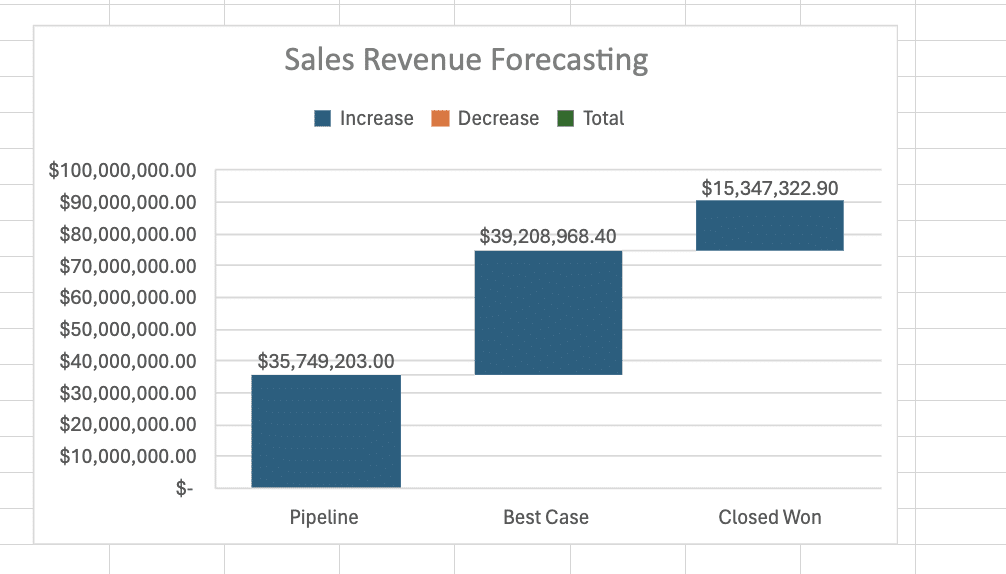
And there you have it!
With just a few clicks, you’ve been able to import your Salesforce opportunity data into Excel and forecast your sales revenue automatically.
Simplify Your Sales Forecasting with Excel and Coefficient
Automating sales forecasting doesn’t have to be complicated. With the Salesforce Excel integration offered in Coefficient, businesses can streamline their forecasting process, creating a transparent view of their sales pipeline and estimated revenue.
Leverage the power of Excel and Coefficient today to enhance your sales forecasting. Simplify your process, reduce errors, and gain insightful forecasts that help in making informed business decisions for a successful go-to-market strategy.
Remember: the blend of Excel’s flexibility and the seamless integration with Salesforce through Coefficient paves the way for more efficient and accurate sales forecasting. Begin your journey toward streamlined sales forecasting today!
Get started for free with Coefficient today to learn more.


