
Struggling to identify your hottest leads in HubSpot? Stop guessing which prospects deserve your sales team’s attention. Our free HubSpot Lead Scoring template gives you instant clarity on lead quality with pre-built dashboards.
What is a Lead Scoring Report?
A lead scoring report is a strategic dashboard that evaluates and ranks prospects based on their likelihood to convert.
It assigns numerical values to each lead based on their demographic information, engagement levels, and behavioral patterns. The higher the score, the more sales-ready the lead.
This scoring system helps sales teams prioritize their outreach efforts, focusing on leads most likely to convert while nurturing those that need more time. For marketing teams, it provides valuable insights into which campaigns generate the highest quality leads, allowing for better resource allocation and strategy refinement.
Benefits of using HubSpot Lead Scoring Template
See your hottest prospects at a glance
No more digging through HubSpot data. Our template visually categorizes leads as Hot, Warm, or Cold, letting your sales team focus on the most promising opportunities first.
Make data-driven decisions
Track conversion rates by lead temperature. See which lead sources, industries, and job titles convert best. Use these insights to refine your targeting and boost your conversion rates.
Bridge the sales-marketing gap
Give both teams a single source of truth. Marketing can see which campaigns generate quality leads, while sales gets clear prioritization guidance. The result? Better alignment and fewer missed opportunities.
Optimize your scoring model
Compare average scores against conversion rates to fine-tune your scoring model. If high-scoring leads aren’t converting, your model needs adjustment. If low-scoring leads convert too often, you’re missing opportunities.agers use this dashboard for daily check-ins, weekly team meetings, and quarterly planning sessions.
Metrics Tracked in the Report
🔢 Lead Scoring & Temperature Metrics
- Overall Lead Score – A numeric evaluation (0–100) of each lead’s quality
- Lead Temperature – Categorized as Hot (80–100), Warm (51–79), or Cold (0–50)
- Average Lead Score – The mean score across all leads in your system
📈 Lead Volume & Conversion Metrics
- Total Lead Count – Complete number of leads in your pipeline
- Lead Count by Conversion Status – Segments leads by whether they’ve become customers
- Converted (Boolean) – Simple TRUE/FALSE indicator of conversion status
🧠 Segmentation Metrics
Each category breaks down leads by volume and temperature (Cold/Warm/Hot):
- Lead Count by Temperature – Pie chart showing percentage distribution of Hot, Warm, and Cold leads
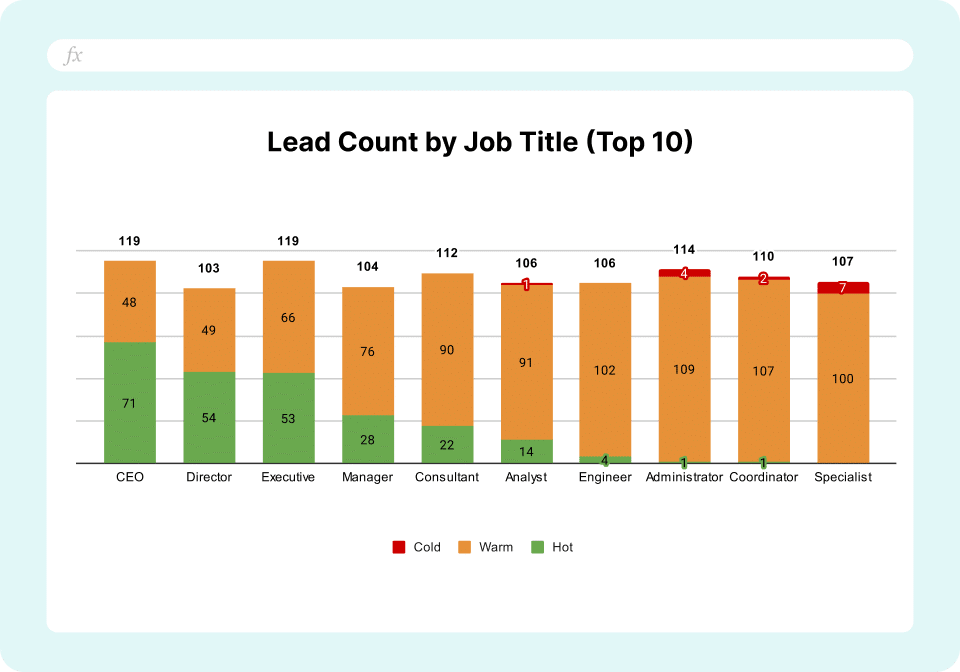
- Lead Count by Job Title – Bar chart of your top 10 job titles with temperature breakdown
- Lead Count by Industry – Visual breakdown of your top 10 industries
- Lead Count by Country – Geographic distribution of your top 10 countries
- Lead Count by Company Size – Segmentation by number of employees
📋 Lead Detail Table
Comprehensive table showing:
- Full Name
- Lead Source
- Title
- Industry
- Company Size
- Country
- Conversion Status
- Overall Score
- Temperature
More Metrics to track and analyze on Google Sheets
Beyond lead scoring, Coefficient’s HubSpot integration lets you pull additional metrics into your spreadsheets:
- Contacts & Companies – Import complete contact and company records for deeper analysis
- Deals – Track pipeline progress, deal values, and close rates
- Communications – Analyze emails, calls, and meetings to optimize outreach
- Marketing Performance – Pull campaign metrics, email engagement, and form submissions
- Products & Orders – Examine purchase patterns and product performance
- Tickets & Support – Analyze customer service data to improve satisfaction
Connect once and refresh data with a single click, keeping your analyses current without manual exports.
Ready to streamline your lead scoring?
Get started in minutes:
- Click “Use Template” below
- Connect your HubSpot account
- Watch as your dashboard populates automatically