


Table of Contents
![]()
- 1. 8 Ways to Improve Query Optimization in Snowflake (With Examples)
-
2. How to Prevent Data Silos Using Snowflake Semantic Views
- The Silo Problem Nobody Is Talking About
- What Actually Creates Data Silos (It Is Not What Most Teams Think)
- How Snowflake Semantic Views Address the Root Cause
- The Last-Mile Gap: Where Silos Re-Emerge Despite Semantic Views
- Closing the Last-Mile Gap: How to Extend Semantic Views to Every Surface
- How Coefficient Closes the Last-Mile Gap for Spreadsheet Users
- What Semantic Views Cannot Fix on Their Own
- The Silo Is in the Last Mile, Not the Warehouse
- 3. Snowflake Semantic Views vs Semantic Model: Key Differences Explained
- 4. What Is Snowsight? A Complete Guide to Snowflake’s Web Interface
- 5. How Snowflake Customers Can Unlock More Value through Last-Mile Activation
- 6. From Snowflake Intelligence to the Spreadsheet: A Builder’s Guide to Last-Mile Data Activation
- 7. How to Ingest Data into Snowflake: Methods, Tools, and Best Practices
- 8. How to Query JSON Data in Snowflake
- 9. How to Copy Data from One Table to Another Table in Snowflake
- 10. How to Load Unstructured Data in Snowflake: Files, Documents, and AI Pipelines
- 11. How to Flatten JSON Data in Snowflake
- 12. How to Load Data into Snowflake
- 13. How to Parse JSON Data in Snowflake?

| Quick Answer Snowflake Semantic Views prevent data silos by centralising metric definitions at the warehouse layer, so every tool that queries them reads the same governed logic rather than reinterpreting raw data independently. But Semantic Views alone do not close the full gap. The most common silo point is not in BI tools or databases. It is in the spreadsheets business teams build from CSV exports that bypass the Semantic View entirely. Closing that last-mile gap requires routing every downstream data path, including spreadsheets, through the governed layer. |
The Silo Problem Nobody Is Talking About
Companies invest in Snowflake to become data-driven. Then they watch the same inconsistency problem re-emerge inside the tools their teams use every day. Finance has one revenue number. RevOps has another. The data warehouse has a third. Everyone believes their number is correct because, by their own definition, it is. The data is not siloed in the traditional sense. It is all technically accessible. The silo is in the metric definitions themselves, duplicated across every tool that touches the data. Snowflake Semantic Views address the root cause. But only if the path from warehouse to spreadsheet actually passes through them.
What Actually Creates Data Silos (It Is Not What Most Teams Think)
Most writing on data silos focuses on disconnected systems, legacy tools or departmental politics. Those contribute. But the deeper cause is that metric logic gets duplicated at every consumption layer. Finance defines Revenue in an Excel formula. RevOps defines it in a Salesforce calculated field. The data team defines it in a dbt model. Tableau defines it again as a calculated measure. Each definition is created independently. Each drifts over time. The silo is not in the storage layer. It is in the logic layer.
Picture a quarterly business review where finance, sales and marketing each present a different pipeline number. All three are technically correct by their own definition. The argument that follows is not a data quality problem. It is an architectural one. Metric definitions were allowed to proliferate across tools, and now nobody agrees on what the number should be.
Three root causes drive this consistently. First, metric logic defined at the consumption layer, inside BI tools, spreadsheet formulas and saved reports, with no shared source. Second, CSV exports that carry a static snapshot of data rather than a governed definition, breaking the governance chain the moment the file is downloaded. Third, inconsistent access patterns where some teams use governed tools and others reach for workarounds. Research on data silo causes consistently points to these patterns as the primary drivers of metric fragmentation in mid-market and enterprise organisations.
How Snowflake Semantic Views Address the Root Cause
Semantic Views are schema-level objects in Snowflake where data teams define metrics, dimensions and entity relationships once. When any tool queries a Semantic View, it reads the definition the data team built, not a copy or reinterpretation of it. This is the architectural fix the logic-layer problem requires. You can read the full technical specification in Snowflake’s Semantic Views documentation.
Three things make this meaningful in practice. First, metric centralisation. Net Revenue has one formula, defined once in the Semantic View, inherited by every downstream tool that queries it. When the definition changes, it changes in one place. Every connected tool picks up the update automatically, rather than requiring someone to track down five Tableau dashboards, three Excel models and two Salesforce reports and update each one manually.
Second, schema-level access control. Snowflake’s role-based access control applies natively to Semantic Views. The data team can grant or restrict access to specific views or metrics the same way they would on a table. Governance is not just in the definitions. It is enforced at the access layer too.
Third, the same definition powers every surface. BI tools like Sigma and Tableau have native Semantic Views integration. Cortex Analyst uses them for natural language queries. When every tool reads from the same Semantic View, the quarterly business review argument disappears. There is one number because there is one definition.
The Last-Mile Gap: Where Silos Re-Emerge Despite Semantic Views
Here is the part most data teams underestimate. You can build a perfect Semantic View and still have data silos, because most business users access data through paths that bypass the Semantic View entirely.
CSV exports from Snowflake skip it. Direct API calls to raw tables skip it. Saved Salesforce reports built before the Semantic View existed skip it. Excel models assembled from downloaded CSVs skip it. The governance chain breaks at the last mile, which is precisely where human decision-making happens.
Spreadsheets are the highest-risk surface for a specific reason: they are the most widely used analytical interface in most organisations. Finance, RevOps, FP&A and sales ops all run critical workflows in Google Sheets or Excel. And most methods of getting Snowflake data into a spreadsheet, manual exports, direct ODBC connections to raw tables, or CSV uploads, bypass the Semantic View entirely. The data arrives without the metric definition that makes it trustworthy.
This is not a criticism of spreadsheets. It is a systems design observation. The semantic layer you invested in building stops at the warehouse boundary unless you actively close every downstream path that goes around it.
Closing the Last-Mile Gap: How to Extend Semantic Views to Every Surface
Step 1: Audit Every Downstream Data Path
Before fixing the governance gap, you need to know where it breaks. Map how each team actually gets their data today. Finance, RevOps, sales ops, marketing. For each team, ask: where does the data come from, and does that path pass through the Semantic View or around it?
The bypass paths tend to be the same across organisations. CSV exports downloaded from Snowsight and uploaded to Google Sheets. Direct Snowflake connections configured against raw tables rather than Semantic Views. Saved reports in Salesforce or HubSpot built before the Semantic View existed. BI dashboards connected to raw tables that predate the semantic layer. Each of these is a point where the governed definition gets replaced by someone else’s interpretation.
Prioritise the paths that carry the most decision-critical data. The finance team’s monthly close workbook. The RevOps pipeline dashboard. The FP&A forecast model. These are the highest-impact places to close the gap first.
Step 2: Replace CSV Export Workflows With Governed Spreadsheet Connections
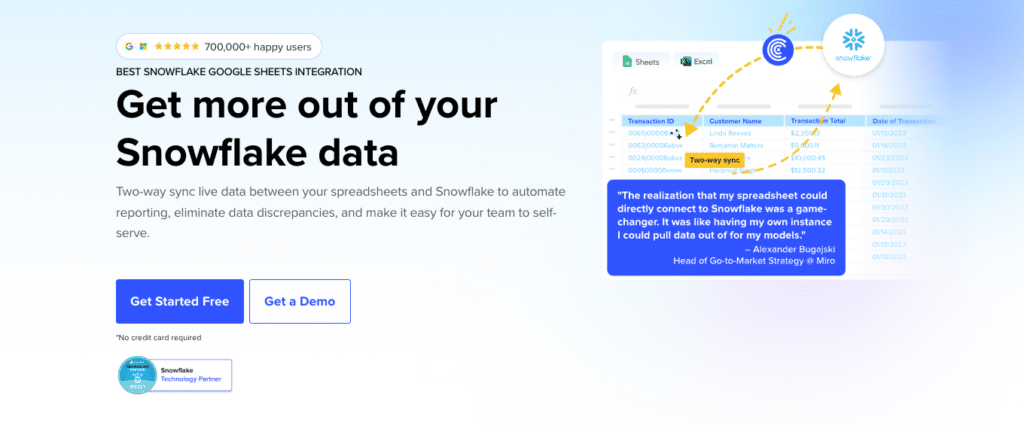
For teams that live in Google Sheets or Excel, a connector that surfaces Snowflake Semantic Views directly inside the spreadsheet is the highest-impact fix. It replaces the most common bypass path, the CSV export, with a governed connection that reads from the Semantic View rather than from raw tables.
This is exactly what Coefficient does. Coefficient’s Snowflake connector, now generally available, surfaces Semantic Views inside Google Sheets and Excel via a Metrics and Dimensions picker. A finance manager opens the Coefficient sidebar, connects to Snowflake, and sees the Semantic Views their data team built alongside regular tables. They click into a view, select the metrics they need, such as ARR, net revenue retention or churn rate, choose their dimensions, and Coefficient generates the correct SEMANTIC_VIEW() query automatically. The data lands in the sheet. The governance chain is preserved end to end.
Schema-level permissions carry through the connection. Business users only see the Semantic Views and metrics they have been granted access to in Snowflake. The data team retains control as access expands.
How Coefficient Closes the Last-Mile Gap for Spreadsheet Users
The last-mile problem is specific: business users need governed data in spreadsheets, and most routes to get it there bypass the governance layer. Coefficient is built around closing that specific gap.
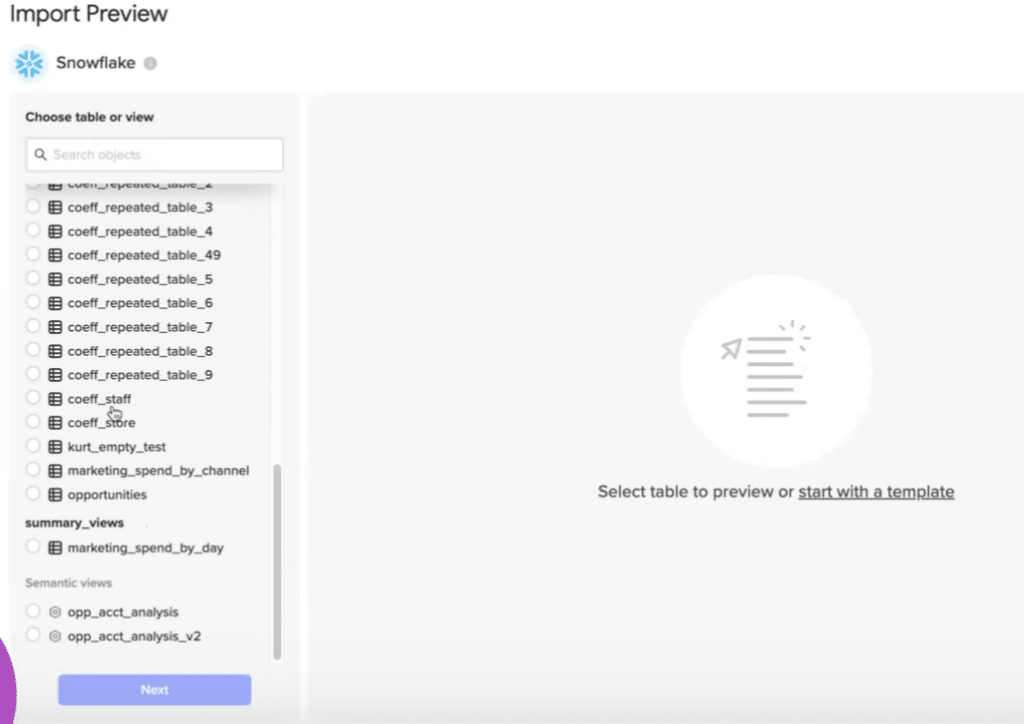
The Metrics and Dimensions Picker
When a user opens a Semantic View in the Coefficient import flow, they see a grouped list of metrics and dimensions labelled with the business-friendly names the data team defined, not raw column names. Field descriptions pulled from Snowflake metadata sit alongside each option. The user selects what they need, and Coefficient generates the underlying query. No SQL knowledge required. The metric definition stays exactly as the data team intended it.
Auto-Refresh Scheduling
A governed connection is only useful if the data stays current. Coefficient lets users schedule automatic refreshes at hourly, daily or weekly intervals. The finance team’s ARR tracker updates every morning without anyone touching it. The RevOps pipeline dashboard reflects yesterday’s data when leadership opens it. The FP&A model does not require a new data pull every time actuals change.
Two-Way Sync
Closing the last-mile gap is not just about reading from the governed layer. It is about keeping the full data loop inside it. Coefficient’s two-way sync lets teams push updates back to Snowflake directly from the spreadsheet. A finance manager adjusts a budget figure, and the change writes back to Snowflake without a manual re-entry step or a disconnected file being emailed around. The update path stays governed.
Live Web Dashboards
For teams that need to share governed Snowflake data beyond the spreadsheet, Coefficient’s Live Web Dashboards feature lets users publish a live, shareable dashboard directly from their spreadsheet model with one click. Describe the dashboard you want in plain English. Coefficient builds it from the live Snowflake data already in the sheet. Leadership gets a URL that always shows current numbers, without needing spreadsheet access or a BI tool licence. The governed data reaches every stakeholder surface without leaving the governed pipeline.
Real-World Impact
Klaviyo extended their Snowflake investment to over 50 business users using Coefficient. What previously required months of manual data operations was reduced to days. Governance was preserved throughout because the connection routes through Semantic Views rather than raw tables. Read the full story.
Step 3: Enforce Governed Access for BI Tool Connections
BI tools like Sigma and Tableau have native Semantic Views integration. If your teams are currently using those tools to query raw Snowflake tables, reconfigure the connections to route through Semantic Views instead. This is a data engineering task, not a business user task, but it is worth doing systematically once the Semantic Views are in place. Every surface that reads from the governed layer rather than raw tables is one fewer place where metric definitions can drift.
What Semantic Views Cannot Fix on Their Own
Semantic Views solve the metric definition problem. They do not automatically solve the access problem if business users cannot reach them through a governed path. Building a Semantic View is the necessary first step. Closing every downstream bypass path is the work that follows.
Maintaining Semantic Views requires data engineering ownership and ongoing governance. The Analytical Context Engineer role is emerging in data teams specifically because someone needs to own the accuracy and currency of semantic definitions as the business evolves. A Semantic View that is correct today can drift from business reality if nobody is responsible for keeping it updated.
Changes to underlying physical tables can also break Semantic Views if not managed carefully. Schema updates need to be coordinated with semantic layer maintenance. This is standard data engineering hygiene but worth naming explicitly for teams building toward this architecture for the first time.
And Cortex Analyst natural language querying, while powerful for Snowflake-native surfaces, does not extend to spreadsheets through this integration. The Coefficient connection covers structured import, scheduled refresh and the two-way sync layer. Natural language querying against Semantic Views inside Snowflake remains a separate capability in the Snowsight interface.
The Silo Is in the Last Mile, Not the Warehouse
Data silos are not a storage problem. They are a metric definition problem that re-emerges at every point where data leaves the governed layer through an ungoverned path. Snowflake Semantic Views fix the definition layer. Closing the full gap requires ensuring that every tool and surface business teams use to access data passes through that definition, not around it. For the spreadsheets where most operational decisions actually happen, Coefficient closes that gap by surfacing Semantic Views directly inside Google Sheets and Excel, governed end to end, auto-refreshed, with two-way sync back to the source. Try Coefficient free and connect your first Semantic View to a spreadsheet today.
