Table of Contents
![]()
- 1. Better Salesforce Opportunity Stages, Better Forecast: Here’s How
- 2. How to create a report in Salesforce?
- 3. A Guide to Custom Report Types in Salesforce
- 4. How to Create a Matrix Report in Salesforce
- 5. Joined Reports in Salesforce: Step-by-Step Tutorial
- 6. How to export opportunities from Salesforce
- 7. How to Build a Stage Report in Salesforce: A Step-by-Step Guide
- 8. How to Build a Salesforce Summary Report
- 9. How to Workaround Salesforce Report Limitations?
- 10. How to Clone a Report in Salesforce (And How to Never Do it Again)
- 11. How to Pull a Report in Salesforce
- 12. How to Share a Report in Salesforce
- 13. The Easy Way to Do Salesforce Field History Tracking
- 14. The Easy Way to Solve Salesforce Opportunity Management Problems

Whether you’re tracking sales trends, monitoring customer interactions, or evaluating team performance, the ability to pull detailed reports from Salesforce is indispensable.
This guide offers a straightforward path to mastering report generation in Salesforce, empowering you to unlock actionable insights and make informed decisions that drive business success.
Understanding Salesforce Reports
Salesforce reports are essential tools for analyzing and interpreting customer data. They offer diverse chart types, including line graphs, pie charts, and bar charts, providing an in-depth look at trends and KPIs.
The ability to customize these reports allows businesses to focus on metrics critical to their specific goals. A standout feature is the real-time data provision, giving decision-makers up-to-the-minute insights for a competitive edge.
Step-by-Step Guide: Pulling a Report in Salesforce
Start by accessing the Reports section in Salesforce to view available reports.
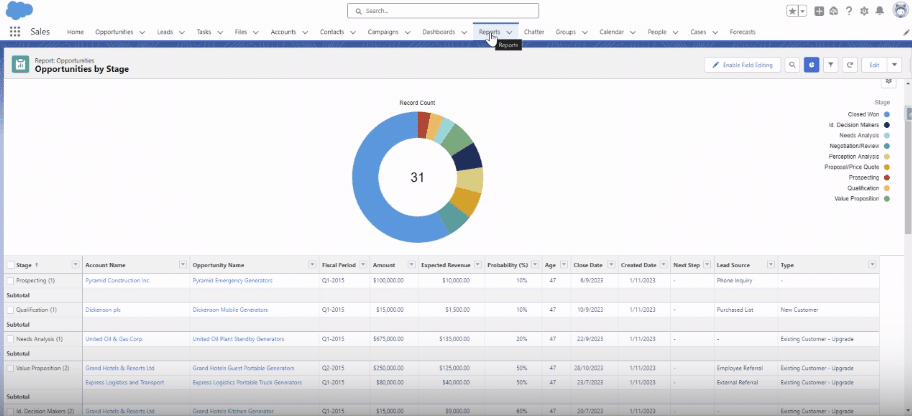
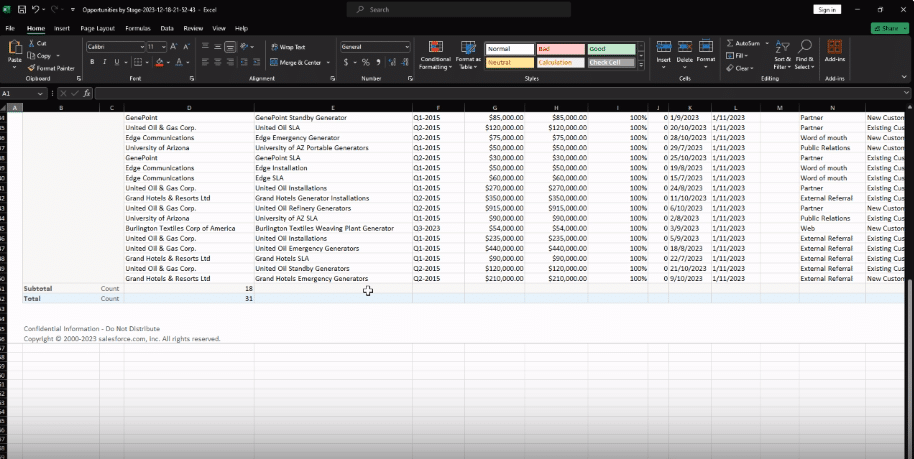
Select the ‘Opportunities by Stage’ report to proceed.
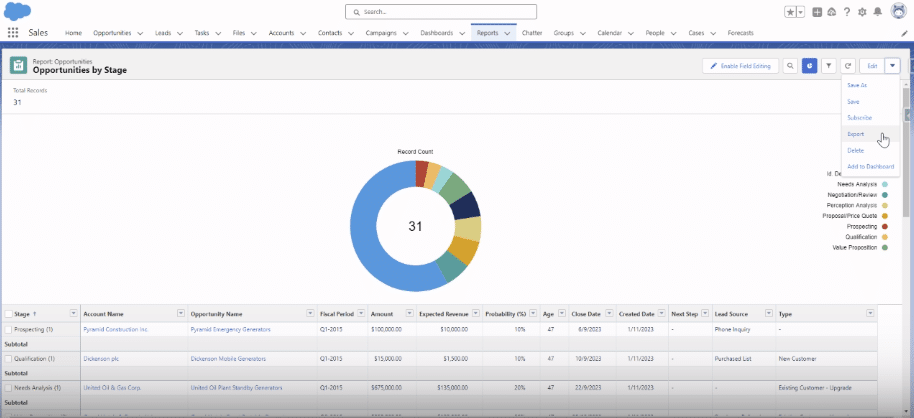
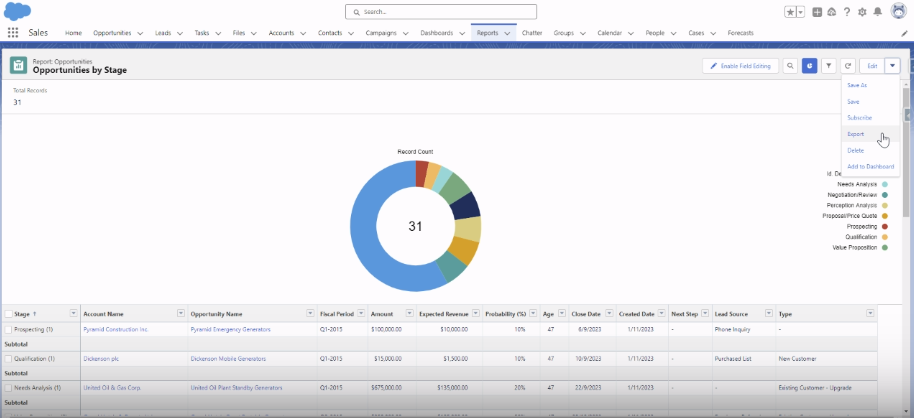
Choose the ‘Exports’ option
Select ‘Formatted Report’. Then, choose Excel (.xlsx) format for export.
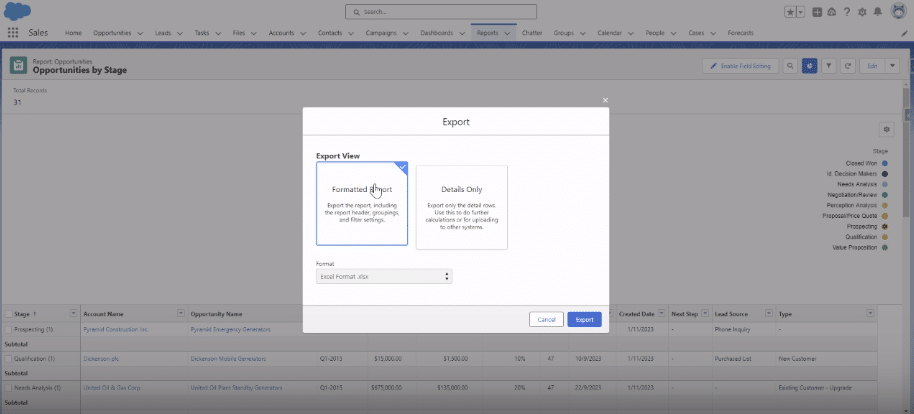
Once exported, the report will be available in your downloads folder as an Excel file, ready for analysis.
Tips for Effective Salesforce Reporting
- Start with a Strategic Plan: Align your reporting with your organizational goals to ensure relevancy and focus.
- Understand Report Types: Get to know the various report formats available in Salesforce, such as Tabular, Summary, Matrix, and Joined reports, and choose the one that best suits your needs.
- Optimize Report Filters: Use filters effectively to hone in on specific criteria, ensuring your reports provide targeted, useful insights.
- Customize Report Formats: Tailor the visual presentation of your reports (graphs, charts, dashboards) to match your audience’s preferences and enhance understanding.
- Utilize Dashboard Components: Make use of dashboard tools in Salesforce to combine multiple reports into a robust, comprehensive view.
- Display Relevant Data: Avoid clutter and confusion by focusing on data that is pertinent to your business needs, steering clear of unnecessary information overload.
Use Cases: Types of Salesforce Reporting
- Tabular Report: Ideal for evaluating individual performances within a sales team.
- Summary Report: Provides an overview of quarterly revenue across different product categories.
- Matrix Report: Useful for analyzing sales performance by product region and category.
- Joined Report: Combines data from various Salesforce objects, perfect for assessing marketing campaign effectiveness.
Troubleshooting Common Issues
Salesforce reporting helps businesses generate vital insights to make informed decisions. However, there are some common issues that users may experience.
Here are some solutions to problems to unlock a smooth experience.
- Data Quality Issues. Data completeness and accuracy issues can be solved by conducting frequent data audits and incorporating validation protocols to establish data integrity.
- Complex Report Structures. Using folders, subfolders, and cross filters helps to reasonably organize reports to prevent complex report structures.
- Performance Optimization. Report performance can be enhanced by utilizing indexed fields reducing the use of formula fields, filters, and aggregations.
- Security Challenges. Use field-level security to prevent access to sensitive data. Constantly review and update security settings.
Conclusion
Before you consider pulling a Salesforce report, it is crucial to have a plan and ensure it aligns with your business’s overall objectives. Also, get familiar with the report types, report filters, dashboard components, and troubleshooting tips to solve common issues.
Ready to optimize your Salesforce reporting? Get started with Coefficient today.