Salesforce reporting tools have revolutionized how sales managers extract and analyze customer data, sales rep performance, summary reports, and more with the leading Customer Relationship Management (CRM) tool.
There are several powerful, cloud-based reporting tools available on Salesforce AppExchange today, each offering unique features and capabilities. Let’s explore the pros and cons of each tool to understand which one stands out as the best choice for consumers.
Salesforce Reporting Tools Feature Comparison Table
To help you make an informed decision in the crowded Salesforce reporting tools market, we’ve put together a comprehensive feature comparison table. This side-by-side overview highlights the strengths of each tool and will help inform your decision.
| Salesforce Reporting Tool | Row Limits | Data Sources | Builder License Cost | Viewer License Cost | AI Functionality | Refresh frequency | Alerts | SOC 2 Compliant |
| Native Salesforce Reports and Dashboards | 2000 | Salesforce only | $25-$75 | $25-$75 | Limited Einstein Access | Live Data | Slack / Email | Yes |
| Tableau | none | $70 | $15 | “AskData” Natural Language Requests | Hourly | Slack / Email | Yes | |
| Coefficient | none | 25+ | $49 | Free | “GPT Copilot:” build formulas, pivot tables and charts using natural language | Hourly | Slack / Email | Yes |
| Xappex | 2000* | Salesforce only | $25 | Free | None | Hourly | Slack / Email | Yes |
| Coupler | 10,000 – 100,000 | 70+ | $49 | Free | None | Every 15 mins on its top-tier plan | None | No |
| G-Connector for Salesforce | 2000* | Salesforce only | Free | Free | None | Every 4 hours | None | No |
1. Native Salesforce Reporting
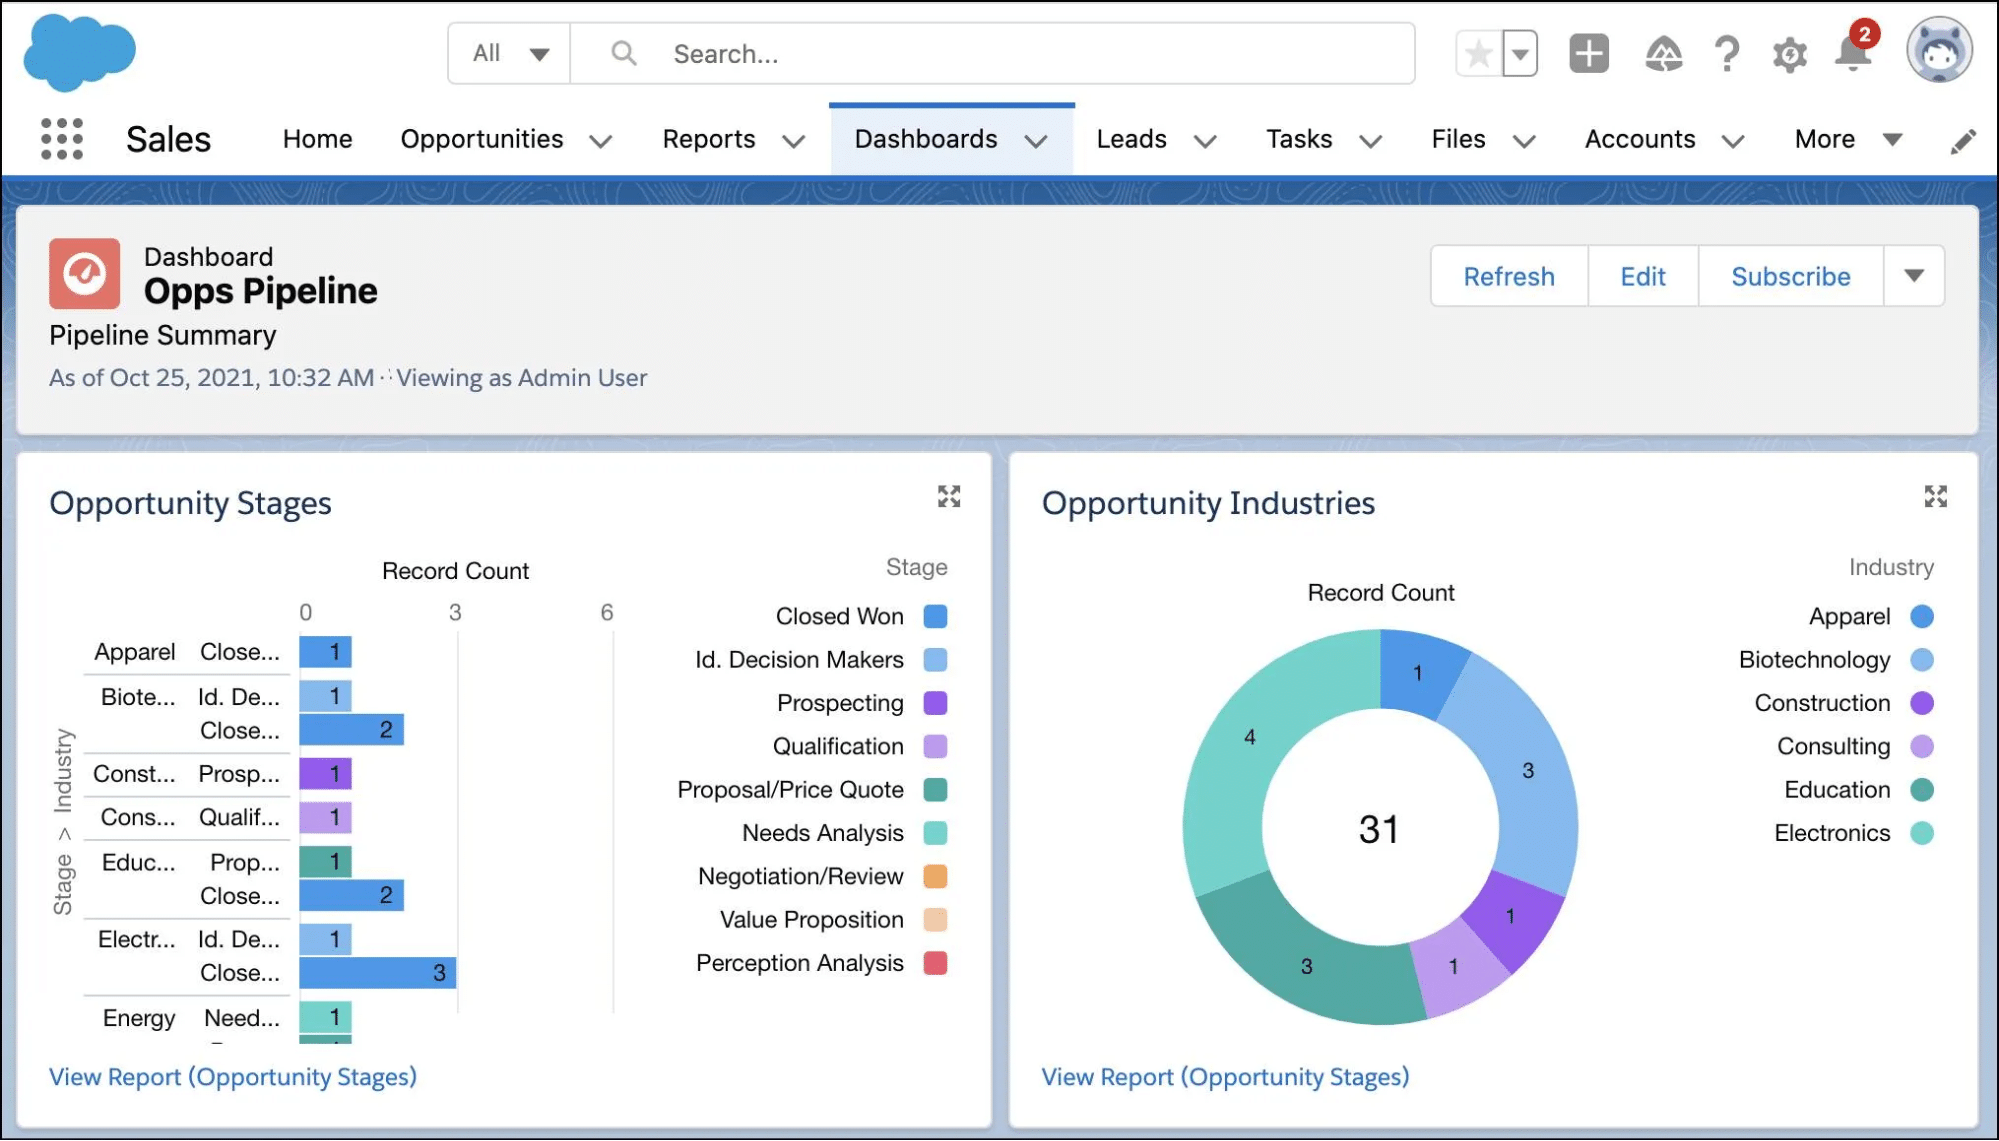
Native Salesforce CRM report builder is a great choice for users who prioritize seamless integration and user-friendliness. But many find its reports fall short to other Salesforce reporting tools regarding advanced visualization, types of reports, and complex data reporting.
Pros
Integration with Salesforce: Salesforce’s native reporting tool integrates with your existing Salesforce data, eliminating the need for external data connections to create Salesforce dashboards.
Ease of Use: It is user-friendly, which makes it accessible to both non-technical and technical users working with metrics.
Real-time Data: You can access real-time Salesforce data without delays, which can be essential for decision-making and measuring KPIs.
Cons
Limited Visualizations: Native Salesforce reporting lacks the advanced visualization capabilities offered by third-party tools, making it less suitable for complex data analysis.
Data Volume Restrictions: Large datasets can cause performance issues, leading to slower reports and limited data exports.
Licensing Restrictions: Employees without SFDC (Salesforce Dot Com) licensing will not be able to access Salesforce reports. Only Salesforce users can create and send reports, which often leads businesses to plug-in additional reporting tools.
2. Tableau
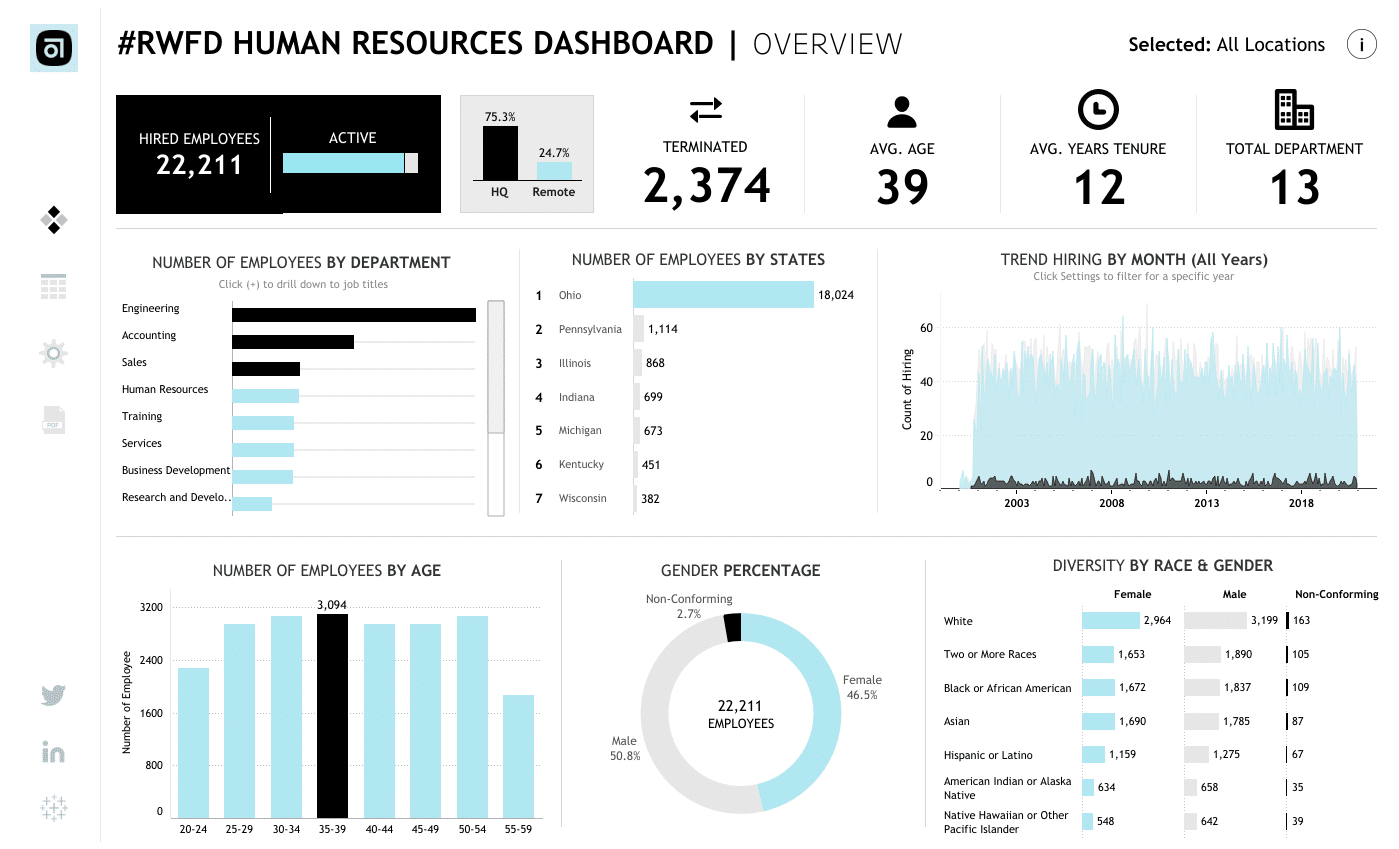
Tableau’s exceptional data visualizations make it a top choice for enterprises willing to invest in its high-end features and functionalities.
Pros
Robust Visualization: Tableau excels in data visualization, offering a wide range of charts, graphs, and interactive dashboards for comprehensive data analysis.
Data Blending: It allows combining data from multiple sources, providing a holistic view of business data and facilitating more in-depth insights.
Scalability: Tableau can handle large datasets and complex analytical queries, making it a suitable Salesforce reporting tool for enterprises with extensive data needs.
Cons
Costly Licensing: Tableau’s licensing costs can be prohibitive, especially for smaller organizations with limited budgets.
Dependence on Data Engineers: Complex data integrations may necessitate assistance from data engineers, adding to the cost.
Tableau Cloud: The SaaS version of Tableau Server is an additional purchase, and it is necessary for users to publish reports and collaborate.
Pricing
Tableau starts at $70 per month per user for a Tableau Creator license.
Reviews
- The features of Tableau are very user-friendly, which enables users to merge and present data from data sources and present in such a way that anyone can understand the data. Also, the data can be updated automatically, and there is no need to update it or refresh it every time (source).
- Some users report Tableau Cloud’s dashboard, and reporting capabilities are limited compared to the desktop version (source).
Note: Add-ons like Coefficient can integrate with Tableau to allow teams to access Tableau data for customer reporting.
3. Coefficient
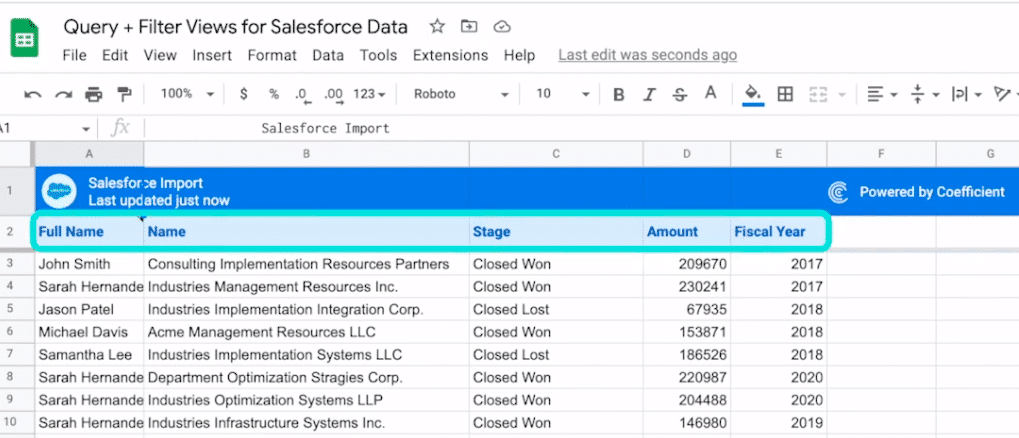
When it comes to Salesforce reporting tools, Coefficient stands out by combining the best of both worlds: the simplicity of spreadsheets and the power of more traditional data analytics solutions. Coefficient is a free Google Sheets add-on that syncs live data from your favorite business systems directly to your spreadsheet.
It’s the go-to tool for those who love the ease of spreadsheets but also want deep insights from their data. It also offers best-in-class AI solutions to help users new to spreadsheets get started, catering to users of all levels.
Pros
Simplicity in Setup: Coefficient’s easy setup and minimal coding requirements mean that whether you’re a data analyst or a marketing professional, Coefficient’s intuitive interface ensures a short learning curve.
Tailored Data Imports: You can select specific fields from your dashboard, sort and filter them according to your requirements, and seamlessly sync them to Google Sheets.
Automated Data Syncing: You can set up an auto-refresh schedule for your synced data. This means your Google Sheets will always reflect the latest information, eliminating the need for constant manual updates so that your team can focus on more critical tasks.
Cons
User Familiarity: Coefficient is designed for optimal use with spreadsheet tools. For those less familiar with spreadsheets, there might be a slight learning curve. But, thanks to Coefficient’s AI-driven capabilities, the platform becomes more intuitive and accessible to users across different technical levels.
Pricing
With Coefficient, you can import data from any source into Sheets at no cost. For those seeking advanced features, our pricing is set at $49 per user, per month with an annual contract. If you prefer a month-to-month arrangement, it’s $59 per user, per month.
Reviews
- The sheer brilliance of easily syncing any data from any source into Google Sheets is just amazing. It’s dead simple to use, works smoothly, and gets the job done (source).
- Coefficient has been incredibly helpful at exporting powerful reporting from various tools to share across our organization, regardless of the licenses we have for the actual tool itself (i.e. Salesforce) – beyond that, you’re able to do more impactful analysis and data manipulation through the export into sheets while still maintaining that real-time information (source).
- I would have loved to have some templates, and a guide to select which data could be useful in my different google sheets. For someone totally new with datasheets it can be a bit hard to understand (source).
Don’t miss the opportunity to tap into Coefficient’s treasure trove of free Salesforce Dashboard Templates.
4. Xappex
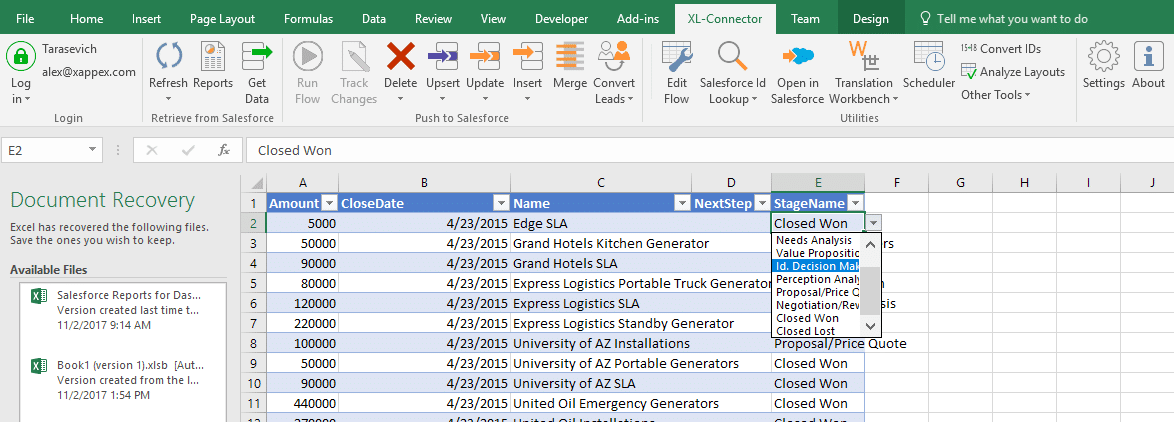
Xappex is a user-friendly Salesforce reporting tool that suits organizations looking for basic reporting features on key metrics, but it may not fulfill the advanced analytics needs of some businesses.
Pros
Drag-and-Drop Interface: Xappex offers an intuitive drag-and-drop interface, making it easy for users to create reports without coding skills.
Scheduled Reports: It allows users to schedule and automate report generation and distribution, ensuring timely delivery of critical data.
Customizable Dashboards: Xappex provides flexibility in customizing dashboards to match the branding and specific requirements of businesses.
Cons
Data Syncing Delays: Data syncing with Salesforce might encounter occasional delays, affecting real-time reporting accuracy.
Limited Advanced Analytics: While suitable for standard reporting needs, Xappex might lack some advanced analytical capabilities compared to other tools.
Customer Support: Some users might find Xappex’s customer support to be lacking in responsiveness or helpfulness.
Pricing
Xappex starts at $99 per user a year. Xappex is free to pull and refresh data from Salesforce.
Reviews
- I love that I can do an easy export and upload straight into Salesforce without having to use Salesforce’s data loader. I can set automated schedules with Office 365 (source).
- Some of the features do not have full documentation and if they do they are not so easy to find (source).
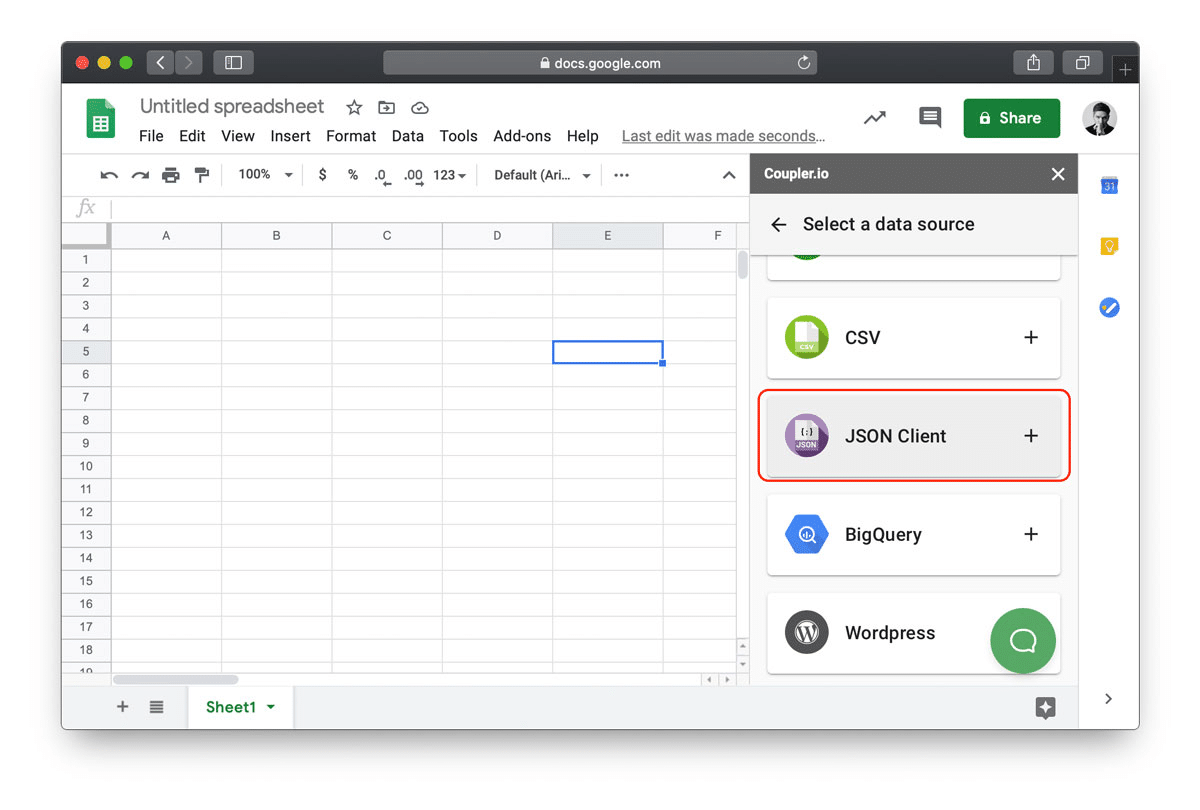
5. Coupler
Coupler is a Salesforce reporting tool sued by reporting teams that work with diverse data sources.
Pros
Easy Data Import: Coupler simplifies data importing from various sources, making it convenient to integrate data with Salesforce.
Customizable Reporting: Users can customize reports and dashboards to suit their preferences and business requirements.
Affordability: Coupler is often more budget-friendly compared to other sophisticated Salesforce reporting tools.
Cons
Visualization Capabilities: While Coupler offers visualization options, they might not be as extensive as some other tools in the market.
Data Volume Restrictions: Coupler face performance issues when dealing with massive datasets, affecting report generation speeds.
Complex Reporting: For intricate reporting needs, Coupler might have a steeper learning curve.
Pricing
Coupler starts at $19 per person per month for an annual contract.
Reviews
- Coupler made it easy to create dashboards and reports from different data sources. The sync is reliable and the user experience is amazing (source).
- It is sometimes difficult to get a clear overview if you have a lot of connectors, and some Quickbooks reports may not be available, but these problems are minor (source).
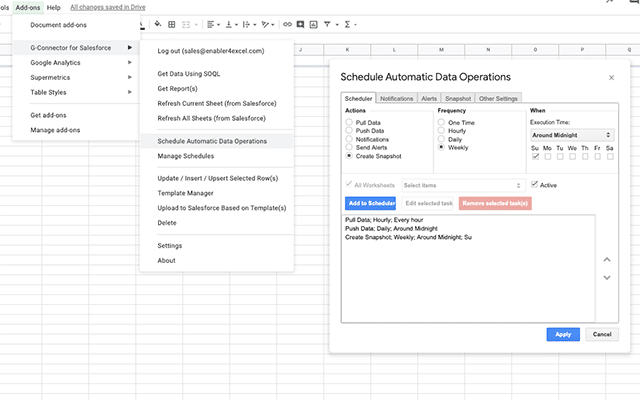
6. G-Connector for Salesforce
G-Connector is a suitable tool for organizations extensively using Google Workspace, providing real-time data sync and workflow automation capabilities.
Pros
Integration with Google Workspace: G-Connector seamlessly connects Salesforce data with Google Workspace apps, facilitating collaboration and data sharing.
Real-time Data Sync: It offers real-time data synchronization between Salesforce and Google Sheets, ensuring up-to-date reporting.
Automated Workflows: G-Connector allows users to automate workflows, reducing manual effort and improving productivity.
Cons
Limited Features: Compared to other standalone reporting tools, G-Connector might have fewer advanced features and visualizations.
Dependency on Google Sheets: Businesses may prefer a dedicated reporting software instead of relying on Google Sheets for analysis.
Security Concerns: There could be compliance requirements to address related to transferring data between platforms.
Pricing
G-Connector starts at $99 per user per year.
Reviews
- Essential in my day-to-day access to Salesforce Reports. Would highly recommend it to anyone who wants to automatically update and connect Salesforce Reports in Google Sheets easily. Great product (source).
- The solution does exactly what it claims to do. However, there are sometimes bugs that are difficult to work around when you’re dealing with larger reports (source).
Conclusion
In the vast landscape of Salesforce reporting tools, each business has unique needs and priorities. While many tools offer standout features, Coefficient is an optimal choice for those seeking the familiarity of a spreadsheet for granular-level analyses and a robust library of pre-built dashboards for reporting.
Install Coefficient for free today and witness firsthand how it can reshape the landscape of your business with unparalleled efficiency and strategic precision.


