


Table of Contents
![]()
- 1. 10 Best CRM Reporting Tools for 2026
- 2. Sales Velocity Tracking: How to Calculate and Track Overtime in Google Sheets
- 3. Average Deal Size: How to Measure + Optimize Forecasting (With Template)
- 4. How You Can Measure and Optimize Pipeline Velocity
- 5. How You Can Measure and Optimize Win Rate Today (2024 Guide)
- 6. Quota Attainment: How to Measure in 2026 (With Template)
-
7. Top 10 Sales Metrics to Track in 2025
- #1 Opportunity History
- #2 Revenue & Win Rates by Team and Rep
- #3 Sales to Target
- #4 Open Pipe
- #5 Total Contract Value
- #6 Sales by Country & Industry
- #7 Win / Loss Analysis
- #8 Outreach Sequence Performance
- #9 MOM Growth
- #10 Revenue Churn
- Advantages of Integrating Live Data From Various Systems into a Single Dashboard
- Success Story: How Jebbit Streamlined Sales and Revenue Operations with Coefficient
- 8. How to Analyze Sales Rep Performance in Google Sheets
- 9. 5 Sales Revenue Metrics to Measure Success in 2024 (With Templates)


In the fast-paced world of sales, tracking the right metrics is crucial for making data-driven decisions and optimizing your team’s performance. However, with so much data scattered across various systems, it can be challenging to get a clear, real-time view of your key performance indicators (KPIs).
That’s where Coefficient comes in, offering pre-built spreadsheet dashboard templates that integrate live data from your CRM and other platforms.
In this blog post, we’ll explore the top 10 sales metrics every company should track in 2024 and how Coefficient’s templates can help you streamline the process.
Top 10 Critical Sales Metrics to Track
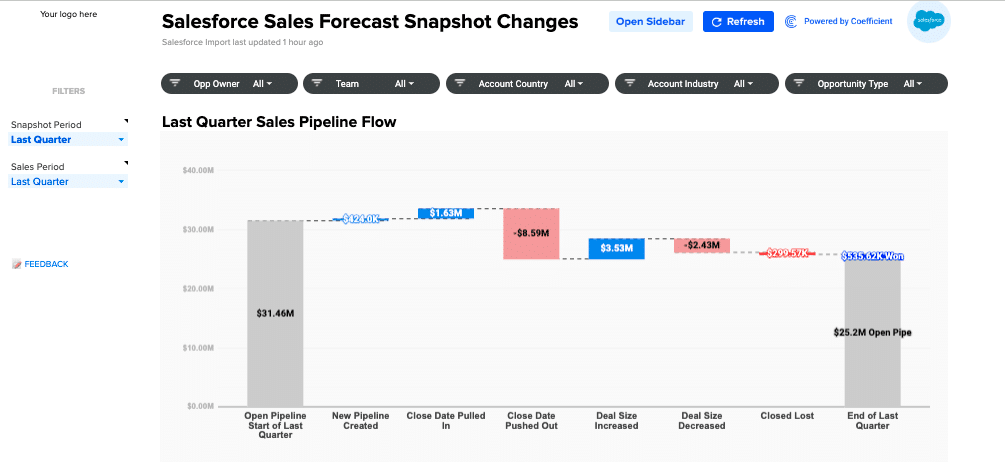
#1 Opportunity History
Tracking the progression of opportunities through the sales funnel is essential for understanding the health of your pipeline. By monitoring opportunity history, you can:
- Identify bottlenecks: Pinpoint stages where opportunities stall and take corrective action.
- Forecast accurately: Use historical data to predict future sales performance.
- Optimize sales processes: Continuously improve your sales approach based on data-driven insights.
How to Calculate: Measure the number of opportunities that move from one stage to another over a given period.
How Coefficient’s Opportunity History Template Can Help
Coefficient templates offer a streamlined approach to monitoring opportunity history by integrating real-time data, enabling you to make informed adjustments promptly.
- See What Works: Quickly identify stages where opportunities are progressing smoothly or getting stuck.
- Make Better Decisions: Use opportunity history data to guide process improvements and resource allocation.
- Customize Your Views: Create reports that make sense to you, so you can make smart decisions about your sales funnel.
Download the Opportunity History template and start optimizing your sales funnel today.
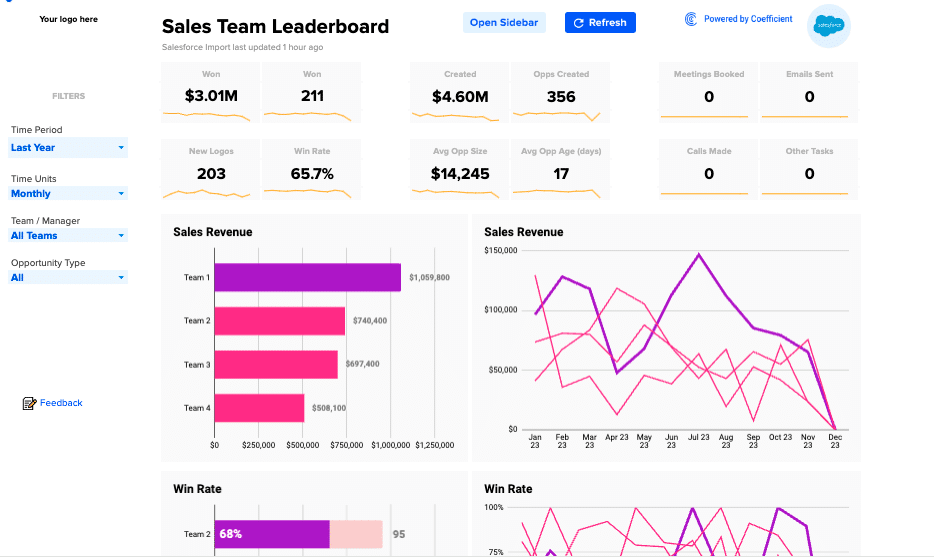
#2 Revenue & Win Rates by Team and Rep
Measuring revenue and win rates at the team and individual levels helps you identify top performers and areas for improvement. This metric offers several benefits:
- Performance benchmarking: Compare the performance of teams and reps against each other and industry standards.
- Targeted coaching: Provide personalized training and support to help underperforming reps improve.
- Resource allocation: Allocate resources and set quotas based on historical performance data.
How to Calculate: Revenue and win rates are calculated by dividing the total revenue or number of closed-won deals by the total number of opportunities for each team or rep.
How Coefficient’s Revenue & Win Rates by Team and Rep Template Can Help
Coefficient facilitates easy analysis of revenue and win rate data for your sales metrics dashboard, allowing for swift comparison and strategic enhancements based on live performance insights.
- Know What Converts: See clearly which teams and reps are driving the most revenue and closed-won deals.
- Keep Getting Better: Use real data to identify top performers and share their best practices across the team.
- See What’s Working: Identify the most effective sales strategies and tactics to focus your efforts.
Get started with the Revenue & Win Rates by Team and Rep template and unlock valuable insights.
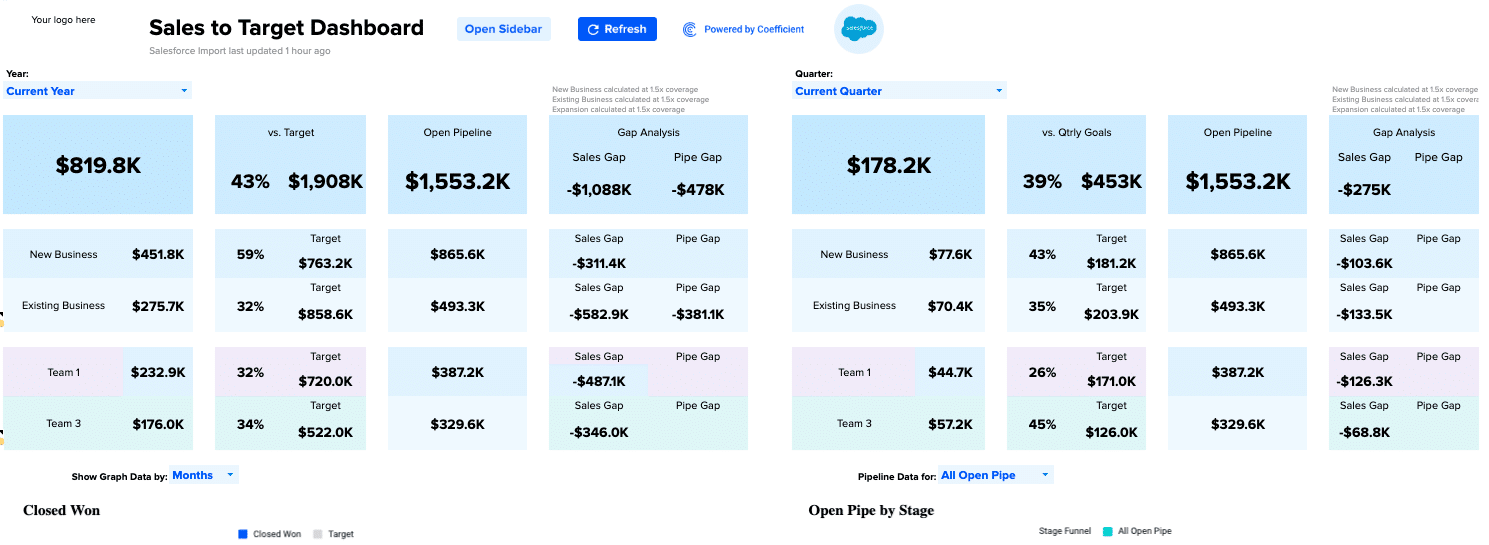
#3 Sales to Target
Monitoring sales performance against predetermined targets is critical for ensuring that your team is on track to meet its goals. By tracking sales to target, you can:
- Identify performance gaps: Quickly spot teams or reps who are falling behind and take corrective action.
- Adjust strategies: Modify sales strategies and tactics based on real-time performance data.
- Celebrate successes: Recognize and reward teams and reps who consistently meet or exceed their targets.
How to Calculate: Sales to target is calculated by dividing the actual sales by the target sales for a given period.
How Coefficient’s Sales to Target Template Can Help
Coefficient’s Sales to Target template makes it easy to monitor this metric, with live data integration and customizable dashboards.
- Track Progress: See how your team is performing against targets in real-time.
- Identify Trends: Analyze historical data to identify patterns and adjust strategies accordingly.
- Customize Alerts: Set up custom alerts to notify you when teams or reps are falling behind or exceeding targets.
Start tracking your sales performance against targets with Coefficient’s Sales to Target template.
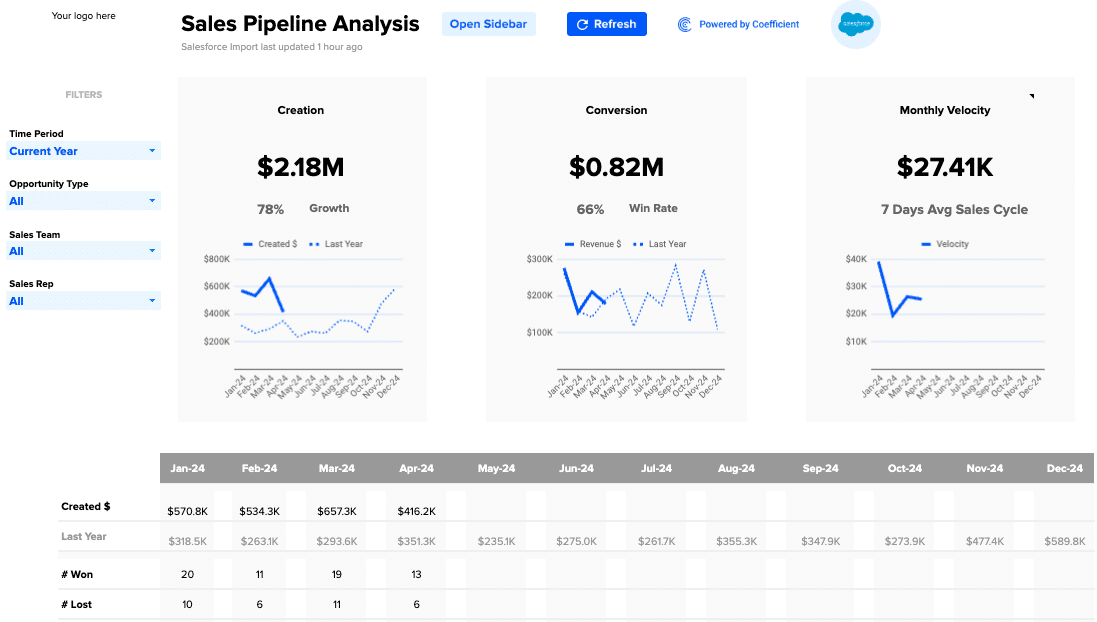
#4 Open Pipe
Open pipeline represents the total value of all open opportunities in your sales funnel. Monitoring this metric helps you:
- Forecast revenue: Use open pipe data to predict future revenue and make informed business decisions.
- Identify risk factors: Assess the health of your pipeline and identify potential risks, such as a lack of high-value opportunities.
- Allocate resources: Ensure that your sales team is focusing on the most promising opportunities.
How to Calculate: Open pipe is calculated by summing the value of all open opportunities in your CRM.
How Coefficient’s Open Pipe Template Can Help
Coefficient’s Open Pipe template simplifies this process, providing real-time visibility into your pipeline value.
- Monitor Pipeline Health: Quickly assess the value and distribution of open opportunities in your funnel.
- Forecast Accurately: Use historical open pipe data to predict future revenue and resource needs.
- Identify Risks: Spot potential risks, such as a lack of high-value opportunities or an unbalanced pipeline.
Gain a clear view of your open pipeline with Coefficient’s Open Pipe template.
#5 Total Contract Value
Total Contract Value (TCV) represents the total revenue generated from a customer over the lifetime of their contract, one of the key sales metrics every team member should be aware of, even your reps. Tracking TCV helps you:
- Identify high-value customers: Focus on acquiring and retaining customers with the highest lifetime value.
- Optimize pricing strategies: Use TCV data to inform pricing decisions and maximize revenue.
- Forecast long-term revenue: Project future revenue based on the expected lifetime value of your customer base.
How to Calculate: TCV is calculated by multiplying the average contract value by the average customer lifetime.
How Coefficient’s Total Contract Value Template Can Help
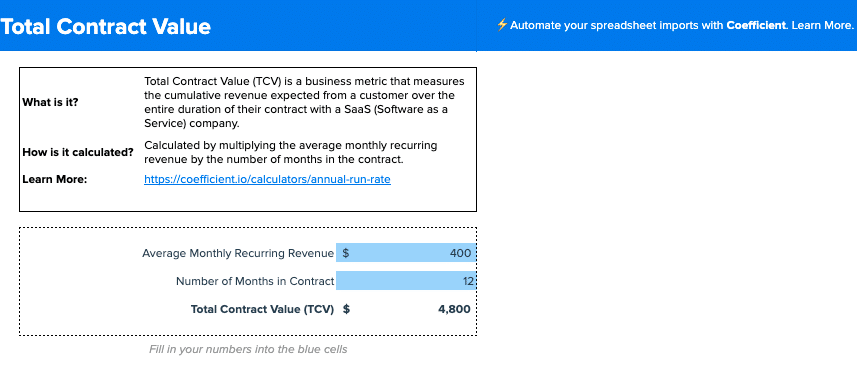
Coefficient’s Total Contract Value template makes it easy to track and analyze this critical metric.
- Identify Top Customers: Quickly identify customers with the highest lifetime value and prioritize retention efforts.
- Optimize Pricing: Use TCV data to inform pricing strategies and maximize revenue.
- Forecast Long-Term: Project future revenue based on the expected lifetime value of your customer base.
#6 Sales by Country & Industry
Analyzing sales performance by country and industry helps you identify growth opportunities and tailor your strategies to specific markets. This metric enables you to:
- Identify high-performing markets: Focus resources on countries and industries with the highest revenue potential.
- Adapt strategies: Customize sales approaches based on the unique needs and preferences of each market.
- Allocate resources: Optimize resource allocation by prioritizing markets with the greatest growth potential.
How to Calculate: Segment sales data by country and industry, and calculate the total revenue and growth rates for each segment.
How Coefficient’s Sales by Country & Industry Template Can Help
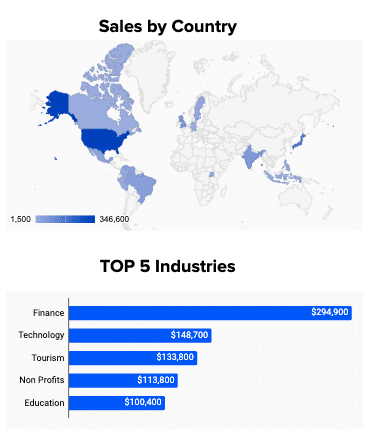
Coefficient’s Sales by Country & Industry template simplifies the process of analyzing this metric, with real-time data integration and customizable views.
- Identify Top Markets: Quickly identify the countries and industries driving the most revenue.
- Spot Growth Opportunities: Use historical data to identify markets with the highest growth potential.
- Customize Reports: Create reports tailored to your specific needs, so you can make informed decisions about resource allocation.
Start analyzing your sales performance by country and industry with Coefficient’s template.
#7 Win / Loss Analysis
Conducting win/loss analysis helps you understand the factors that influence your sales outcomes and identify areas for improvement. This metric offers several benefits:
- Identify success factors: Pinpoint the strategies, tactics, and behaviors that lead to closed-won deals.
- Address weaknesses: Identify and address the factors contributing to lost opportunities.
- Improve sales processes: Use insights from win/loss analysis to optimize your sales approach and increase win rates.
How to Calculate: Analyze closed-won and closed-lost opportunities, and identify the key factors that influenced each outcome.
How Coefficient’s Win / Loss Analysis Template Can Help
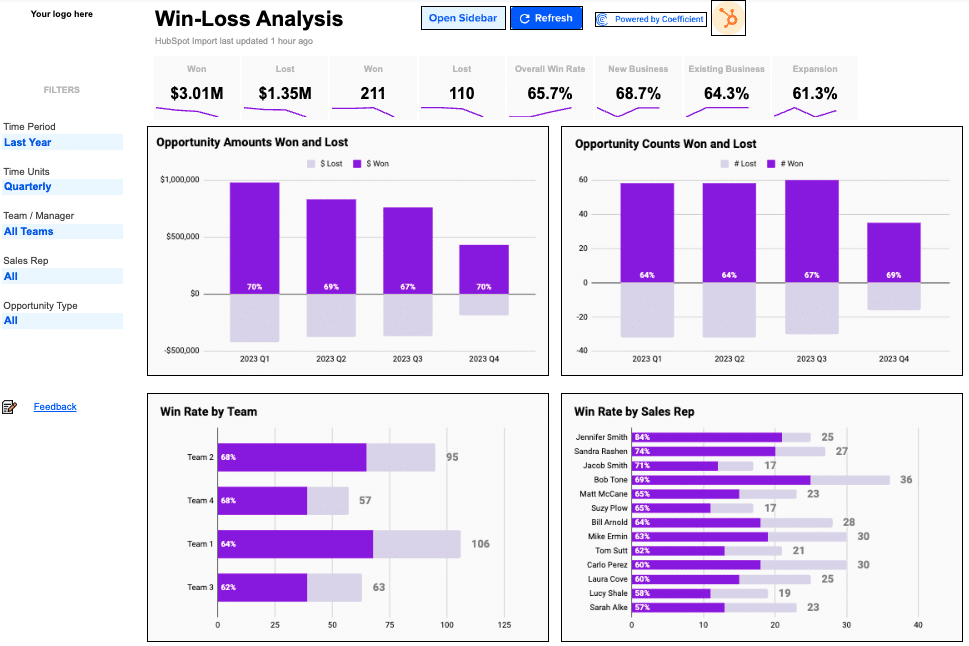
Coefficient’s Win / Loss Analysis template makes it easy to conduct this critical analysis, with live data integration and customizable reports.
- Identify Key Factors: Quickly identify the factors that contribute to won and lost deals.
- Spot Trends: Use historical data to identify patterns and trends in your win/loss outcomes.
- Customize Analysis: Create reports tailored to your specific needs, so you can focus on the most relevant factors.
Gain valuable insights into your sales outcomes with Coefficient’s Win / Loss Analysis template.
#8 Outreach Sequence Performance
Monitoring the performance of your outreach sequences helps you optimize your sales communication and improve response rates. By tracking this metric, you can:
- Identify top-performing sequences: Pinpoint the sequences that generate the highest response rates and revenue.
- Optimize content and timing: Use performance data to refine your messaging and timing for maximum impact.
- Allocate resources: Focus your efforts on the most effective outreach sequences to maximize ROI.
How to Calculate: Measure the response rates, conversion rates, and revenue generated by each outreach sequence.
How Coefficient’s Outreach Sequence Performance Template Can Help
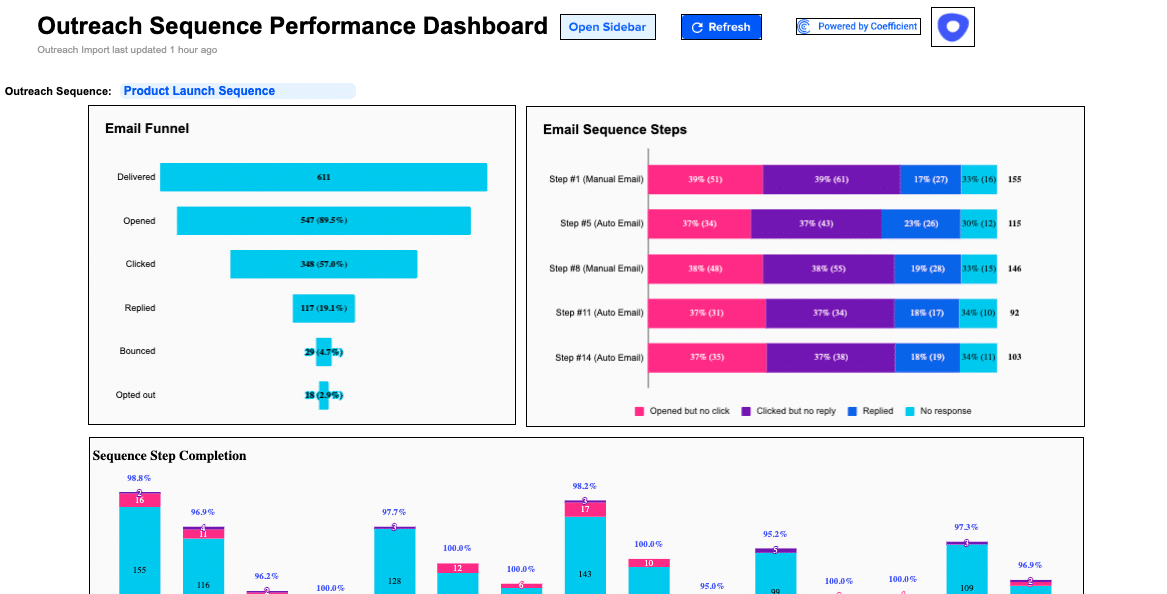
Coefficient’s Outreach Sequence Performance template simplifies the process of tracking and analyzing this metric, with live data integration and customizable dashboards.
- Identify Top Sequences: Quickly identify the outreach sequences driving the best results.
- Optimize Performance: Use real-time data to refine your messaging, timing, and targeting for maximum impact.
- Customize Reports: Create dashboards tailored to your specific needs, so you can focus on the most relevant metrics.
Start optimizing your outreach sequences with Coefficient’s Outreach Sequence Performance template.
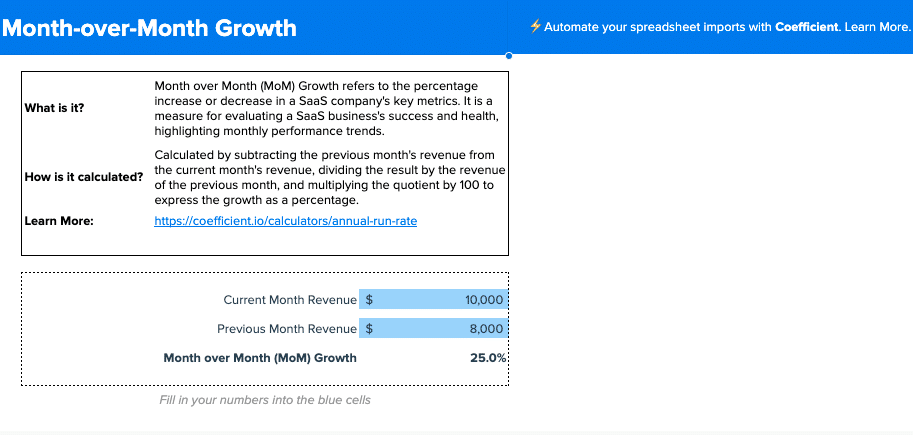
#9 MOM Growth
Month-over-Month (MOM) growth measures the change in your key sales metrics from one month to the next. Tracking this metric helps you:
- Identify trends: Spot positive or negative trends in your sales performance over time.
- Adjust strategies: Make data-driven adjustments to your sales approach based on monthly performance.
- Set realistic goals: Use historical MOM growth data to set achievable targets for future months.
How to Calculate: MOM growth is calculated by comparing the value of a metric in the current month to the value in the previous month.
How Coefficient’s MOM Growth Template Can Help
Coefficient’s MOM Growth template makes it easy to track and analyze this essential metric, with live data integration and customizable reports.
- Monitor Performance: Quickly assess your month-over-month growth across key sales metrics.
- Identify Trends: Use historical data to spot positive or negative trends in your sales performance.
- Set Realistic Goals: Leverage MOM growth data to set achievable targets for future months.
Start tracking your month-over-month growth with Coefficient’s MOM Growth template.
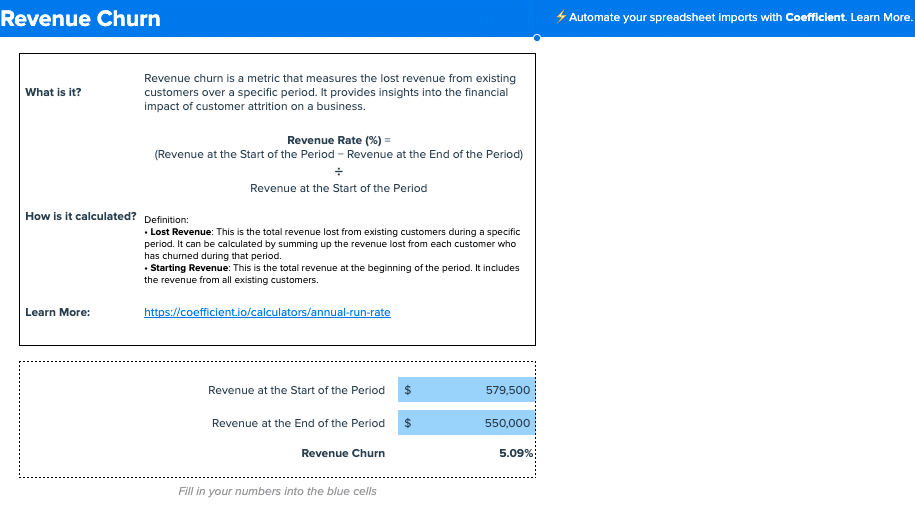
#10 Revenue Churn
Revenue churn measures the percentage of revenue lost due to customer attrition over a given period. Monitoring this metric helps you:
- Assess customer retention: Identify the rate at which customers are leaving and the impact on your revenue.
- Identify risk factors: Pinpoint the factors contributing to customer churn and take corrective action.
- Optimize retention strategies: Use churn data to refine your customer retention approach and minimize revenue loss.
How to Calculate: Revenue churn is calculated by dividing the revenue lost due to customer attrition by the total revenue at the beginning of the period.
How Coefficient’s Revenue Churn Template Can Help
Coefficient’s Revenue Churn template simplifies the process of tracking and analyzing this critical metric, with live data integration and customizable dashboards.
- Monitor Churn Rate: Quickly assess your revenue churn rate and its impact on your business.
- Identify Risk Factors: Use historical data to pinpoint the factors contributing to customer churn.
- Optimize Retention: Leverage churn data to refine your customer retention strategies and minimize revenue loss.
Advantages of Integrating Live Data From Various Systems into a Single Dashboard
Integrating live data from various platforms into a single dashboard offers numerous advantages for sales teams:
- Centralized data: Consolidate data from multiple sources, providing a single source of truth for sales performance.
- Real-time insights: Access up-to-date information, enabling quick decision-making and agile strategizing.
- Time savings: Automate data collection and analysis, freeing up time for more strategic initiatives.
Coefficient’s pre-built dashboard templates make it easy to integrate live data from various systems, with customization options to suit your unique needs.
Success Story: How Jebbit Streamlined Sales and Revenue Operations with Coefficient
Jebbit, a pioneering platform in the zero-party data industry, faced challenges with its CRM software and manual sales commission tracking. They needed an automated solution that could provide real-time data insights.
By adopting Coefficient, Jebbit streamlined their sales commission process, eliminating hours of manual work and providing their sales team with real-time insights and a comprehensive view of their commissions. Coefficient’s support for historical Salesforce data also enabled Jebbit to craft more accurate sales forecasts and respond promptly to leadership requests.
“Coefficient saved us hours upon hours of work,” said Rachel Golden, VP of Finance at Jebbit. “There’s no manual back-and-forth with salespeople about commissions anymore. But we haven’t just saved tons of time. We’ve also been able to offer our team better data and more transparency.”
Conclusion
Tracking the right sales metrics is essential for the success of any company. By focusing on the top 10 metrics outlined in this blog post and leveraging Coefficient’s pre-built templates, you can gain valuable insights into your sales performance, make data-driven decisions, and optimize your strategies for growth.
Coefficient’s customizable templates make it easy to track and analyze critical sales metrics, from opportunity history and win rates to open pipe and total contract value. With real-time data integration and collaborative features, Coefficient empowers sales teams to work more efficiently and effectively.
Transform your sales performance tracking with Coefficient. Get started today for free!
