
Measuring the right SaaS metrics is essential for making data-driven decisions and ensuring the success of your SaaS business. These metrics are your roadmap to success, highlighting what works and guiding your strategy towards better results.
Coefficient’s dashboard templates simplify tracking these pivotal metrics, ensuring you’re equipped with the insights to navigate the SaaS landscape confidently. Let’s dive into the top 10 SaaS metrics every company should measure in 2024.
#1 Top 10 SaaS Metrics for 2024
Customer Lifetime Value (CLV)
Customer Lifetime Value (CLV) represents the total amount of revenue a customer is expected to generate throughout their relationship with your company.
Tracking CLV helps you:
- Identify high-value customer segments: Focus on acquiring and retaining customers with the highest lifetime value.
- Optimize customer acquisition costs: Ensure that your customer acquisition costs are in line with the expected lifetime value of your customers.
- Make data-driven decisions: Use CLV data to inform product development, pricing strategies, and marketing initiatives.
How to Calculate: CLV = Average Revenue per Customer × Average Customer Lifespan
How Coefficient’s Customer Lifetime Value Template Can Help
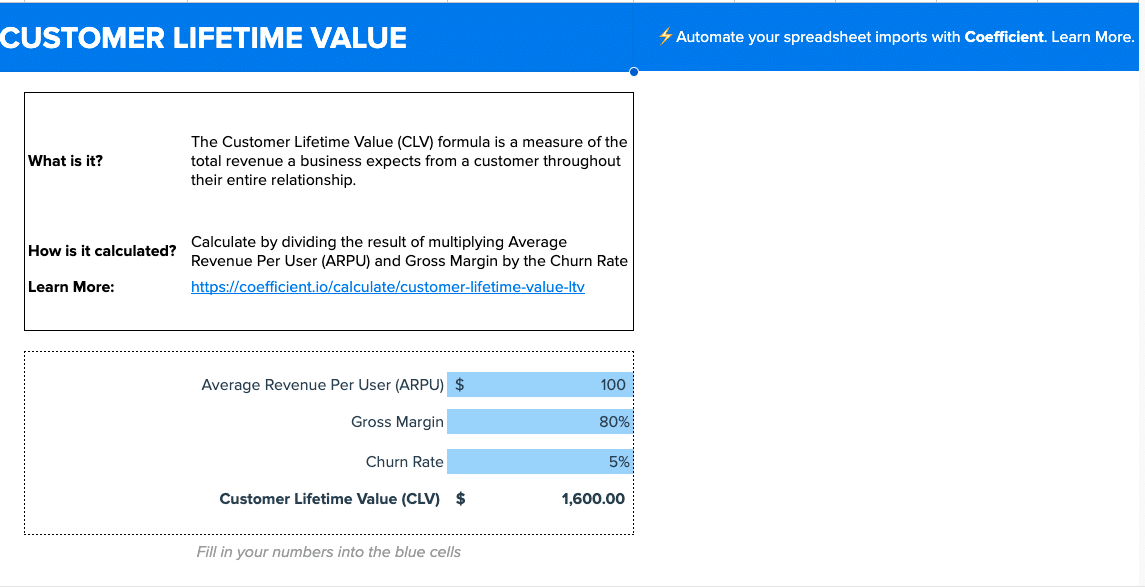
Coefficient templates offer a streamlined approach to monitoring CLV by integrating real-time data, enabling you to make informed adjustments promptly.
- See What Works: Quickly identify high-value customer segments and focus your efforts on them.
- Make Better Decisions: Use CLV data to guide product development, pricing, and marketing strategies.
- Customize Your Views: Create reports that make sense to you, so you can make smart decisions about your customers.
Download the Customer Lifetime Value template and start optimizing your customer acquisition.
#2 Lead Conversion Rate
Lead Conversion Rate measures the percentage of leads that convert into paying customers.
Monitoring lead conversion rate helps you:
- Assess the effectiveness of your lead generation efforts: Identify which channels and tactics are driving the most qualified leads.
- Optimize your sales funnel: Pinpoint areas where leads are dropping off and take corrective action.
- Forecast revenue: Use lead conversion data to predict future revenue and make informed business decisions.
How to Calculate: Lead Conversion Rate = (Number of Converted Customers / Total Number of Leads) × 100
How Coefficient’s Lead Conversion Rate Template Can Help
Coefficient facilitates easy analysis of lead conversion data, allowing for swift comparison and strategic enhancements based on live performance insights.
- Know What Converts: See clearly which lead generation efforts result in the most paying customers.
- Keep Getting Better: Use real data to optimize your sales funnel and improve lead conversion over time.
- See What’s Working: Identify the top-performing lead generation channels and tactics to focus your efforts.
Gain insights into your lead conversion performance with Coefficient’s Lead Conversion Rate template.
#3 CAC:LTV Ratio
The CAC:LTV Ratio compares the cost of acquiring a customer (CAC) to their lifetime value (LTV).
CAC:LTV Ratio helps you:
- Assess the sustainability of your business model: Ensure that the cost of acquiring customers is justified by their lifetime value.
- Optimize customer acquisition strategies: Identify and focus on the most cost-effective channels and tactics.
- Make informed investment decisions: Use CAC:LTV data to guide decisions on scaling your business and attracting investors.
How to Calculate: CAC:LTV Ratio = Customer Acquisition Cost / Customer Lifetime Value
How Coefficient’s CAC:LTV Ratio Template Can Help
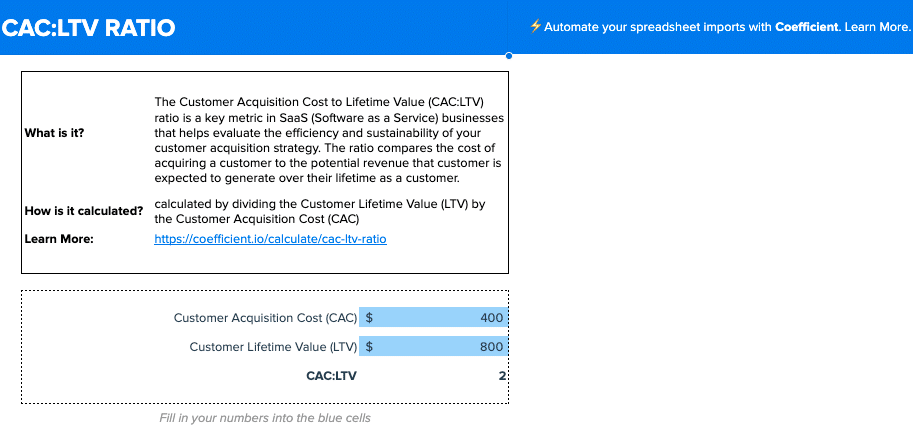
Using Coefficient, you can seamlessly bring CAC:LTV data into focus, offering actionable insights to refine your strategies in real time.
- Boost Profitability: Identify the most cost-effective customer acquisition channels and tactics.
- Smart Comparisons: See how different acquisition strategies stack up against each other in terms of CAC:LTV.
- Zoom In On What Works: Focus on making data-driven decisions that improve your CAC:LTV ratio over time.
Optimize your customer acquisition strategies with Coefficient’s CAC:LTV Ratio template.
#4 Net Promoter Score (NPS)
Net Promoter Score (NPS) measures customer loyalty and the likelihood of them recommending your product or service to others.
Tracking NPS helps you:
- Gauge customer satisfaction: Understand how satisfied your customers are with your product or service.
- Identify promoters and detractors: Pinpoint customers who are likely to recommend your business and those who may churn.
- Improve customer experience: Use NPS feedback to address customer concerns and enhance your product or service.
How to Calculate: NPS = % of Promoters – % of Detractors
How Coefficient’s Net Promoter Score Template Can Help
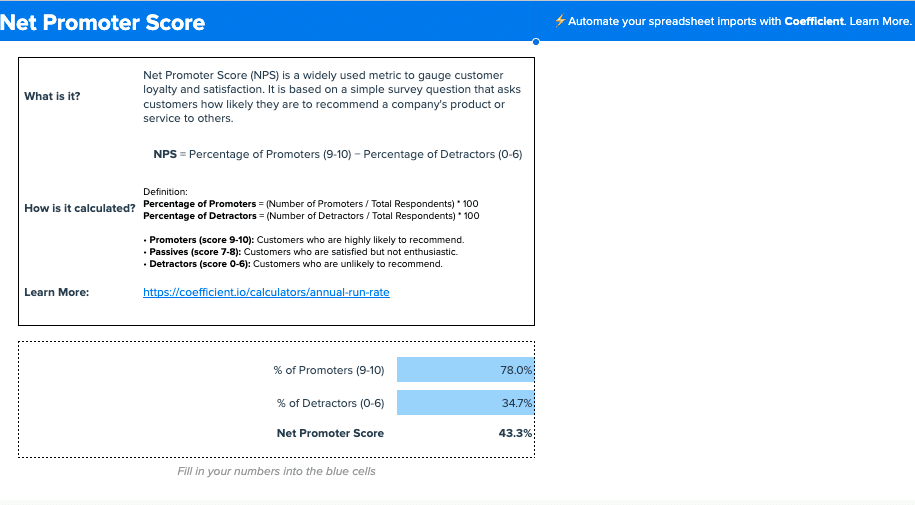
Coefficient simplifies the tracking and analysis of NPS data, empowering your team with the necessary insights to refine and elevate customer experience strategies dynamically.
- Understand Customer Loyalty: Get a clear picture of how likely your customers are to recommend your product or service.
- Identify Areas for Improvement: Use NPS feedback to pinpoint customer concerns and take action to address them.
- Track Progress Over Time: Monitor how your NPS changes over time and measure the impact of your customer experience improvements.
Start measuring customer loyalty with Coefficient’s Net Promoter Score template.
#5 MRR
Monthly Recurring Revenue (MRR) represents the predictable and recurring revenue your SaaS business generates each month.
Monitoring MRR helps you:
- Assess the health of your business: Track the growth and stability of your revenue streams.
- Forecast future revenue: Use MRR data to predict future revenue and plan for growth.
- Identify trends and patterns: Analyze MRR data to spot trends and make data-driven decisions.
How to Calculate: MRR = Sum of All Recurring Revenue for the Month
How Coefficient’s MRR Template Can Help
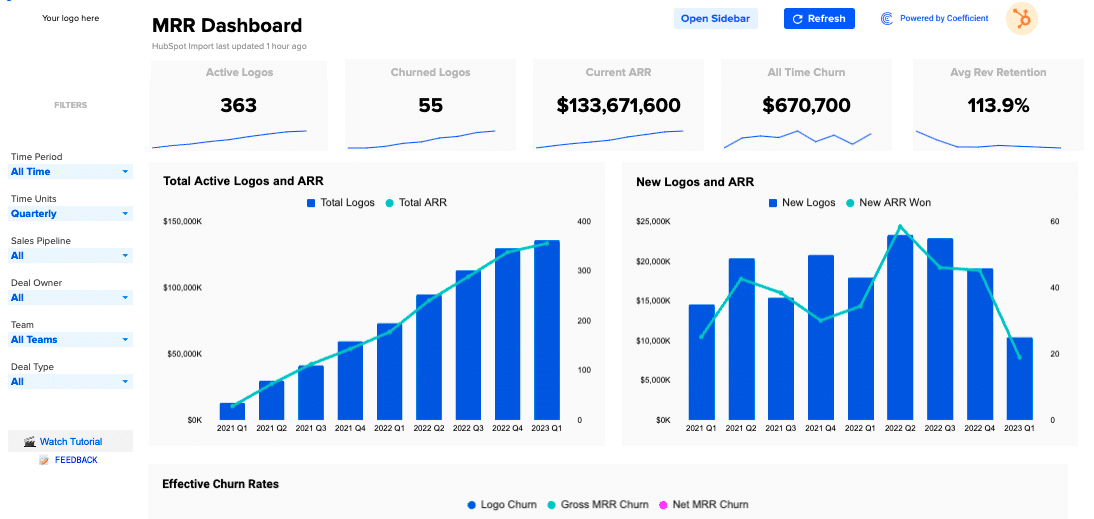
Coefficient’s MRR template makes it easy to track and analyze this essential metric, providing a clear view of your recurring revenue.
- Monitor Revenue Health: Quickly assess the growth and stability of your monthly recurring revenue.
- Forecast with Confidence: Use historical MRR data to predict future revenue and plan for growth.
- Spot Trends and Patterns: Analyze MRR data to identify trends and make informed decisions about your business.
Gain a clear view of your recurring revenue with Coefficient’s MRR template.
#6 Activation Rate
Activation Rate measures the percentage of users who perform a key action within your product, indicating that they have realized its value.
Tracking Activation Rate helps you:
- Assess product-market fit: Understand how well your product meets the needs of your target audience.
- Identify onboarding improvements: Pinpoint areas where users are struggling and optimize your onboarding process.
- Increase user engagement: Use activation data to guide product development and improve user engagement.
How to Calculate: Activation Rate = (Number of Users Who Perform Key Action / Total Number of Users) × 100
How Coefficient’s Activation Rate Template Can Help
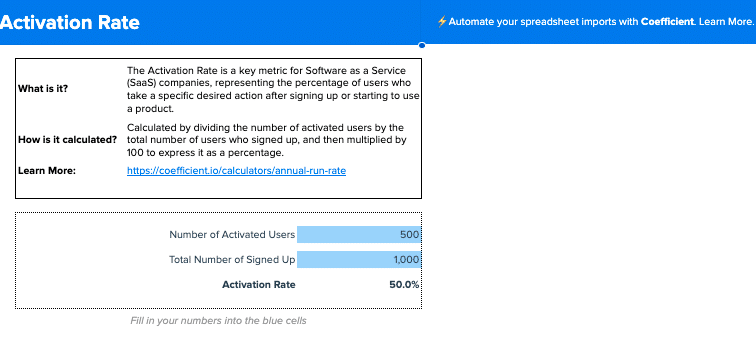
Coefficient’s Activation Rate template simplifies the process of tracking and analyzing this crucial metric, providing real-time insights into user engagement.
- Monitor User Activation: Quickly assess the percentage of users who are realizing the value of your product.
- Identify Onboarding Bottlenecks: Use activation data to pinpoint areas where users are struggling and optimize your onboarding process.
- Guide Product Development: Leverage activation insights to inform product development decisions and improve user engagement.
Start optimizing user activation with Coefficient’s Activation Rate template.
#7 Monthly Active Users (MAU)
Monthly Active Users (MAU) represents the number of unique users who engage with your product or service within a given month. Monitoring MAU helps you:
- Assess user engagement: Understand how many users are actively using your product or service.
- Identify growth opportunities: Analyze MAU trends to identify opportunities for user acquisition and retention.
- Inform resource allocation: Use MAU data to guide decisions on product development, marketing, and customer support.
How to Calculate: MAU = Number of Unique Users Who Engage with Your Product or Service in a Given Month
How Coefficient’s Monthly Active Users Template Can Help

Stop exporting data manually. Sync data from your business systems into Google Sheets or Excel with Coefficient and set it on a refresh schedule.
Get Started
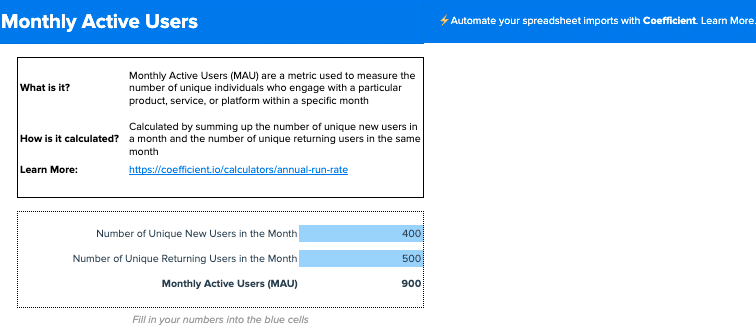
Coefficient’s Monthly Active Users template makes it easy to track and analyze this essential metric, providing a clear view of user engagement.
- Monitor User Engagement: Quickly assess the number of users actively engaging with your product or service each month.
- Identify Growth Opportunities: Analyze MAU trends to spot opportunities for user acquisition and retention.
- Inform Resource Allocation: Use MAU data to guide decisions on product development, marketing, and customer support.
Gain insights into user engagement with Coefficient’s Monthly Active Users template.
#8 Quick Ratio
The Quick Ratio, also known as the Acid Test Ratio, measures a SaaS company’s ability to cover its short-term obligations using its liquid assets.
Tracking Quick Ratio helps you:
- Assess financial health: Understand your company’s ability to meet its short-term financial obligations.
- Identify liquidity risks: Pinpoint potential cash flow issues and take corrective action.
- Inform financial planning: Use Quick Ratio data to guide decisions on expense management and revenue growth.
How to Calculate: Quick Ratio = (Cash + Accounts Receivable + Short-Term Investments) / Current Liabilities
How Coefficient’s Quick Ratio Template Can Help
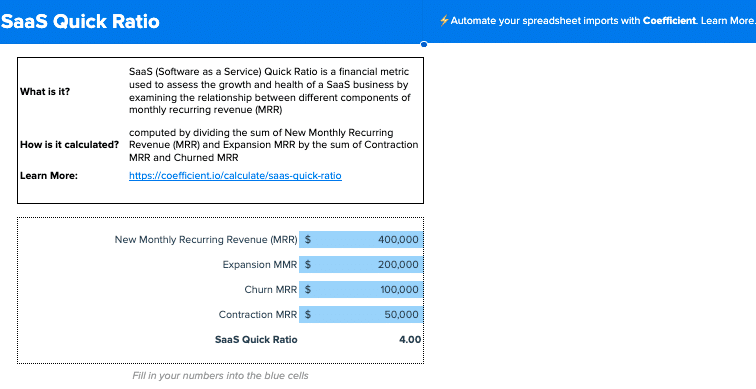
Coefficient’s Quick Ratio template simplifies the process of tracking and analyzing this critical financial metric, providing real-time insights into your company’s liquidity.
- Monitor Financial Health: Quickly assess your company’s ability to cover its short-term obligations.
- Identify Liquidity Risks: Use Quick Ratio data to pinpoint potential cash flow issues and take corrective action.
- Inform Financial Planning: Leverage Quick Ratio insights to guide decisions on expense management and revenue growth.
Start monitoring your financial health with Coefficient’s Quick Ratio template.
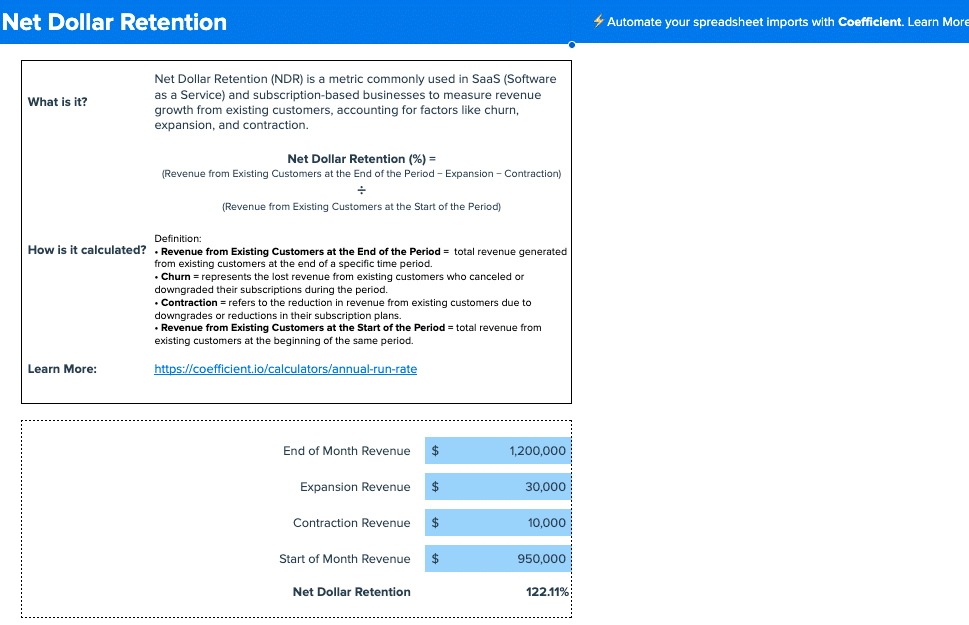
#9 Net Dollar Retention
Net Dollar Retention measures the percentage of revenue retained from existing customers over a given period, taking into account upgrades, downgrades, and churn.
Tracking Net Dollar Retention helps you:
- Assess customer loyalty: Understand how well you are retaining and expanding revenue from existing customers.
- Identify churn risks: Pinpoint customer segments or product areas that are at risk of churn.
- Inform growth strategies: Use Net Dollar Retention data to guide decisions on customer success, upselling, and cross-selling.
How to Calculate: Net Dollar Retention = (Monthly Recurring Revenue + Upgrades – Downgrades – Churn) / Monthly Recurring Revenue at the Beginning of the Period
How Coefficient’s Net Dollar Retention Template Can Help
Coefficient’s Net Dollar Retention template makes it easy to track and analyze this essential metric, providing a clear view of customer loyalty and revenue retention.
- Monitor Customer Loyalty: Quickly assess how well you are retaining and expanding revenue from existing customers.
- Identify Churn Risks: Use Net Dollar Retention data to pinpoint customer segments or product areas at risk of churn.
- Inform Growth Strategies: Leverage Net Dollar Retention insights to guide decisions on customer success, upselling, and cross-selling.
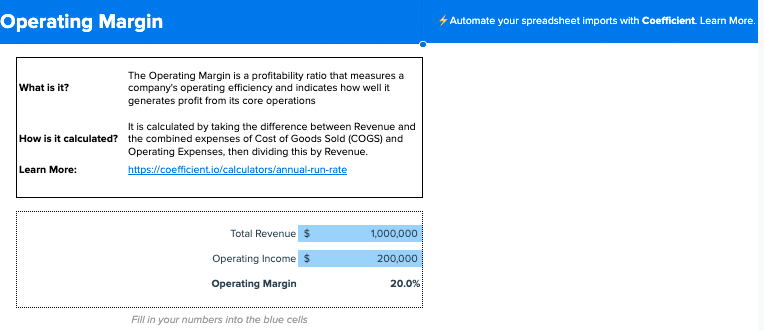
#10 Operating Margin
Operating Margin measures the percentage of revenue that remains after deducting operating expenses, indicating a company’s operational efficiency and profitability.
Tracking Operating Margin helps you:
- Assess profitability: Understand how much of your revenue is being converted into profits.
- Identify cost reduction opportunities: Pinpoint areas where you can reduce operating expenses and improve profitability.
- Inform pricing and budgeting: Use Operating Margin data to guide decisions on pricing strategies and resource allocation.
How to Calculate: Operating Margin = (Operating Income / Revenue) × 100
How Coefficient’s Operating Margin Template Can Help
Coefficient’s Operating Margin template simplifies the process of tracking and analyzing this critical financial metric, providing real-time insights into your company’s profitability.
- Monitor Profitability: Quickly assess how much of your revenue is being converted into profits.
- Identify Cost Reduction Opportunities: Use Operating Margin data to pinpoint areas where you can reduce operating expenses and improve profitability.
- Inform Pricing and Budgeting: Leverage Operating Margin insights to guide decisions on pricing strategies and resource allocation.
Start monitoring your profitability with Coefficient’s Operating Margin template.
Advantages of Integrating Live Data into a Unified Dashboard
Integrating live data into a unified dashboard transforms SaaS analytics with solid, tangible benefits:
- Real-Time Data for Swift Adjustments: Enables immediate access to the freshest data, critical for swiftly tweaking strategies in response to the latest trends and customer behaviors.
- Centralized Insights & Time Savings: Consolidates data from various sources for a holistic view, significantly reducing time spent on analysis and strategy adjustments, and thereby increasing overall productivity.
- Enhanced Collaboration with Custom Reporting: Improves team collaboration through shared, live data access and allows for the creation of detailed, custom reports tailored to specific strategy needs and stakeholder communication.
How Klaviyo’s Data Team Used Coefficient to Scale Rapidly.
Klaviyo, a SaaS company, faced challenges with increasing data demands and continuous ad hoc requests as they scaled. Their data team sought a way for stakeholders to independently access and interpret data using spreadsheets.
By adopting Coefficient, Klaviyo’s data team was able to enable true self-serve analytics, reclaiming nearly two months previously lost to manual data processes. Coefficient’s impact led to its swift and widespread adoption throughout Klaviyo, with use cases ranging from auditing to product analytics, operations, and FP&A.
Conclusion
Measuring the right SaaS metrics is crucial for the success of any SaaS company. By focusing on the top 10 metrics outlined in this blog post and leveraging Coefficient’s pre-built templates, you can gain valuable insights into your business’s performance, make data-driven decisions, and optimize your strategies for growth.
Coefficient’s customizable templates make it easy to track and analyze critical SaaS metrics, from Customer Lifetime Value and Lead Conversion Rate to Net Promoter Score and Monthly Recurring Revenue. With real-time data integration and collaborative features, Coefficient empowers SaaS companies to work more efficiently and effectively.
Streamline your SaaS metric tracking with Coefficient. Get started today for free!


