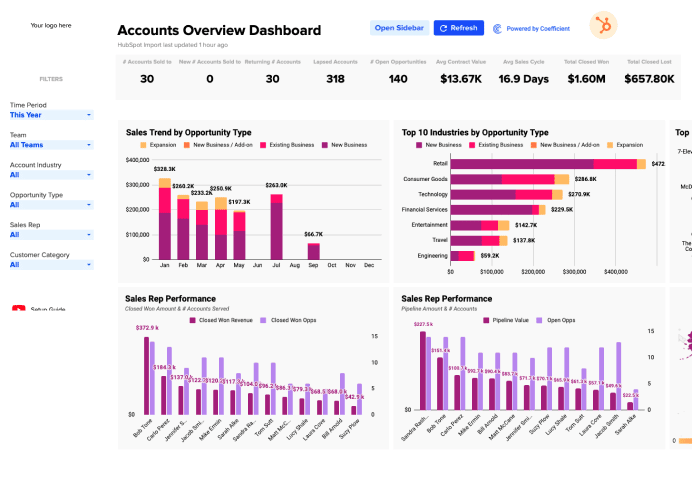
A 360° view of MRR. Supercharge SaaS and PLG Growth.
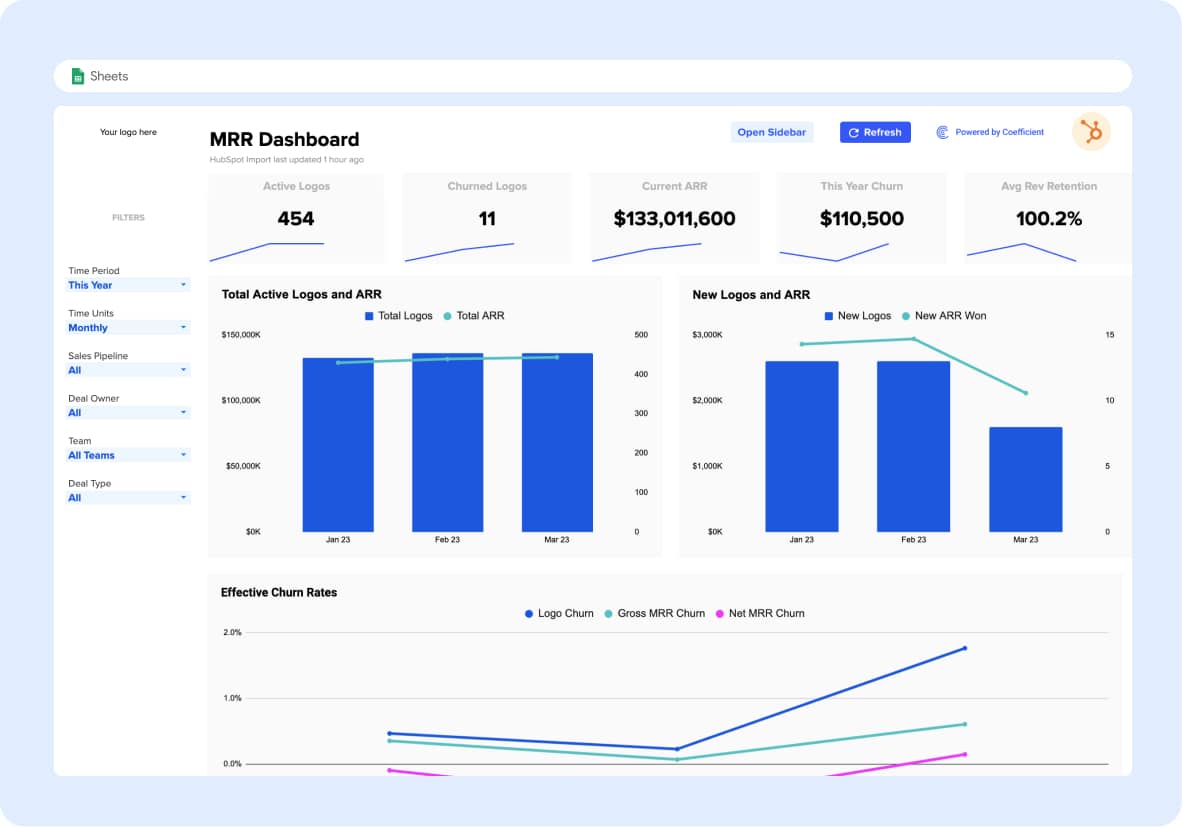
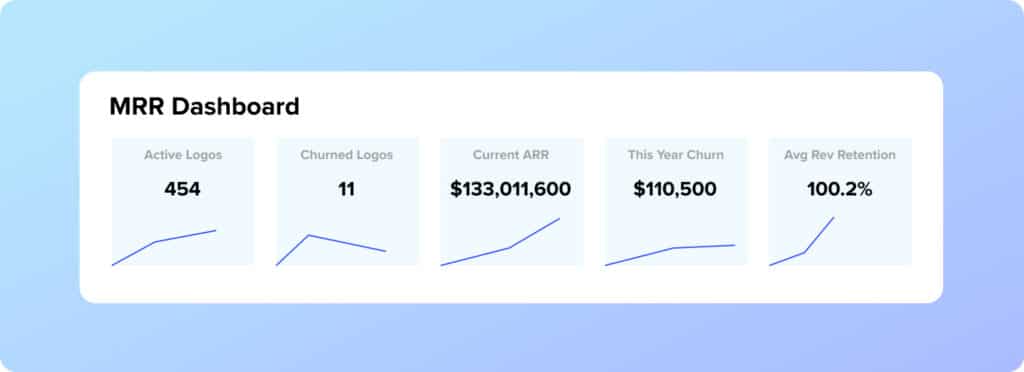
This HubSpot MRR Dashboard was built specifically with SaaS and PLG companies in mind. Use it to keep track of your current MRR or ARR, total logo count, key churn rates, and more.
With this SaaS dashboard, you can:
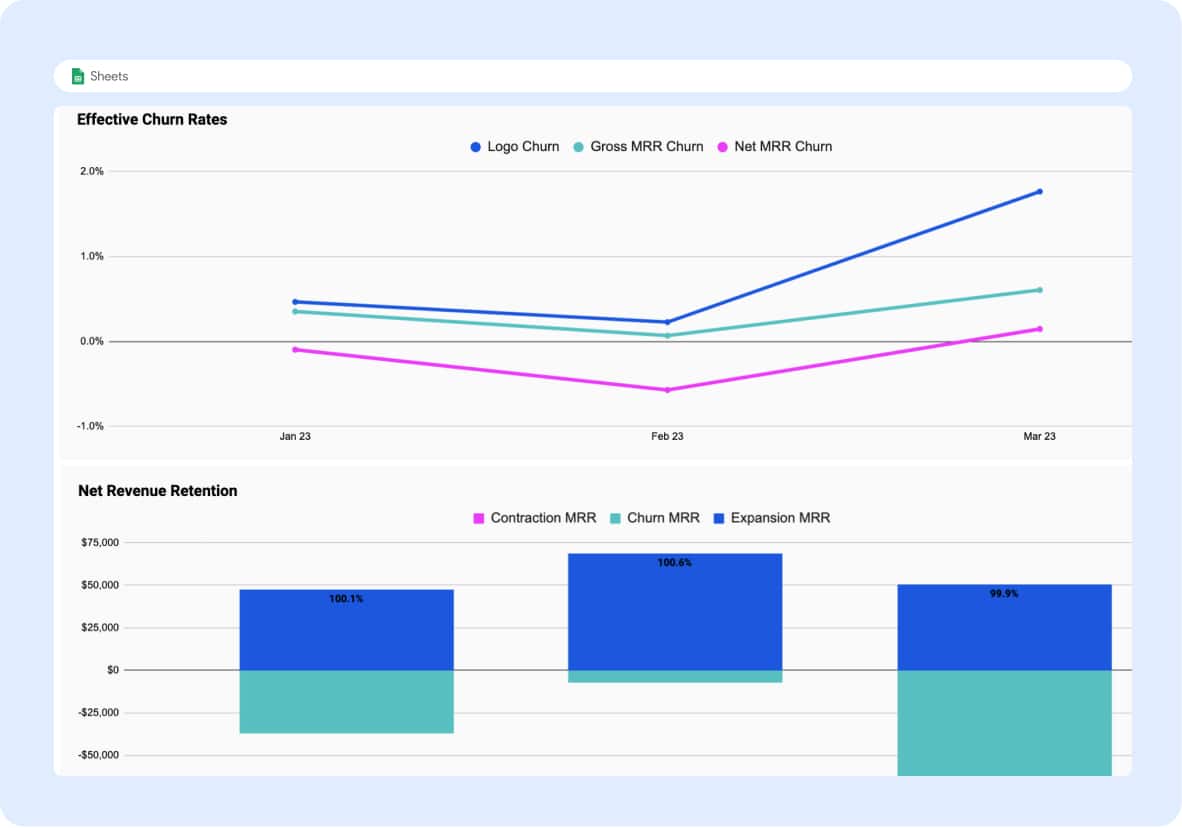
- Visualize essential metrics like Churn Rate, Net Churn Rate, and Net Revenue Retention to keep track of the health of your business.
- Automatically import live HubSpot data to populate this template, including churn dates and churn reasons, so you can identify trends and problems quickly
- Leverage the dynamic date range filter to view churn by day, week, month, quarter or year; depending on the nature and sales volume of your SaaS business
- Monitor the “Deal Downgrades” tab to keep track of when a customer reduces number of paid licenses, receives a discount, or downgrades to a lower-priced tier
What Should be Included in a SaaS MRR Dashboard?
A Monthly Recurring Revenue (MRR) dashboard is a vital tool for any business. It provides a snapshot of your company’s financial health, allowing you to monitor key customer retention metrics to inform your marketing or sales strategies.
Here are some essential components that should be included in a comprehensive SaaS MRR dashboard:
- Net New MRR or ARR: This is the heart of your dashboard. It shows your current Monthly Recurring Revenue (MRR) or Annual Recurring Revenue (ARR), providing a clear picture of your company’s revenue status.
- Total Logo Count: This metric represents the total number of logos, or customers, that your company has acquired. It’s a straightforward way to track customer growth over time.
- Churn Rates: Churn Rate and Net Churn Rate are critical metrics for any SaaS business that measure the rate at which customers stop subscribing to your service. Churn Rate measures the rate at which customers stop subscribing to your service, while Net Churn Rate takes into account new revenue from existing customers. Keeping an eye on these metrics can help you identify trends and address issues promptly.
- Net Revenue Retention (NRR): This metric shows how much revenue you retain from existing customers after accounting for upgrades, downgrades, and churn. It’s a key indicator of customer satisfaction and product value.
- Dynamic Date Range Filter: This feature allows you to view your churn data by day, week, month, quarter, or year. It provides flexibility in how you analyze your data, making it easier to spot trends and patterns.
- Deal Downgrades: If available, tracking when a customer reduces the number of paid licenses, receives a discount, or downgrades to a lower-priced tier can provide valuable insights into customer behavior and satisfaction.
With Coefficient’s MRR Dashboard, you can automatically import live HubSpot data to populate these metrics. This includes churn dates and reasons, enabling you to identify trends and improve your retention rate.
How to Calculate MRR?
Monthly Recurring Revenue (MRR) is a critical metric for any SaaS business. It provides a snapshot of your company’s financial health, allowing you to monitor revenue trends and make informed decisions.
Here’s a step-by-step guide on how to calculate MRR:
- Identify Recurring Revenue: Start by identifying all sources of recurring revenue. This includes subscriptions, monthly fees, and any other regular payments that customers make.
- Exclude One-Time and Non-Recurring Fees: Exclude any one-time payments or non-recurring fees from your calculation. This includes setup fees, special services, and any other charges that are not part of the regular subscription.
- Account for Upgrades, Downgrades, and Churn: It’s important to adjust your MRR calculation to account for upgrades, downgrades, and churn. For example, if a customer upgrades or downgrades their plan, this will affect your MRR. Similarly, if a customer cancels their subscription (churns), this will also affect your total MRR.
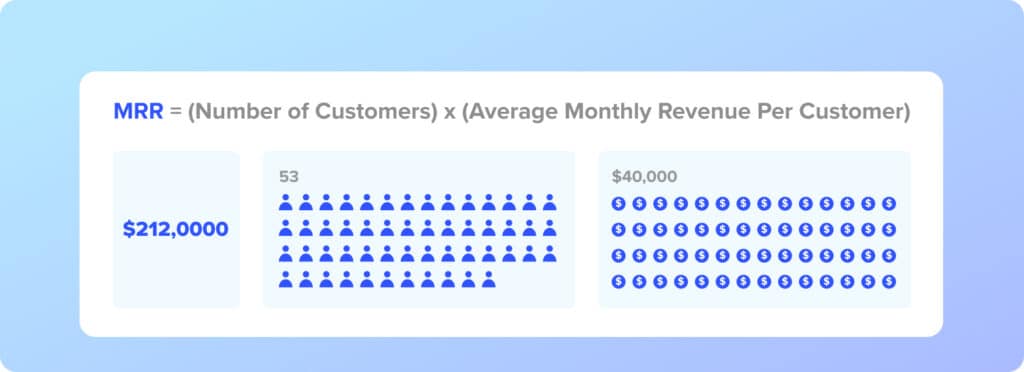
- Calculate MRR: To calculate MRR, multiply the total number of paying customers by the average revenue per user (ARPU). For example, if you have 100 customers paying an average of $100 per month, your MRR would be $10,000.
Note: MRR is a snapshot of your revenue at a particular point in time. It can fluctuate as customers upgrade, downgrade, or churn. Therefore, it’s important to calculate MRR on a monthly basis.
Fortunately, our dashboard allows you to refresh your data with just a click of a button for a real-time view of your total MRR.
Tips to Increase MRR
Remember, what works for one business may not work for another. It’s important to test different strategies and find what works best for your specific business and industry.
- Raise Your Price: Consider a strategic price increase, ensuring it aligns with the value provided. A slight increase in churn can be offset by a significant increase in MRR.
- Unbundle Features: Splitting features into separate add-on services can increase your Average Revenue Per Account (ARPA).
- Limit Unlimited Features: Consider setting limits on unlimited features like storage or users. The price should increase with the value generated.
- Move Upmarket: Add an enterprise-style package for serving larger businesses. They will pay more due to the higher value and larger budgets.
- Upsell and Cross-sell: Encourage customers to purchase more expensive items or upgrades at the right time, such as when they’ve just hit a success milestone.
- Increase Lead Generation and Conversion: More leads and better conversion rates can significantly boost MRR. Optimize lead nurturing and sales copy for better conversions.
- Offer Yearly Pre-payment: Offering yearly pre-payment plans can increase customer retention and boost MRR, even if a discount is offered.
- Customer Retention: Implement strategies like CRM, loyalty programs, and customer success strategies to keep current customers and reduce churn.
- Acquire New Customers and Provide Value: Invest in marketing strategies to attract new customers and ensure your product or service provides the best value for the price point. Use customer feedback to understand and implement improvements.
How Do You Calculate Churn Rate in HubSpot?
HubSpot doesn’t calculate churn rate automatically for you, but you can calculate it manually using the data that is available on the platform.
Here is a simple way you can calculate churn rate using HubSpot data:
- Determine the Time Period: Choose the period of time you want to measure: month, quarter, or year.
- Calculate Customers at the Start of the Period: Find the total number of customers you had at the beginning of the period. This can be found in your contacts database.
- Calculate Number of Customers Lost: Find out how many customers you’ve lost during that period. You can do this by using HubSpot’s contact filters to identify which customers have been marked as ‘closed lost’, or by tracking a specific property change.
- Calculate Churn Rate: Use the following formula to calculate churn rate:
Churn Rate = (Number of Customers Lost / Number of Customers at Start of Period) x 100%
Alternatively, you can import this data into Google Sheets with Coefficient to streamline your analysis with the convenience and familiarity of your spreadsheet.

