Table of Contents
![]()
Scenario analysis helps you answer “what if” questions about your business. What if revenue drops 20%? What if you hire three new employees? What if your biggest customer leaves?
The problem: QuickBooks doesn’t have built-in scenario analysis tools. You can run reports, but you can’t model different outcomes inside QBO.
This guide walks through how to build scenario analysis from your QuickBooks data—first the manual way, then a faster method using live data connections.
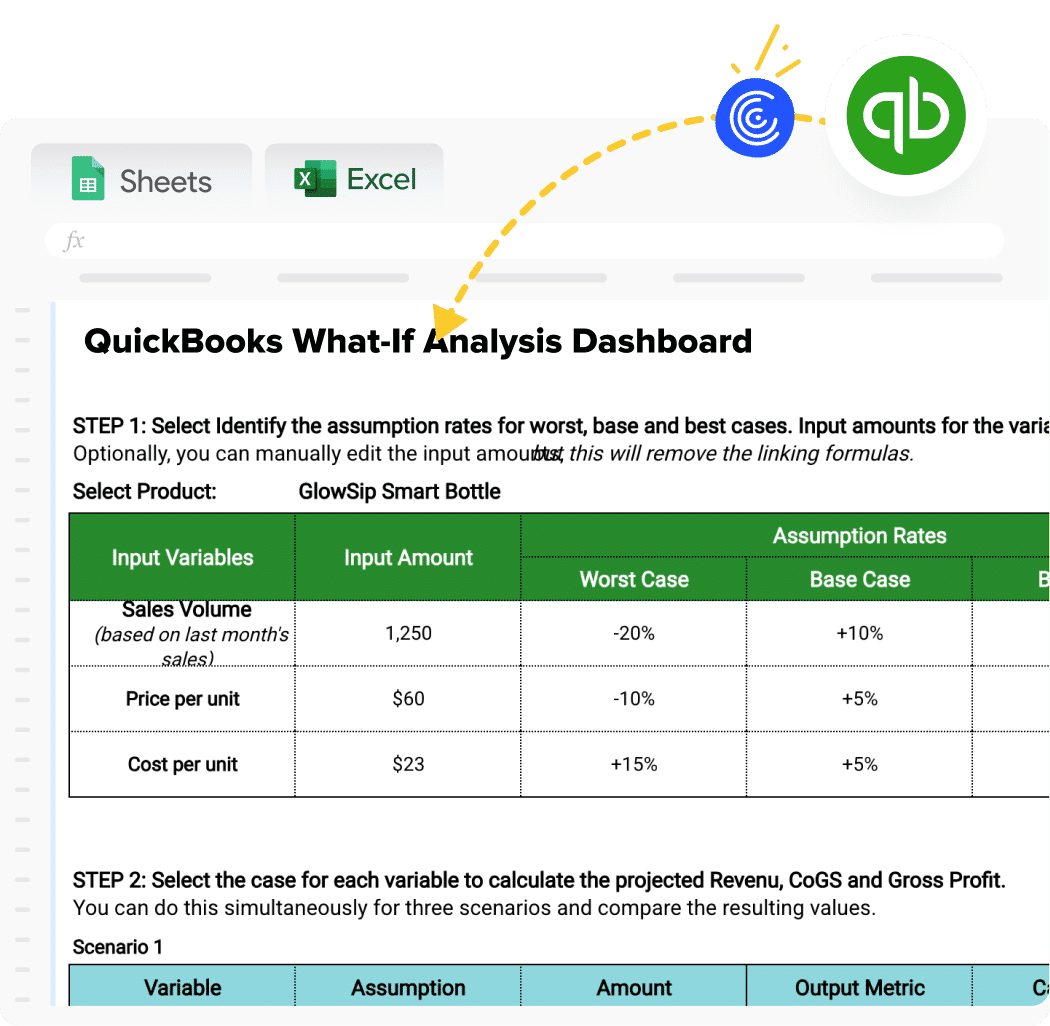
Download the What-If Analysis Dashboard and follow along!
The challenge with scenario analysis in QuickBooks
QuickBooks tracks what happened. It shows your actual revenue, expenses, and profit. But it can’t show you what might happen under different conditions.
Most finance teams work around this by exporting data to Excel or Google Sheets. They build models with different assumptions and manually update the numbers each month.
This works until it doesn’t. The problems show up fast:
- Stale data. Your model shows last month’s numbers while decisions need current figures.
- Broken links. One wrong paste and your formulas stop working.
- Version chaos. Three people have three different spreadsheets with three different answers.
Let’s start with the manual approach, then cover how to fix these issues.
Step-by-step guide: Manual scenario analysis from QuickBooks
Before you build scenarios, make sure your QuickBooks data is accurate. Reconcile your accounts and close out the period you want to analyze.
Step 1: Export your P&L report from QuickBooks
Navigate to Reports in the left menu. Find the Profit and Loss report and select your date range. Click Export in the top right and choose Excel or CSV.
Step 2: Set up your scenario framework in Excel or Google Sheets
Create a new spreadsheet with four columns: your line items, Base Case, Best Case, and Worst Case. Paste your P&L data into the Base Case column.
Step 3: Create variable inputs for key assumptions
Add an assumptions section at the top of your sheet. Include the variables that drive your scenarios:
- Revenue growth rate
- COGS percentage
- Payroll increase
- Operating expense change
Step 4: Build formulas to calculate each scenario
Link your scenario columns to the assumption inputs. For example, Best Case revenue might be =Base Case Revenue * (1 + Best Case Growth Rate).
Do this for each line item that changes across scenarios. Keep static costs the same unless you expect them to change.
Step 5: Update data manually each period
Here’s where the manual method breaks down. Every month, you need to:
- Export fresh data from QuickBooks
- Paste it into your spreadsheet (without breaking formulas)
- Check that all calculations still work
- Save a new version
This takes time. And every manual step is a chance for errors.
A faster way: Scenario analysis with live QuickBooks data
Coefficient connects your spreadsheet directly to QuickBooks. Your data stays current without manual exports. Build your scenario model once, and it updates automatically.
Here’s how to set it up.
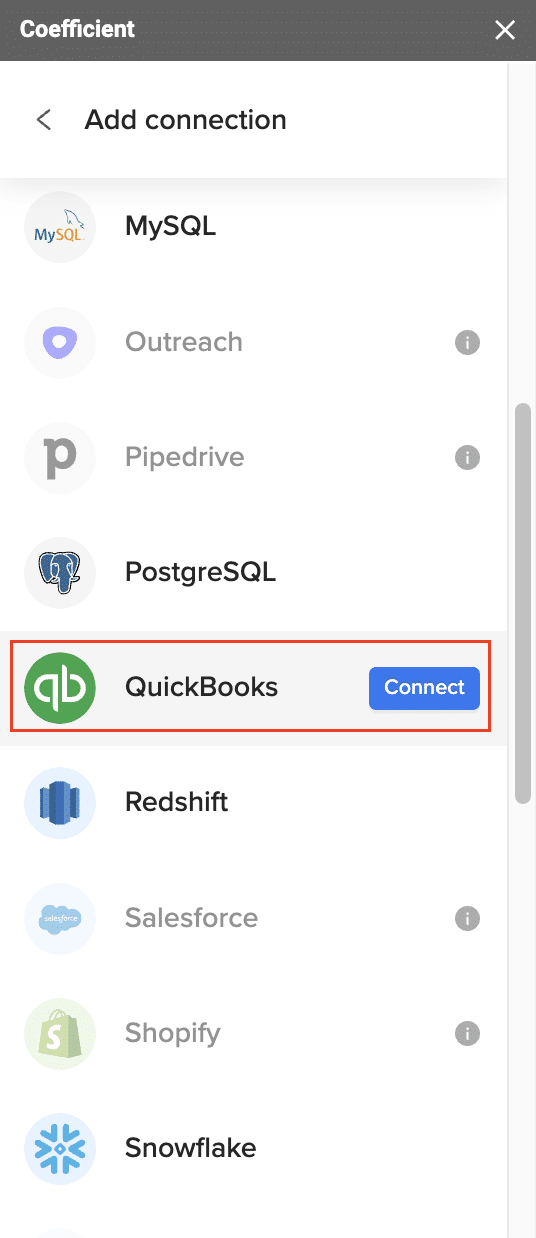
Step 1: Install Coefficient and connect QuickBooks
Get the Coefficient add-on for Google Sheets or Excel. Open Coefficient from the menu and select QuickBooks from the connector list.
Sign in with your QuickBooks credentials. Coefficient uses read-only access by default, so your QBO data stays safe.
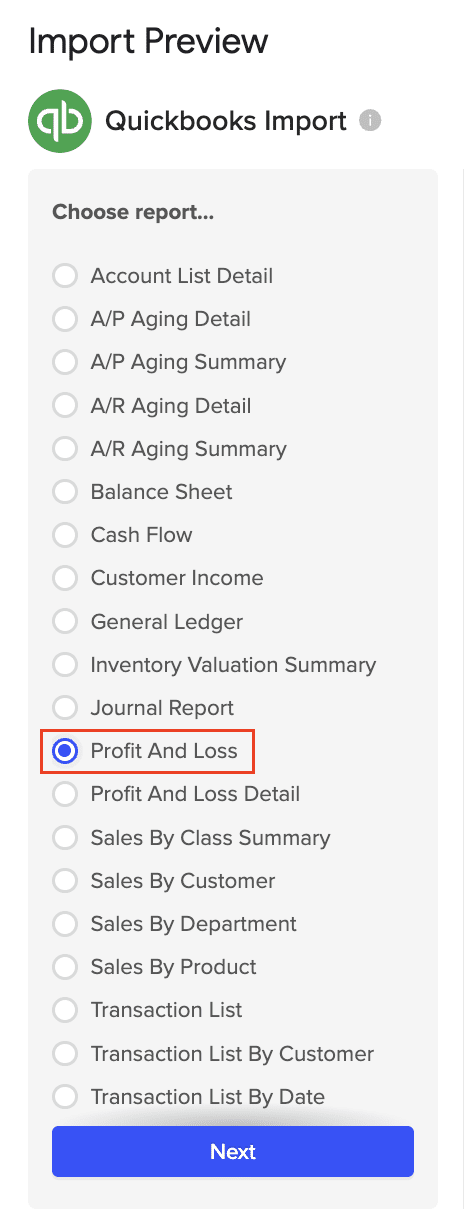
Step 2: Import your P&L or financial data
Click Import from QuickBooks and select QuickBooks Report. Choose Profit and Loss and set your date range.
Your P&L data appears in the spreadsheet. Unlike a manual export, this data can refresh on a schedule—hourly, daily, or weekly.
Step 3: Use the What-If Scenario Analysis template
Coefficient offers a pre-built template for scenario analysis. It connects to your QuickBooks data and includes:
- Base, Best, and Worst case scenarios
- Adjustable assumption inputs
- Automatic calculations across all scenarios
Get the free QuickBooks What-If Scenario Analysis template →
Step 4: Adjust variables and see scenarios update in real-time
Change your assumptions and watch the scenarios recalculate. Increase revenue growth by 10%. Cut operating expenses by 5%. Add a new hire to payroll.
The model updates instantly. And because your base data refreshes from QuickBooks automatically, your scenarios always use current numbers.
Use cases for QuickBooks scenario analysis
Scenario analysis applies to most financial decisions. Common uses include:
- Revenue forecasting. Model different growth rates to set realistic targets.
- Expense planning. See how hiring, rent increases, or vendor changes affect profit.
- Cash flow stress tests. Check if you can cover expenses if revenue drops 30%.
- Investor presentations. Show best and worst case outcomes with supporting data.
- Budget vs. actual. Compare planned scenarios against real results as the year progresses.
Build better financial models from QuickBooks
Scenario analysis turns your QuickBooks data into a planning tool. Instead of just tracking what happened, you can model what might happen next.
The manual export method works for simple, one-time analysis. But if you need ongoing scenario planning, the manual approach creates more work and more risk of errors.
Coefficient keeps your scenario models connected to live QuickBooks data. Build your assumptions once. Let the data refresh itself. Spend your time on analysis instead of data entry.
Get started with Coefficient to build scenario models with real-time QuickBooks data.