Blank cells appear when authentication fails, API connections error out, or data mapping breaks while the integration appears to connect successfully. This often happens when OAuth tokens expire or source systems change field formats without updating the integration.
Here’s how to eliminate blank cell issues and ensure your data displays properly with clear error visibility and automatic data formatting.
Eliminate blank cells using Coefficient
CoefficientHubSpotprevents blank cell issues through robust data mapping and error handling systems. The platform provides automatic field mapping and displays clear error messages when data retrieval fails, ensuring you know exactly whenconnections encounter problems instead of showing blank results.
How to make it work
Step 1. Establish fresh data connections through Coefficient.
Set up new data imports that ensure proper data mapping and provide visibility into connection or retrieval issues that might cause blank results instead of failing silently.
Step 2. Benefit from automatic data type conversion.
Let the platform handle data formatting automatically, ensuring that data displays properly in Google Sheets regardless of source format changes that break native mappings.
Step 3. Monitor connection status with clear error reporting.
Check connection health and data refresh timestamps in the sidebar to confirm successful data retrieval. The platform shows specific error information instead of leaving you guessing about blank cells.
Step 4. Set up automated alerts for import failures.
Configure notifications to alert you immediately if data imports fail, preventing blank dashboards from going unnoticed while you continue working with empty spreadsheets.
Get your data back
Restore your dataStop dealing with blank cells that hide connection problems and eliminate the frustration of integrations that appear to work but don’t actually import data.with Coefficient for reliable imports that show clear results.
You know that sinking feeling when you realize you’ve created 500 duplicate customer records in HubSpot? Your sales team is calling the same leads twice, your reporting is completely off, and cleaning up the mess will take days.
Coefficient is an Excel add-in that connects HubSpot directly to your spreadsheets, letting you prevent duplicates before they happen with smart import controls and real-time data validation.
Why Duplicate Records Are Destroying Your Customer Data
Every time you import customer data from Excel to HubSpot, you’re playing duplicate roulette. Here’s what’s really happening:
Name inconsistencies multiply: “Robert Smith” and “Bob Smith” become different people in your CRM
Missing data creates ghosts: Blank email fields force new record creation even when the customer exists
Bulk imports compound errors: That monthly customer list import? It’s probably creating 10-20% duplicates each time
The result? Your sales team wastes hours calling the same prospects. Marketing sends duplicate emails that annoy customers. And your revenue reporting becomes fiction because you’re counting the same deals multiple times.
The Traditional Import Process Is Fundamentally Broken
Here’s how most teams handle Excel to HubSpot imports today (and why it fails):
The Manual Nightmare
Export your HubSpot contacts to check for existing records
Manually compare Excel data against exports using VLOOKUP
Try to clean data inconsistencies by hand
Cross your fingers and import
Spend days cleaning up the inevitable duplicates
Why This Never Works
Data changes constantly: By the time you finish comparing, HubSpot has new records
Human error is inevitable: Missing one typo creates cascading duplicates
Scale makes it impossible: Checking 10,000 records manually? Forget it
No prevention mechanism: You’re always reacting, never preventing
Prevent Duplicates Automatically with Coefficient’s Excel Add-in
Coefficient transforms Excel into a smart HubSpot client that prevents duplicates before they happen. Instead of blind imports that create chaos, you get intelligent data syncing that respects your existing records.
How Coefficient Eliminates Duplicates
Real-time HubSpot connection: Your Excel sheet sees current HubSpot data instantly, not yesterday’s export
Smart matching logic: Coefficient uses HubSpot’s email deduplication plus custom rules you define
Update vs. Create intelligence: Existing records get updated, only truly new customers create records
Pre-import validation: See exactly what will happen before you commit any changes
Step-by-Step: Set Up Duplicate Prevention in Excel
Let’s walk through setting up bulletproof duplicate prevention using Coefficient’s Excel add-in.
Step 1: Install Coefficient and Connect HubSpot
Open Excel and install the Coefficient add-in from the Microsoft Store. Connect your HubSpot account with one click – no API keys or complex setup required.
HubSpot workflows can’t handle phone number formatting well because they lack the string manipulation functions you need. The native concatenate and substring functions hit complexity limits fast and often break when chaining multiple operations.
Here’s how to format phone numbers with hyphens using spreadsheets instead, then sync the results back to HubSpot automatically.
Format phone numbers in spreadsheets using Coefficient
CoefficientHubSpotHubSpotlets you pullcontact data into spreadsheets where advanced formulas work reliably. You can format thousands of phone numbers at once, then push the clean data back towithout hitting workflow limits.
How to make it work
Step 1. Import your HubSpot contacts with unformatted phone numbers.
Connect to HubSpot through Coefficient and pull in your contact data. Select the phone number field and any other contact properties you need for processing.
Step 2. Apply phone number formatting formulas.
Use spreadsheet formulas to add hyphens to 10-digit numbers: =CONCATENATE(MID(A2,1,3),”-“,MID(A2,4,3),”-“,MID(A2,7,4)). For numbers with varying lengths, wrap this in IF statements to handle different formats.
Step 3. Add validation for different phone number lengths.
Create conditional formatting using IF statements: =IF(LEN(A2)=10,CONCATENATE(MID(A2,1,3),”-“,MID(A2,4,3),”-“,MID(A2,7,4)),”Invalid Length”). This catches malformed numbers before they go back to HubSpot.
Step 4. Export formatted phone numbers back to HubSpot.
Set up a scheduled export to push the properly formatted phone numbers back to HubSpot contact properties. This runs automatically, so new contacts get formatted without manual work.
Skip the workflow complexity entirely
Start formattingThis approach handles bulk phone number formatting that would break HubSpot workflows. You get reliable formatting, better error handling, and automatic processing.your phone numbers today.
HubSpot’s native Google Sheets marketplace integration provides limited auditing capabilities for sheet access through workflows, making it difficult to track specific user access patterns.
Here’s how to implement superior auditing and monitoring capabilities that provide complete visibility into who can access which sheets and when.
Enable connection-level audit trails with comprehensive monitoring using Coefficient
CoefficientThe broad permission model of HubSpot’s marketplace integration makes it difficult to determine who can access which sheets.offers superior auditing and monitoring capabilities for Google Sheets access through detailed connection-level tracking.
HubSpotSince each user maintains their ownconnections through Coefficient, you can easily audit individual user access patterns and sheet usage with precision.
How to make it work
Step 1. Set up connection-level audit trails.
Each Coefficient connection maintains detailed logs of user activity in the “Connected Sources” menu. You can see exactly who accessed which sheets and when, providing clear visibility into user access patterns.
Since each user maintains their own Coefficient connections, you can easily audit individual user access patterns and sheet usage. Navigate to connection management to review activity for specific users.
Step 3. Monitor data export activity.
Track all scheduled exports and data flows through Coefficient’s management interface, providing comprehensive oversight of contact data movement between HubSpot and Google Sheets.
Step 4. Enable permission change tracking.
Monitor when connections are created, modified, or deleted through the connection management dashboard, maintaining a complete audit trail of access control changes over time.
Step 5. Generate integration security reports.
Create reports on which users have active connections to specific sheets, supporting compliance and security auditing requirements. Export connection data for external audit reviews.
Step 6. Review granular access visibility.
Unlike HubSpot’s all-or-nothing marketplace app model, Coefficient shows exactly which sheets and ranges each user can access, making audit reviews more precise and actionable.
Step 7. Use centralized management dashboard.
Review all active connections across users through Coefficient’s “Connected Sources” menu, providing administrators with complete visibility into integration security settings and user access patterns.
Gain complete visibility into sheet access
Start implementingThis comprehensive auditing approach addresses the significant gaps in HubSpot’s native integration monitoring capabilities, ensuring proper workflow access control and compliance oversight.detailed audit trails today.
HubSpotYou can automatically updatecompany properties when your Google Sheets data changes using scheduled exports that run without any manual work on your part.
Here’s how to set up automatic syncing that keeps your CRM current with your spreadsheet calculations and data updates.
Set up automatic HubSpot updates using Coefficient
Coefficienthandles the heavy lifting by creating scheduled exports that push your Google Sheets data to HubSpot on whatever timeline works for your business – hourly, daily, or weekly.
How to make it work
Step 1. Import your HubSpot companies into Google Sheets.
Use Coefficient’s import feature to pull your company data with HubSpot IDs. This creates the foundation for matching records when you push updates back.
Step 2. Add your data columns in the spreadsheet.
Create columns for the metrics you want to sync back to HubSpot. For example, if you’re tracking active users, put company names in column A and active user counts in column C.
Step 3. Create a scheduled export in Coefficient.
Set up the export to run automatically on your preferred schedule. Map your Google Sheets columns to the corresponding HubSpot company properties – like mapping column C to your “Active Users” custom property.
Step 4. Configure error handling and notifications.
Enable alerts so you know when updates complete successfully or if any errors occur. Coefficient maintains update logs for troubleshooting and provides built-in error handling.
Keep your HubSpot data fresh automatically
Try CoefficientThis approach eliminates hours of manual data entry while ensuring your HubSpot properties stay current with your Google Sheets calculations.to automate your HubSpot updates today.
CRM systems like HubSpot don’t provide native cascading update functionality for product price changes, leaving existing opportunities with outdated pricing data. This creates significant challenges for sales teams trying to maintain accurate deal values and margin calculations when product prices evolve.
Here’s how to systematically cascade price changes across your entire opportunity pipeline while maintaining business logic and competitive positioning.
Implement intelligent price cascading using Coefficient
Coefficientenables intelligent cascading that detects price changes, analyzes impacts, and applies updates selectively based on opportunity characteristics. You can propagate changes across hundreds of opportunities while maintaining margin protection and business rule compliance.
How to make it work
Step 1. Detect price changes and assess impact.
HubSpotImport your current product catalog and existing opportunity line items from. Use formulas like `=IF(NewPrice<>OldPrice,(NewPrice-OldPrice)/OldPrice*100,0)` to calculate percentage price changes and identify affected opportunities.
Step 2. Set up selective cascading criteria.
Define which price changes should cascade based on opportunity stage, close probability, or business rules. Use conditional logic like `=IF(AND(Stage=”Qualified”,PriceChange>0.05),”CASCADE”,”HOLD”)` to apply changes only where appropriate.
Step 3. Protect margins during price updates.
Automatically adjust discounts or margins to maintain profitability targets when costs increase. Calculate new target margins using formulas like `=MAX(NewPrice-TargetCost,MinMargin*NewPrice)` to ensure pricing remains competitive while protecting profits.
Step 4. Apply progressive cascading by opportunity age.
Start with newest opportunities and work backward, applying different rules for recent versus older opportunities. Use filters to process opportunities in phases, monitoring impact at each stage.
Step 5. Handle exceptions and approvals.
Flag opportunities where automatic price updates may require manual review, such as deals with signed quotes or committed pricing. Create exception reports for sales managers to review before applying changes.
Step 6. Execute cascading updates with validation.
HubSpotPush price updates back towith validation to ensure updates maintain logical pricing relationships. Generate detailed reports showing all pricing modifications for audit purposes.
Transform static pricing into dynamic price management
Start cascadingThis cascading approach ensures your entire opportunity pipeline reflects current market pricing and product economics while maintaining competitive positioning and margin protection. You get efficient price synchronization with proper business controls.your price changes systematically.
Combining lead tracking dashboards in HubSpot creates metric calculation issues because different dashboards use varying lead definitions, lifecycle stage configurations, conflicting attribution models, or inconsistent time-based calculations that don’t align properly when merged automatically.
The solution is standardizing lead tracking data management to eliminate double-counting, attribution conflicts, and calculation inconsistencies.
Standardize lead definitions and eliminate calculation inconsistencies
CoefficientHubSpotHubSpot’sresolves lead tracking calculation issues by importing all contacts, deals, and companies fromwith complete lifecycle stage and lead status field selection. You can create unified lead definitions, build consistent attribution models, and implement standardized time-based calculations that eliminate the double-counting and conflicting conversion rates that plagueautomatic dashboard combinations.
How to make it work
Step 1. Import comprehensive lead data with standardized field selection.
Use Coefficient to import all contacts, deals, and companies with complete lifecycle stage, lead status, and source attribution fields. Create unified lead definition columns that reconcile different lead criteria across your original dashboards using logical operators and consistent date filtering.
Step 2. Build controlled metric calculations.
Create lead volume metrics using COUNTIFS functions that count unique leads based on standardized criteria, preventing double-counting across tracking systems. Build conversion rate calculations with consistent denominators (total leads vs. qualified leads) and implement lead velocity metrics using standardized date fields and business day logic.
Step 3. Implement consistent source attribution.
Use Coefficient’s association handling to link contacts to their original source deals and campaigns, creating unified lead source attribution that works across all tracking systems. Build calculated columns that resolve conflicting attribution when leads appear in multiple tracking dashboards.
Step 4. Set up quality assurance and monitoring.
Use Coefficient’s snapshot feature to capture lead status at regular intervals for accurate progression tracking, and create validation reports comparing combined metrics against individual dashboard totals. Set up scheduled imports for real-time accuracy and implement alert systems for significant metric discrepancies.
Eliminate lead tracking calculation errors through standardized data management
Start buildingControlling lead definitions and calculations explicitly prevents the metric calculation issues that occur when HubSpot tries to automatically reconcile incompatible tracking configurations.combined lead tracking dashboards that maintain calculation accuracy across all your tracking systems.
Configuring Y-axis for multiple metrics in HubSpot’s unified dashboards fails because the platform can’t handle different metric scales, data types, and units within single visualizations. HubSpot forces all metrics onto one Y-axis scale, making smaller values invisible or creating misleading visualizations.
The solution is preparing data specifically for multi-metric visualization with proper scaling and metric groupings.
Prepare data with proper scaling for multi-metric Y-axis configuration
CoefficientHubSpotHubSpot’sprovides sophisticated Y-axis configuration through data preparation by importing all relevant data fromand creating separate data ranges for metrics requiring different Y-axis scales. You can build normalized versions of metrics, create metric hierarchies, and prepare multiple data ranges with consistent dimensions, unlikelimited automatic scaling options.
How to make it work
Step 1. Create separate data ranges for different metric scales.
Import all relevant HubSpot data using Coefficient and create separate data ranges for metrics requiring different Y-axis scales. For example, create one range for revenue amounts and another for conversion percentages, while maintaining consistent date and dimension columns for synchronized filtering.
Step 2. Build normalized metric versions.
Create calculated columns that convert metrics to comparable scales when appropriate. Convert revenue to thousands, percentages to decimals, or create index values and percentage-of-target calculations that enable unified scaling across different metric types.
Step 3. Establish metric categories and hierarchies.
Create clear metric categories (volume metrics, rate metrics, currency metrics) with standardized scaling and build metric hierarchies with primary and secondary indicators for dual-axis chart preparation. Use conditional formatting to identify which metrics need secondary Y-axis treatment.
Step 4. Set up automated scaling maintenance.
Use Coefficient’s scheduled refreshes to maintain proper scaling as data values change over time. Create validation checks to ensure Y-axis scaling remains appropriate as data ranges evolve, and build documentation columns explaining transformation logic for each metric type.
Enable proper multi-metric visualization with controlled Y-axis scaling
Start buildingPreparing data specifically for multi-metric visualization eliminates Y-axis configuration issues and enables meaningful comparisons.unified dashboards that properly handle multiple metric types with appropriate Y-axis scaling.
Most HubSpot integrations require workflow automations that aren’t available on Free plans, but you can connect HubSpot to Google Sheets using a direct API integration that bypasses workflows entirely.
This guide shows you how to set up automatic data sync between HubSpot and Google Sheets without any workflow dependencies or plan restrictions.
Set up direct HubSpot to Google Sheets integration using Coefficient
CoefficientHubSpotprovides directto Google Sheets integration that works identically on Free, Starter, and Professional plans. The connection uses OAuth authentication and direct API calls instead of workflow triggers.
How to make it work
Step 1. Install Coefficient from Google Workspace Marketplace.
Open Google Sheets, go to Extensions > Add-ons > Get add-ons, and search for “Coefficient”. Install the add-on to your Google account.
Step 2. Connect to HubSpot using OAuth authentication.
Open Coefficient’s sidebar, click “Connected Sources”, select HubSpot, and authenticate with your credentials. This process doesn’t require workflow setup or automation permissions.
Step 3. Import HubSpot object data with custom field selection.
Choose any HubSpot object (contacts, companies, deals, tickets) and select specific fields to import. You can apply up to 25 filters to focus your data import without using HubSpot workflows.
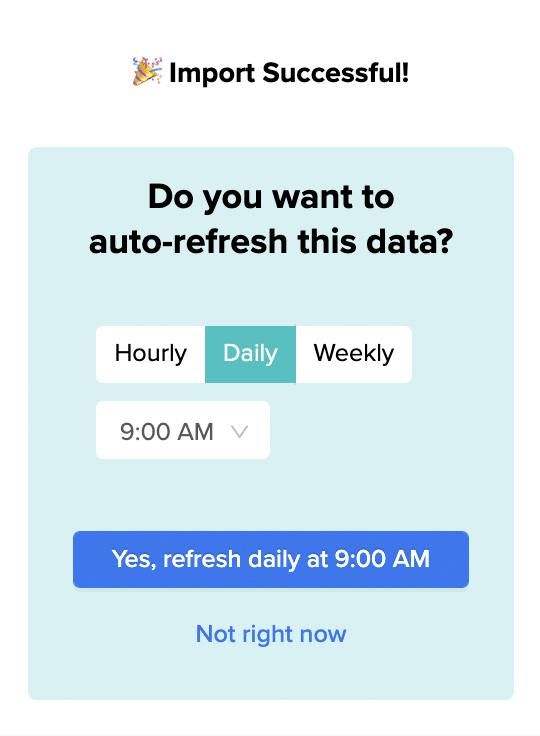
Step 4. Schedule automatic data refreshes.
Set up hourly, daily, or weekly automatic refreshes using Coefficient’s scheduling system. This keeps your Google Sheets data current without relying on HubSpot’s automation features.
Step 5. Export data back to HubSpot when needed.
Use Coefficient’s export functionality to update HubSpot records, manage contact lists, and handle object associations directly from Google Sheets.
Start syncing HubSpot data without workflow limitations
Get startedCoefficient eliminates the workflow dependency issue that blocks Free plan users from most HubSpot integrations. You get real-time data access and bi-directional sync capabilities regardless of your plan type.with workflow-free HubSpot integration today.
Consolidating multiple lead status dashboards in HubSpot often introduces data accuracy issues because different dashboards use varying lifecycle stage configurations, custom lead status properties, or conflicting date range filters that don’t align properly during consolidation.
The key is creating a standardized data foundation where you control lead definitions and metric calculations directly.
Create a unified lead tracking system with standardized definitions
CoefficientHubSpotHubSpot’sprovides comprehensive lead status consolidation by importing all contacts and deals fromwith complete field selection. You can then create unified lead definitions that reconcile different criteria across your original dashboards, ensuring consistent tracking without the accuracy issues that plaguenative consolidation.
How to make it work
Step 1. Import all lead-related data with consistent filtering.
Use Coefficient to import contacts, deals, and companies with all lead status properties, lifecycle stages, and relevant dates. Apply identical date ranges and contact criteria across all imports to ensure you’re capturing the same data that fed your original dashboards.
Step 2. Create standardized lead status definitions.
Build calculated columns that create unified lead definitions across all tracking systems. For example, create a “Qualified Lead” column that equals TRUE when lifecycle stage is in [‘MQL’, ‘SQL’] OR custom status equals ‘Qualified’, reconciling different lead criteria from your original dashboards.
Use spreadsheet formulas to calculate conversion rates with standardized denominators and time-based logic. Create separate columns for different conversion stages (visitor to lead, lead to opportunity, opportunity to customer) using consistent date filtering and business day calculations.
Step 4. Set up accuracy validation and monitoring.
Create validation reports that compare your consolidated metrics against individual dashboard totals. Use Coefficient’s snapshot feature to capture historical lead status data at regular intervals, and set up scheduled imports to maintain real-time accuracy as lead statuses change.
Maintain perfect lead tracking accuracy across all consolidated data
Start buildingStandardizing lead definitions and controlling calculations directly eliminates consolidation accuracy issues.a unified lead tracking system that preserves data accuracy across all your consolidated dashboards.