What’s the best way to push Excel data from on-premise servers to HubSpot reporting tools

The most effective approach is connecting directly to your on-premise databases rather than pushing Excel files. This eliminates network limitations and provides superior automation for HubSpot reporting.

You’ll get better data freshness, reduced IT overhead, and more reliable sync compared to traditional file-based methods.

Create a database bridge to HubSpot using Coefficient

CoefficientHubSpotprovides the most effective solution for on-premise to cloud data sync by establishing direct database connections rather than relying on file transfers. Instead of pushing Excel files, Coefficient connects to the underlying SQL databases that populate your on-premise Excel reports, using itself as a cloud-based bridge between your internal data and.

How to make it work

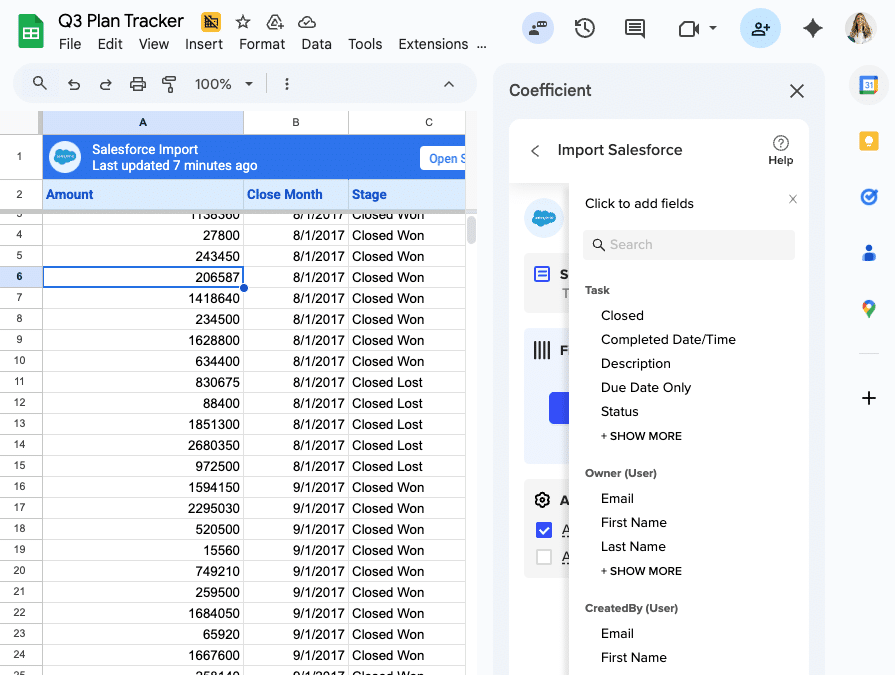
Step 1. Configure your database connection.

Set up Coefficient to connect to your on-premise SQL database—the same source that feeds your Excel reports. This eliminates the need for complex file transfer protocols or VPN configurations for file access.

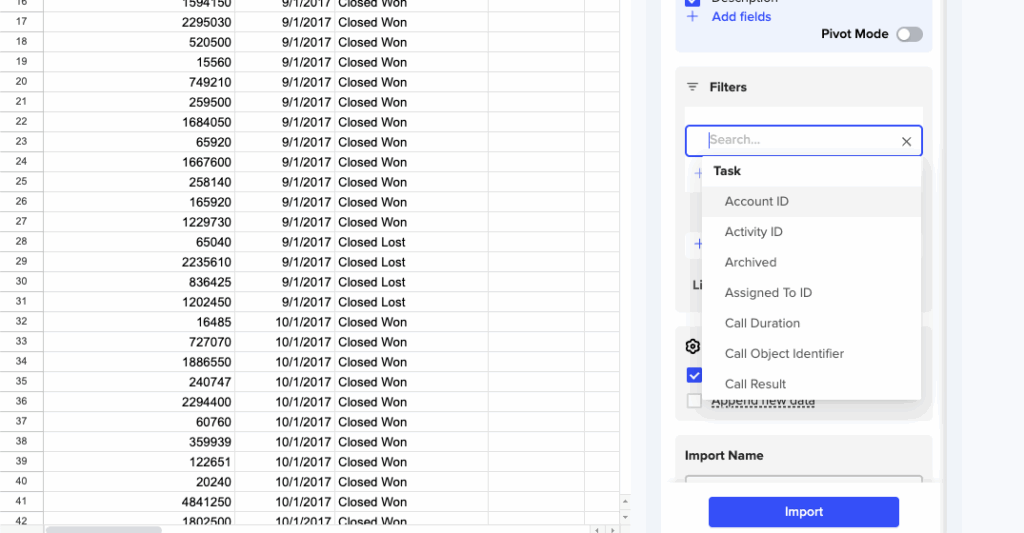
Step 2. Set up automated data sync schedules.

Configure regular data imports and exports to maintain fresh reporting data in HubSpot. You can schedule updates as frequently as hourly or as infrequently as monthly, depending on your reporting needs.

Step 3. Map data fields to HubSpot objects.

Configure automatic field mapping between your database and HubSpot custom objects, properties, and associations. This makes your on-premise data immediately available in HubSpot’s reporting tools.

Step 4. Configure export actions for HubSpot.

Use Coefficient’s export capabilities to UPDATE existing HubSpot records, INSERT new ones, or DELETE outdated entries. This keeps your HubSpot reporting tools synchronized with your on-premise data sources.

Step 5. Set up monitoring and alerts.

Configure automated notifications via Slack or email when data sync operations complete or encounter issues. This ensures you stay informed about your data pipeline status.

Streamline your on-premise to cloud data pipeline

Start connectingThis database connection approach maintains data security while eliminating the complexity of traditional file-based sync methods.your on-premise data to HubSpot reporting tools today.

Why Salesforce email message reports show incomplete email history

Salesforce’s EmailMessage object has technical constraints that cause incomplete email history reporting. Emails from different channels aren’t captured consistently, and API limitations affect data availability.

You’ll learn how to identify these data gaps and work around them by combining multiple Salesforce objects to create more complete email history reports.

Identify and fill email data gaps using Coefficient

CoefficientSalesforceSalesforcecan’t solve the underlying data capture issues in, but it helps you identify where email data actually lives and combines all available sources for the most complete picture possible in.

How to make it work

Step 1. Extract all available EmailMessage records.

Use custom SOQL queries to access EmailMessage fields that standard reports miss. Pull all available email records with comprehensive field selection to see what data is actually captured.

Step 2. Cross-reference Task and Event objects.

Import Task and Event data simultaneously to identify email activities recorded in different locations. Many email activities get logged as Tasks or Events instead of EmailMessage records.

Step 3. Create data comparison reports.

Import from multiple objects at once to highlight discrepancies in email tracking. Compare EmailMessage counts with Task-based email activities to identify gaps in your email history.

Step 4. Build comprehensive email audit reports.

Combine EmailMessage, Task, and Event data in a single analysis to get the fullest picture of email activity. Use formulas to consolidate email data from all sources.

Step 5. Monitor data capture consistency.

Schedule automated data extractions to track email data capture over time. Set up alerts to identify when email data capture drops unexpectedly.

Get the complete email picture

Start buildingDon’t let incomplete EmailMessage data limit your email analysis. Coefficient helps you find and combine all available email data sources in Salesforce for more accurate reporting.comprehensive email history reports today.

Why custom report type Activities won’t show opportunity field values via lookup in Salesforce

Salesforce’s custom Activities report type fails to show opportunity field values through lookup relationships due to complex relationship paths, report type configuration limitations, and data model constraints. Activities can relate to multiple object types through the same WhatId field, creating ambiguous lookup paths that the platform can’t resolve reliably.

Here’s how to get 100% reliable access to opportunity fields in your activity reports without fighting platform limitations.

Get reliable opportunity field access using Coefficient

Coefficient’s Salesforce connector for Google Sheets or Excel eliminates these lookup issues entirely by giving you direct access to source data, live in your spreadsheet. Instead of relying on problematic Activities report type, you create your own reliable relationships and reports that work every time. There’s a reason it’s rated 5-stars on Salesforce AppExchange.

Feel free to jump straight to the written walkthrough below, or check out this video walkthrough to see how to pull data from Salesforce into your spreadsheet with Coefficient to create your custom Activities reports.

Get started with Coefficient for free

How to make it work

Step 1. Import Activities with relationship data.

Pull Task/Event data including WhatId fields that link to opportunities using Coefficient’s “From Objects & Fields” method. Include Subject, ActivityDate, Status, and any other activity fields you need for analysis. This can be done in Google Sheets or Excel.

custom report type Activities from Salesforce in Google Sheets or Excel

Step 2. Import complete opportunity data separately.

Get all opportunity fields you need (Amount, Stage, Close Date, Name, etc.) directly from the Opportunity object. This ensures you have access to any field, not just the limited lookup options available in Activities reports.

Step 3. Create reliable joins using spreadsheet functions.

Use VLOOKUP, XLOOKUP, or INDEX/MATCH to connect activity records to opportunity details using the WhatId/Opportunity ID relationship. For example: to get opportunity amounts for each activity. Need help with formulas or anything else in your spreadsheet. Coefficient also offers an AI Sheets Assistant to help.

Step 4. Verify complete field population.

Check that all relationships are working properly using formulas to identify any missing data. With direct data access, you should have 100% field population without the gaps that plague Activities reports.

Step 5. Set up enhanced filtering by opportunity characteristics.

Filter by opportunity characteristics without affecting activity data visibility. Use Coefficient’s dynamic filters to analyze activities related to opportunities over certain amounts, in specific stages, or with particular close dates.

enhanced filters for your salesforce activities report

Build activity reports with guaranteed data access

This approach provides comprehensive activity-opportunity reporting that Salesforce’s Activities custom report type simply can’t deliver due to its inherent lookup field limitations. You get consistent performance, reliable results, and complete field access every time.activity reports that actually show you all the data you need. Learn more about Coefficient’s Salesforce connector.

Why does Salesforce connector force full table imports with all fields

Traditional Salesforce connectors force full table imports due to technical limitations and simplified architectures. They lack field-level query capabilities and user interfaces for selective imports, making them inefficient for large datasets.

Here’s how to get granular control over your Salesforce imports with selective field and record filtering that can reduce import times by 80-95%.

Get selective import control with Coefficient

Coefficientprovides a superior alternative that addresses the limitations of basic connectors. You can select specific fields, filter records, and limit row counts all before any data transfer occurs.

How to make it work

Step 1. Select specific fields instead of importing everything.

Use Coefficient’s field selector to choose only the fields you need. Instead of importing all 200+ fields from a Contact object, select just Name, Email, and Phone fields for a 95% reduction in data volume.

Step 2. Apply advanced filtering with AND/OR logic.

Set up to 25 filters with complex logic to import only relevant records. For example, import only active contacts from the last 30 days instead of your entire contact database.

Step 3. Use dynamic filtering with spreadsheet cell references.

Reference spreadsheet cells for filter values that update with each refresh. This allows your imports to adapt automatically based on changing criteria without manual reconfiguration.

Step 4. Configure incremental updates for changed data only.

Import only new or changed records rather than full datasets. This approach dramatically reduces API consumption and stays within Salesforce governor limits more easily.

Step 5. Set up smart caching and optimized refresh cycles.

Enable smart caching that refreshes only changed data and set different refresh schedules for different field sets. Use preview functionality to test performance before full import.

Transform your Salesforce imports today

Start importingSelective imports transform resource-intensive full-table approaches into surgical, efficient processes that get exactly the data you need.Salesforce data the smart way.

Why doesn’t HubSpot have native Excel connector like Gmail add-in

HubSpot focuses on integrations that bring external data into their platform rather than solutions that facilitate data leaving it, unlike Gmail’s add-in which enhances HubSpot usage.

Here’s why this gap exists and how to get the native Excel connector experience that HubSpot doesn’t provide.

Get the native HubSpot Excel connector that doesn’t exist

CoefficientHubSpotfunctions as the missing nativeconnector, providing the seamless experience users expect from a built-in integration.

How to make it work

Step 1. Install as a native Excel add-in.

Coefficient appears directly in your Excel ribbon just like a native integration would. No external applications or complex setup required.

Step 2. Connect with one-click OAuth authentication.

Direct connection to HubSpot without API tokens or technical configuration. The authentication process mirrors what you’d expect from a native solution.

Step 3. Use the point-and-click interface.

Select HubSpot objects and fields through visual menus in the Excel sidebar. Choose specific fields, apply filters, and configure imports without any coding.

Step 4. Set up real-time sync capabilities.

Schedule automated refreshes that manual exports can’t match. Your data stays current without the repeated download-and-import cycle that HubSpot’s CSV exports require.

Step 5. Handle field selection like a native integration.

Pick exactly which HubSpot fields you need, just as you would with any built-in connector. No need to export everything and then delete unwanted columns.

Fill the gap in HubSpot’s integration roadmap

ExperienceWhile HubSpot hasn’t prioritized a native Excel connector, Coefficient delivers the live data connection and user-friendly experience that fills this product gap.the native integration that should exist.

Why filtering by activity subject makes opportunity data disappear in Salesforce reports

Salesforce’sThis happens becausecross-object reporting uses inner joins instead of left joins when applying filters. When you filter by activity subject, the platform only shows opportunities that have activities matching your criteria, completely excluding opportunities without matching activities.

Here’s how to filter activities while preserving all opportunity records for complete pipeline visibility.

Preserve opportunity data with proper left join filtering using Coefficient

CoefficientSalesforcesolves this fundamentalreporting limitation by letting you control how data gets joined. You can filter activities without losing opportunity records, giving you the complete dataset you actually need.

How to make it work

Step 1. Import your complete opportunity dataset first.

Pull all opportunities regardless of activity status using Coefficient’s Salesforce connector. Include all opportunity fields you need like Name, Amount, Stage, CloseDate, and Owner. This dataset stays complete no matter what activity filters you apply.

Step 2. Import filtered activities separately.

Create a second import for activities with your subject filter already applied. Use Coefficient’s filtering options to get only activities with subjects that match your criteria. Include the WhatId field to link back to opportunities.

Step 3. Join with preservation using LEFT JOIN-style functions.

Use VLOOKUP with IFERROR or XLOOKUP to show all opportunities, displaying activity data where it exists and blanks where it doesn’t. For example:This preserves every opportunity record.

Step 4. Set up dynamic filters for easy adjustments.

Use Coefficient’s dynamic filtering that points to spreadsheet cells. Change activity subject filters without losing opportunity records or rebuilding your entire report. Just update the filter criteria and refresh.

Analyze activity patterns across your complete pipeline

Build reportsThis eliminates the data loss issue entirely while giving you comprehensive cross-object reporting that Salesforce’s native capabilities can’t deliver. You maintain complete opportunity pipeline visibility while analyzing specific activity patterns.that show your full pipeline story, not just the filtered fragments.

Why omni channel work item time fields show incorrect values in standard Salesforce reports

SalesforceOmni channel work item time fields often show incorrect values instandard reports due to timezone conversion issues, report processing delays, and field calculation timing problems that distort your actual metrics.

Here’s why these inaccuracies happen and how to get reliable timestamp data that reflects your actual omni channel performance.

The root causes of timestamp inaccuracies

SalesforceStandardreports introduce several layers of processing that can corrupt your timestamp data:

  • Timezone conversions that shift timestamps incorrectly during report generation
  • Report refresh delays that don’t capture real-time timestamp updates
  • Field calculations that round or truncate time values during processing
  • Limited formula capabilities for complex time arithmetic within reports

Get accurate timestamps using Coefficient

Coefficientbypasses these standard report limitations by accessing raw timestamp data directly from Salesforce objects, preserving exact values without the distortions common in processed reports.

How to make it work

Step 1. Import raw timestamp data directly.

Connect Coefficient to your Salesforce org and import work item data using the “From Objects & Fields” method. This pulls timestamp values directly from the database without report processing layers that introduce inaccuracies.

Step 2. Perform calculations in your spreadsheet.

Use your spreadsheet’s time functions to calculate intervals and metrics with full precision. Formulas like =AcceptDate-RouteDate maintain exact values without the rounding or truncation that happens in Salesforce reports.

Step 3. Set up real-time data refresh.

Configure automatic refreshes to capture the most current timestamp information. This eliminates the delays between timestamp updates and your metric calculations that cause discrepancies in standard reports.

Step 4. Handle timezone conversions explicitly.

Take control of timezone handling by performing conversions explicitly in your spreadsheet with full visibility into the process. This prevents the hidden timezone conversion errors that plague standard reports.

Trust your omni channel metrics again

Get startedThis approach ensures your time metrics reflect actual routing and acceptance timestamps without the distortions that make standard Salesforce reports unreliable.with accurate timestamp tracking today.

Why opportunity lookup fields don’t populate in Salesforce Activities custom report type

SalesforceOpportunity lookup fields fail to populate inActivities custom report types because of how the platform handles cross-object relationships in reporting. The Activities report type can’t reliably access opportunity fields through lookup relationships, especially when connections aren’t direct or multiple parent records exist.

Here’s how to bypass these lookup field issues entirely and get the complete activity-opportunity data you need.

Get reliable opportunity data in activity reports using Coefficient

Salesforce’sCoefficientInstead of fightingreporting limitations,lets you pull data directly from source objects and create your own reliable relationships. This eliminates the lookup field population problems completely.

How to make it work

Step 1. Import your Tasks and Events data separately.

Use Coefficient’s “From Objects & Fields” method to pull all activity data. Make sure to include the WhatId field – this contains the opportunity ID that links activities to opportunities. Also grab Subject, Status, ActivityDate, and any other activity fields you need.

Step 2. Import opportunity data in a second import.

Create another import pulling all the opportunity fields that weren’t showing up in your Activities report. Include Opportunity ID, Name, Amount, Stage, CloseDate, and any custom fields you need for analysis.

Step 3. Join the data using spreadsheet functions.

Use VLOOKUP, XLOOKUP, or INDEX/MATCH to connect your activity records to opportunity data. Match the WhatId from activities to the Opportunity ID. For example:where B2 contains the WhatId.

Step 4. Set up dynamic filtering without data loss.

Apply Coefficient’s dynamic filters to analyze activities by subject or other criteria. Unlike Salesforce reports, this won’t cause you to lose associated opportunity data when filtering.

Build reports that actually work

Try CoefficientThis approach gives you complete control over your activity-opportunity reporting without the frustrating lookup field issues. You get reliable data every time, plus the ability to analyze patterns that Salesforce’s native reporting simply can’t handle.to eliminate these cross-object reporting headaches for good.

Workaround for HubSpot CSV import limitations with multiple checkbox field types

HubSpot’s CSV import limitations for multiple checkbox fields create significant obstacles including delimiter parsing errors, value overwriting instead of appending, lack of validation, and inability to handle complex data structures. Traditional workarounds like API scripting or manual updates are time-consuming and technical.

Here’s a comprehensive workaround that’s accessible to non-technical users and provides the flexibility and reliability that CSV imports cannot deliver.

Complete checkbox management solution using Coefficient

CoefficientHubSpotHubSpotprovides a comprehensive workaround through direct spreadsheet integration that eliminates CSV entirely. You can work in familiar Google Sheets or Excel environments with live connections toanddata, maintaining no file exports or formatting requirements.

How to make it work

Step 1. Set up bi-directional sync capabilities.

Import current checkbox values to see existing selections, modify or append values directly in your spreadsheet, then push updates back to HubSpot with proper formatting. This maintains data integrity while providing full control over checkbox management.

Step 2. Implement advanced checkbox management features.

Handle associations while updating checkbox values to maintain object relationships, perform bulk operations to update thousands of records simultaneously, and set up scheduled updates to automate regular checkbox value updates with conditional logic.

Step 3. Use data transformation for complex scenarios.

Convert survey responses to checkbox selections using formulas like =IFS(A2=”Very Interested”, “Premium, Priority”, A2=”Interested”, “Standard”, TRUE, “Basic”). This handles dynamic checkbox assignment based on other data points.

Step 4. Implement error prevention and recovery systems.

Validate data before sending to HubSpot, create snapshot backups of data states, receive clear error messages if issues occur, and avoid silent failures that plague CSV imports. This ensures reliable checkbox management with full audit trails.

Transform limitations into manageable workflows

Start managingCoefficient transforms HubSpot’s checkbox limitations from a blocking issue into a manageable workflow, providing the flexibility and reliability that CSV imports cannot deliver. Ready to overcome CSV limitations?checkboxes effectively today.

Convert dashboard KPI tiles to Excel charts with source data

You can convert dashboard KPI tiles to Excel charts by importing the underlying metrics and dimensions, then recreating KPI calculations with enhanced flexibility and automated data refresh capabilities.

This approach often provides superior KPI analysis compared to dashboard limitations, including custom calculation flexibility and the ability to combine KPIs from multiple data sources.

Transform KPI tiles into dynamic Excel charts using Coefficient

CoefficientHubSpotsupports KPI conversion by automating the data foundation that powers KPI calculations. You get more flexibility than native dashboard KPI limitations, with the ability to create custom calculations and combine data from sources likeand Salesforce.

The key advantage is enhanced analytical capabilities with historical trending, threshold alerts, and the ability to build complex KPI formulas that many dashboards can’t support natively.

How to make it work

Step 1. Identify source data and calculations behind each KPI tile.

Document the underlying metrics, dimensions, and calculation logic for each dashboard KPI. Note any filters, date ranges, or business logic applied to understand how to recreate the KPI accurately.

Step 2. Import underlying metrics with custom field selection.

Use Coefficient to import the specific data fields needed for KPI calculations. Apply business logic filters to focus on relevant data segments for each KPI, ensuring accuracy matches your dashboard.

Step 3. Set up multiple object imports for complex KPIs.

Pull related data from different sources when KPIs require cross-object calculations. This enables more sophisticated KPI analysis than single-source dashboard limitations.

Step 4. Recreate KPI calculations using Excel formulas.

Build KPI calculation formulas that reference your Coefficient-managed data ranges. Use Excel’s advanced formula capabilities to create more complex calculations than dashboard KPIs typically support.

Step 5. Create KPI visualization charts.

Build Excel charts that visualize KPI performance using gauges, trend lines, comparison charts, or other formats. Excel’s charting flexibility often exceeds dashboard KPI display options.

Step 6. Configure refresh schedules for current KPI data.

Set up automated refreshes that match your dashboard’s KPI update frequency. Enable Formula Auto Fill Down so KPI calculations automatically extend when new data arrives.

Step 7. Set up threshold alerts for KPI monitoring.

Use Coefficient’s alert capabilities to notify when KPIs cross threshold values or show significant changes. This provides proactive KPI monitoring beyond typical dashboard capabilities.

Enhance your KPI analysis capabilities

Start buildingThis workflow transforms static dashboard KPI tiles into dynamic Excel charts with enhanced calculation flexibility and automated monitoring capabilities.your advanced KPI analysis solution today.