Table of Contents
![]()
- 1. How to Build NetSuite Financial Statements
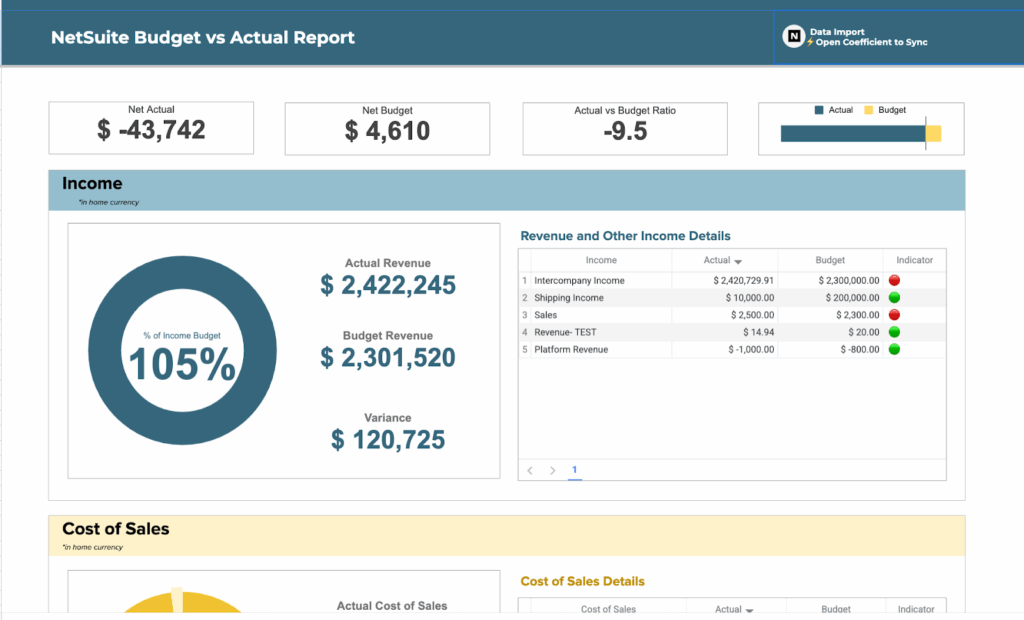
- 2. How to Setup NetSuite Budget vs Actual Reporting
- 3. How to set up NetSuite financial consolidation
- 4. How to Do Multi-Entity Financial Consolidation from Multiple NetSuite Instances
- 5. How to Customize NetSuite Reports: Simple Guide for 2025
- 6. How to Create a NetSuite KPI Dashboard
- 7. How to Pull NetSuite Custom Reports into Excel
- 8. How to Pull NetSuite Custom Reports into Google Sheets


NetSuite provides standard financial statements out of the box. But most finance teams need more. Boards want custom formats. Regulatory bodies have specific requirements. And month-end reporting needs to happen faster than manual processes allow.
This guide covers two approaches to building NetSuite financial statements. You’ll learn when to use native tools and when Excel-based automation makes more sense.
Two ways to build NetSuite financial statements
Finance teams typically choose between native NetSuite reporting and Excel-based solutions with live data connections. Each approach has specific strengths.
- Native NetSuite works well for standard reports and teams comfortable with the Financial Report Builder. Excel-based solutions like Coefficient work better when you need custom formatting, faster month-end close, or board-ready presentations.
The right choice depends on your reporting complexity, formatting requirements, and how much time your team spends on manual data work.
#1 Native NetSuite financial statements
NetSuite includes hundreds of standard reports. You get Income Statements, Balance Sheets, Cash Flow Statements, and Trial Balances configured for different countries and accounting standards.
Core capabilities
The Financial Report Builder lets you customize existing reports. You can filter by GL accounts, transaction types, or custom fields. Multi-period comparative analysis shows trends over time. And you can drill down from high-level summaries to individual transactions.
For multi-entity companies, NetSuite supports consolidation across subsidiaries. The multi-book feature handles different accounting standards. You can run before-and-after reports to show the impact of accounting changes. Intercompany eliminations happen automatically when configured correctly.
Advanced features
NetSuite’s multidimensional analysis connects organizational data to financial transactions. You can track performance by division, territory, channel, or product line. Custom dimensions let you analyze data in ways specific to your business structure.
Role-based access controls protect sensitive financial data. You decide which users see which subsidiaries, departments, or GL accounts.
Setup limitations
The Financial Report Builder has a learning curve. Data lives in different tables, and the interface isn’t always intuitive. One NetSuite consulting firm notes: “The biggest complaint we hear from clients after going live with NetSuite is the manual steps required to produce monthly management reports.”
Common challenges include:
- SuiteAnalytics required for comprehensive monthly reporting packs
- Manual report maintenance when new accounts are added
- Limited template flexibility for custom formatting needs
Many teams work around these issues by purchasing SuiteAnalytics, using third-party tools, or exporting data to Excel for final formatting. These workarounds add cost or manual steps back into the process.
Native NetSuite financial statements work best when standard formats meet your needs and your team has the technical expertise to configure advanced reports.
#2 Excel-based financial statements with live data
Most finance teams export NetSuite data to Excel for final formatting. The problem is keeping those spreadsheets current. Manual exports create stale data, version control issues, and hours of repetitive work each month.
Live data without manual exports
Coefficient connects Excel and Google Sheets directly to NetSuite. Your financial statements pull live data automatically. No more downloading CSV files or copy-pasting into templates.
You can import data four different ways:
- Reports method for standard Income Statements, Trial Balances, and General Ledgers
- Records & Lists for transaction-level detail
- Saved Searches for pre-configured queries with custom logic
- SuiteQL for complex calculations and custom metrics (up to 100,000 rows)
The setup takes minutes. Install the add-on, connect to NetSuite, and select which reports you want to pull. Configure your accounting period selection, subsidiary filtering, and department segmentation. Then set a refresh schedule.
Professional formatting and automation
Once data flows into your spreadsheet, you control the formatting completely. Build layouts that match board requirements. Create variance analysis with automated budget vs. actual comparisons. Add charts, conditional formatting, and custom calculations.
Cyrq Energy, a geothermal power company, rebuilt their NetSuite reporting in days using this approach. Director of Finance Sam Sholeff explains: “We were able to recreate reports on our NetSuite data in days with Coefficient. This took us months to build with other database query tools. Our spreadsheets are now faster, more accurate, and easier to update.”

The finance team saved over $50,000 annually compared to enterprise reporting tools. More importantly, they freed up hours previously spent on manual data extraction and formatting.
Variance analysis and month-end automation
Financial statements need context. Variance analysis shows which line items changed and why. This variance analysis template automates period-over-period comparisons and budget vs. actual tracking.
Schedule your financial statements to refresh automatically after period close. Consolidate multiple NetSuite reports in a single workbook. Set up hands-off reporting that updates overnight, ready for your morning review.
CFO Allison James details this approach in a webinar on automating month-end close. She demonstrates how to save 8+ hours each month by eliminating manual report preparation.
Common financial statement challenges
Finance teams face similar obstacles when building NetSuite financial statements, regardless of which approach they choose.
- Manual work consumes time. GL exports take hours during close cycles. You log into NetSuite, run reports, download CSV files, and import them into Excel templates. Any adjustments posted after your export require running the entire process again.
- Formatting rarely matches requirements. Standard NetSuite reports don’t match board presentation formats. You need to reformat data, add company branding, create custom subtotals, and build comparative columns. This reformatting happens manually each month.
- Version control creates confusion. Multiple team members work with financial data during close. Email attachments circulate with names like “P&L_Final_v3_FINAL.xlsx.” Nobody knows which version contains the latest numbers.
- Close cycles take too long. Mid-market companies average 7-10 days for month-end close. Best-in-class teams complete the process in 3-5 days. The difference often comes down to automation.
Automate your NetSuite financial statements
Your financial statements should update automatically. Live data connections eliminate manual exports. Scheduled refreshes keep reports current. And professional formatting happens once, then replicates each period.
Start with your most time-consuming reports. Income statements and balance sheets typically get the most requests. Build once, use repeatedly. Configure your data connections, set refresh schedules, and let automation handle the manual work.
Finance teams using this approach reduce month-end close by days and spend more time on strategic work that actually impacts business decisions.
Get started with live NetSuite data in your spreadsheets today.