Table of Contents
![]()
- 1. How to Build NetSuite Financial Statements
- 2. How to Setup NetSuite Budget vs Actual Reporting
- 3. How to set up NetSuite financial consolidation
- 4. How to Do Multi-Entity Financial Consolidation from Multiple NetSuite Instances
- 5. How to Customize NetSuite Reports: Simple Guide for 2025
- 6. How to Create a NetSuite KPI Dashboard
- 7. How to Pull NetSuite Custom Reports into Excel
- 8. How to Pull NetSuite Custom Reports into Google Sheets


Budget variance happens fast. A department overspends by 15% in Q2. Marketing campaigns burn through allocated funds by mid-quarter. Revenue comes in 8% below projections, and leadership doesn’t see it until month-end close wraps up. NetSuite budget vs actual reporting helps finance teams catch these variances before they become problems.
This guide shows you two ways to setup budget vs actual tracking: native NetSuite reporting and Excel-based analysis with live data connections.
Two ways to setup budget vs actual reporting
NetSuite gives you built-in tools for budget variance analysis. These native reports work well for basic tracking and meet standard accounting needs. But finance teams that need deeper analysis, custom visualizations, or automated distribution often turn to Excel-based solutions that pull live NetSuite data.
Both approaches have clear use cases. Native NetSuite reporting handles standard financial statements and regulatory compliance. Excel-based analysis with tools like Coefficient’s NetSuite connector adds advanced formulas, trend analysis, and executive dashboards that update automatically.
The right choice depends on your reporting complexity. Simple variance tracking? NetSuite’s built-in reports handle it. Multi-dimensional analysis with automated distribution? You need Excel with live data connections.
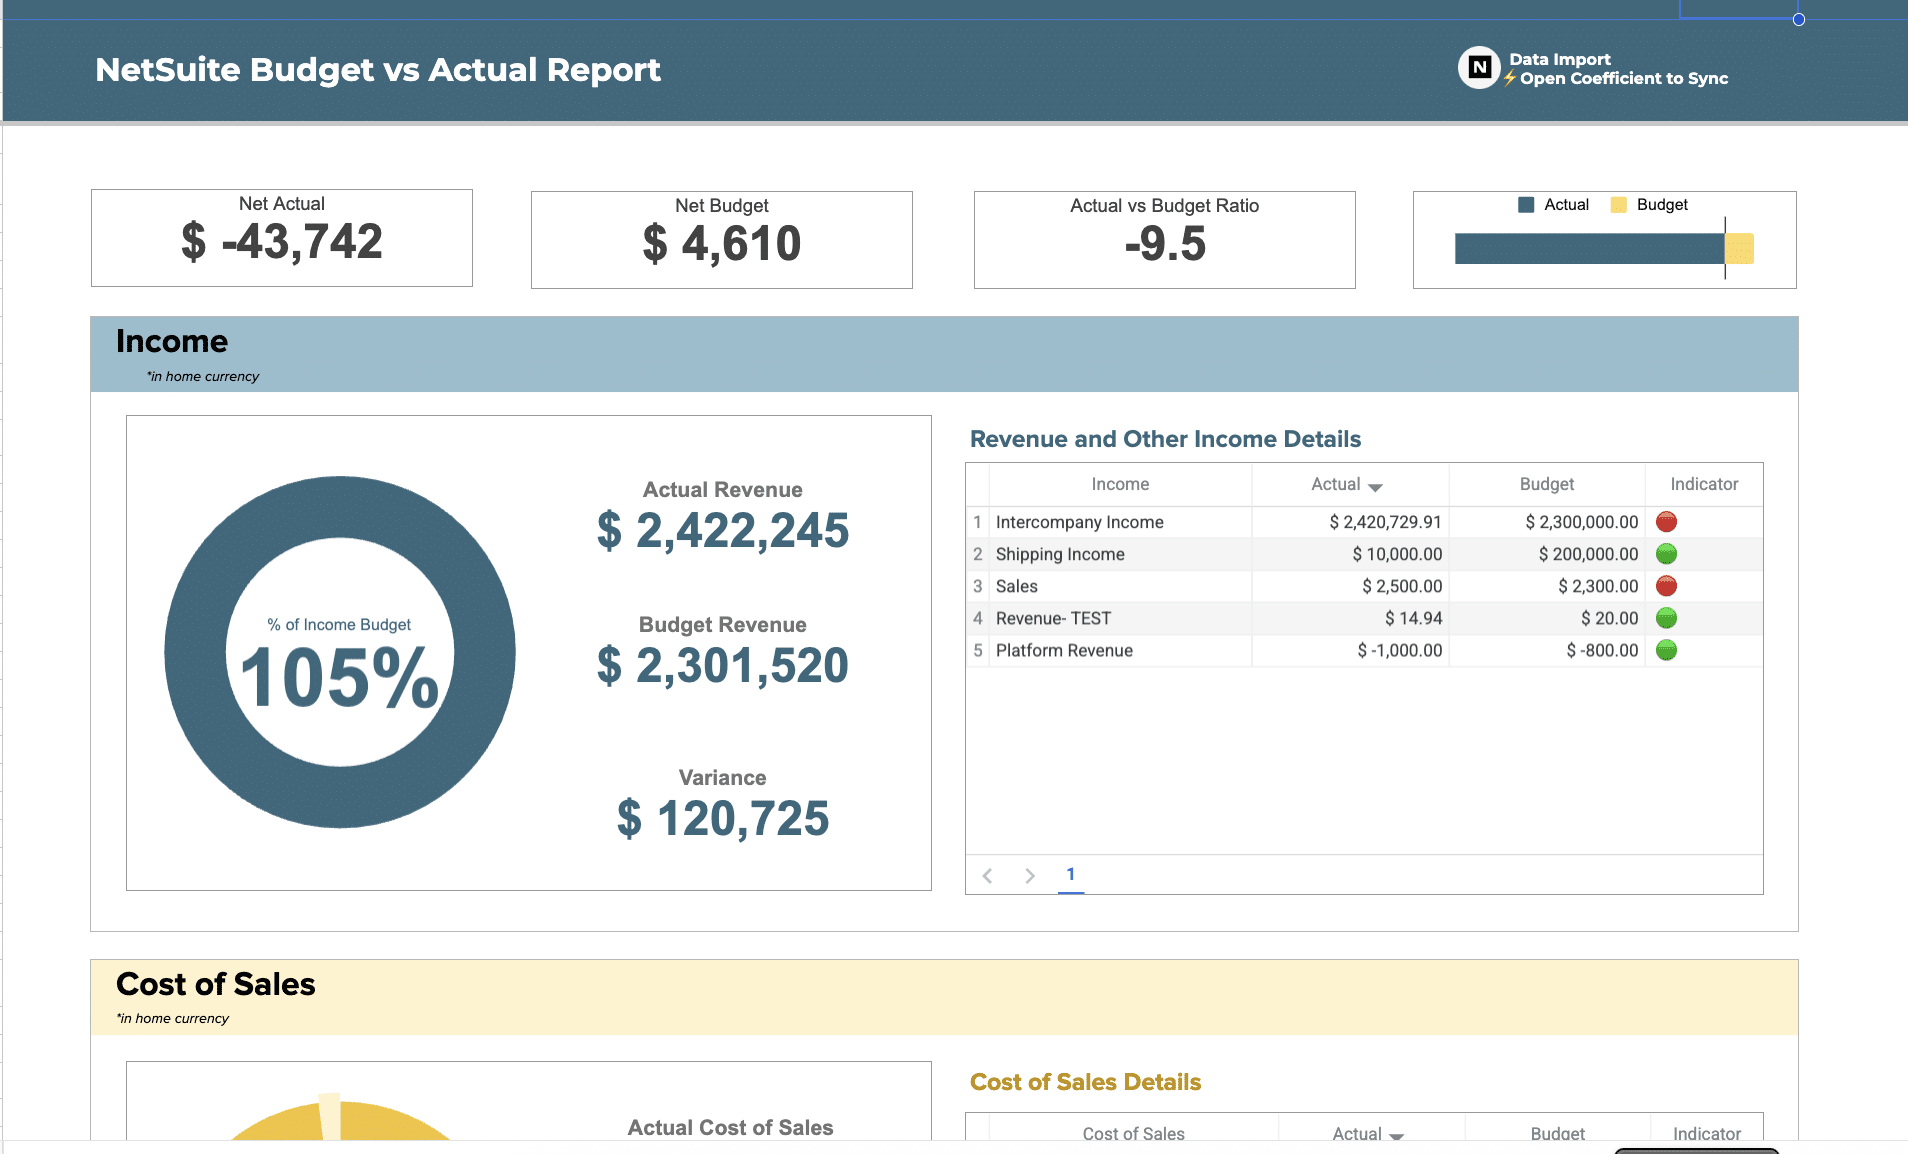
#1 Native NetSuite budget reporting
NetSuite’s Budget vs Actual report sits in Reports > Banking/Budgeting. The report shows standard financial sections with four core columns: Amount, Budget Amount, Amount Over Budget, and % of Budget.
Standard report components
The report breaks down into clear sections. Ordinary Income/Expense shows your revenue, cost of sales, and gross profit. The Expense section tracks all operating costs. Net Ordinary Income calculates automatically. Other Income and Expenses capture non-operating items. Net Income ties everything together.
You can filter by date range, subsidiaries, and departments. Classification segments let you analyze by custom dimensions. The report even handles statistical accounts, which helps track headcount budgets against actual staffing levels.
Customization through Financial Report Builder
Financial Report Builder adds serious power to NetSuite budget vs actual reports. You can reorder rows, add custom sections, and create formula-based calculations. The builder lets you group data by class, department, location, or subsidiary.
Dynamic criteria pull specific accounts based on type, name, or number. Custom formula rows calculate variances that matter to your business. You might create a row that shows variance only when it exceeds 10%, or build a section that consolidates multiple departments into one view.
Technical note: Set your Report by Period preference to “All Reports” or “Financials Only” in Analytics preferences. If budget columns show zeros, check this setting first.
Drill-down capabilities
Click any account name to view General Ledger details. The drill-down shows individual transactions that make up the account balance. This helps you investigate specific variances without exporting data or building separate reports.
One quirk to know: the GL Balance column may differ from the Budget vs Actual Amount column. The Amount shows the account balance for your selected period only. The Balance column shows the running balance including prior periods. Keep this in mind when reconciling numbers.
Variance calculations
NetSuite calculates variance as Actual minus Budget. Percentage variance uses the formula (Variance / Budget) × 100. You can see and edit these formulas in Financial Report Builder.
Add custom variance thresholds if you need alerts for specific materiality levels. Some teams set flags for variances over $10,000 or 10%, whichever is less. Others use different thresholds by account type, expense variances get 5% while revenue variances get 2%.
Presentation limitations
Native NetSuite reports work for standard financial statements. They fall short for executive presentations. You get static formats with limited visualization options. Charts and dashboards require manual exports and separate tools. Trending analysis means running multiple reports and comparing them manually.
You can’t schedule automated distribution within NetSuite. Someone needs to pull the report, format it, and send it out. For monthly board packages or executive dashboards, this manual process adds hours to your reporting cycle.
Christian Budnik, FP&A Analyst at Solv, spent hours on this exact workflow: “Before Coefficient, I was doing multiple data pulls a day. If you just add up those hours, week over week, month over month, it’s a huge time sink. It also disrupts your flow while analyzing data.”
#2 Excel-based budget analysis with live data
Excel handles complex variance analysis better than NetSuite’s native reports. You get advanced formulas, custom visualizations, and the flexibility to build exactly what executives need to see. The challenge has always been getting current NetSuite data into Excel without manual exports.
Coefficient solves this. Connect Excel or Google Sheets directly to NetSuite, and your budget vs actual reports refresh on their own. No CSV exports. No copy-paste errors. No stale data.
Automated data refresh
Set up a Coefficient connection once, and your reports update on schedule. Pull budget data from NetSuite’s Planning module and actual amounts from your Income Statement or Trial Balance. The data refreshes hourly, daily, or weekly based on your needs.
This changes how finance teams work. Instead of spending time exporting and formatting each report, you open a spreadsheet that’s already current.
Christian Budnik, FP&A Analyst at Solv, experienced this firsthand: “Before Coefficient, I was doing multiple data pulls a day. If you just add up those hours, week over week, month over month, it’s a huge time sink. It also disrupts your flow while analyzing data.”
After implementing Coefficient, Solv’s FP&A team saved 364 hours per year—one hour per week per analyst across their seven-person team. That time shifted from manual data work to actual analysis.
Start with the NetSuite budget template to see how Coefficient’s live data connections work. The template includes pre-built formulas for variance calculations and conditional formatting that highlights exceptions.
Advanced variance formulas
Basic variance is just Actual minus Budget. But finance teams need more depth. Here are the formulas that matter for NetSuite budget vs actual reporting:
Formula | Calculation |
|---|---|
Budget Variance | Actual Amount – Budgeted Amount |
Budget Variance % | [(Actual – Budget) / Budget] × 100 |
Utilization Rate | (Actual Spend / Allocated Budget) × 100 |
Burn Rate | Total Spend / Days Elapsed |
Projected End Spend | Current Spend + (Burn Rate × Days Remaining) |
Budget Health Score | Remaining Budget / (Burn Rate × Days Remaining) |
These formulas work directly in Excel with live NetSuite data from Coefficient. Build them once, and they calculate on their own as data refreshes.
Variance interpretation guide
Variances need context. A 5% variance on a $10 million budget differs from 5% on a $50,000 department budget. Use thresholds to focus attention on material differences:
Variance Range | Interpretation | Action Required |
|---|---|---|
-2% to +2% | On Track | Monitor monthly trends |
-5% to -2% or +2% to +5% | Watch Zone | Review transaction details |
-10% to -5% or +5% to +10% | Action Required | Conduct root cause analysis |
Below -10% or Above +10% | Critical | Emergency review meeting |
Set these ranges based on your organization’s materiality thresholds. Some businesses use dollar amounts instead of percentages. Others vary thresholds by account type—tighter ranges for controllable expenses, wider ranges for variable costs like revenue or materials.
Trend analysis capabilities
Excel lets you track variance patterns over time. Month-over-month trending shows if a department consistently overspends or if a variance was a one-time event. Year-over-year comparisons reveal seasonal patterns in your budget vs actual performance.
Rolling 12-month analysis smooths out monthly fluctuations. You can build pacing curves that compare actual spending against planned spend rates. This shows if you’re burning through budget faster or slower than intended.
The real value comes from asking why variances happen. Did sales miss targets? Did a vendor raise prices? Was timing off because an invoice hit the wrong period? Coefficient’s live data connections let you drill into these questions right away instead of waiting for month-end exports.
Executive reporting features
Board presentations need clean visualizations. Executives want to see trends, not raw numbers. Excel-based NetSuite budget vs actual reporting with Coefficient delivers both.
Build multi-level dashboards that let executives drill from high-level summaries into detailed variances:
- Level 1: Portfolio View — Total budget vs spend across the entire organization
- Level 2: Department View — Individual department budgets with variance percentages
- Level 3: Account Detail — Line-item variance with transaction-level backup
Conditional formatting highlights problem areas on its own. Green for favorable variances, yellow for watch zones, red for critical variances. Add sparklines to show trending at a glance.
Intelligent alerts
Coefficient lets you set up notifications when variances cross thresholds. Get Slack or email alerts when a department hits 75% budget utilization, or when variance exceeds 10%. This shifts financial management from reactive to proactive.
Progressive alerts work well for budget monitoring:
- 50% utilization — Notify department manager
- 75% utilization — Notify director
- 90% utilization — Notify VP
- 95% utilization — Notify CFO
Early warnings prevent budget overruns. Christian Budnik described the shift: “Coefficient automated everything. Instead of manually exporting or importing into Google Sheets every day, and making sure none of the formulas broke, I can just sit back and watch the data update automatically. That means I don’t have to rebuild dashboards before I share them.”
Common budget reporting challenges
Manual data export bottlenecks
Finance teams export CSV files from NetSuite, then copy-paste into Excel or Google Sheets. The data goes stale immediately. Any analysis you do reflects NetSuite as it was when you pulled the export, not as it is right now.
Version control becomes a nightmare. Someone makes a change to the budget model while you’re analyzing last month’s actuals. Now you need to re-export and start over. Multiple analysts working on different reports means multiple exports, multiple versions, and confusion about which numbers are current.
Copy-paste errors break formulas. Delete a column accidentally, and every variance calculation downstream shows #REF. These errors hide in large workbooks until someone presents wrong numbers to leadership.
Inconsistent variance definitions
Marketing calculates budget variance as (Actual – Budget). Operations uses (Budget – Actual). Finance reports percentage variance, but doesn’t specify if it’s (Variance / Budget) or (Variance / Actual). Sales calls anything within 5% “on target” while Engineering flags 2% variances for investigation.
Without standardized formulas and thresholds, budget variance analysis creates confusion instead of clarity. Department heads argue about whether a variance is favorable or unfavorable. Controllers spend time reconciling why the same underlying data produces different variance reports across teams.
Limited real-time visibility
Static reports show month-end numbers two weeks after the month closes. By the time leadership sees a budget variance, the next month is half over. You can’t course-correct on spending that already happened weeks ago.
Quarterly board meetings use data that’s 30-45 days old by presentation time. Strategic decisions get made on lagging indicators instead of current reality. Mid-market finance teams spend 20+ hours per week on manual reporting, and the outputs still arrive too late to drive proactive management.
Presentation and distribution issues
NetSuite budget vs actual reports work fine for accountants. They don’t work for executive presentations. You need to export, reformat, add charts, and build a narrative around the numbers. This manual work takes hours for monthly board packages.
Automated distribution doesn’t exist in native NetSuite reporting. Someone needs to remember to pull the report, format it, and email it to stakeholders. Miss the deadline, and people make decisions without current budget visibility. Set up automated refresh and distribution once using financial planning tools, and reports arrive on schedule without manual intervention.
Setup automated NetSuite budget vs actual reporting today
NetSuite budget vs actual reporting catches variances before they become problems. Native NetSuite reports handle basic tracking and standard financial statements. Excel-based analysis with live data connections adds the flexibility, automation, and visualization that executive teams need.
Manual CSV exports waste hours and produce stale data. Automated connections keep your budget vs actual reports current without manual work. Advanced formulas calculate variance metrics that go beyond simple Actual minus Budget. Trend analysis shows patterns over time. Automated alerts notify you when spending approaches thresholds.
The setup takes minutes, not months. Connect Excel or Google Sheets to NetSuite once, build your variance formulas, and schedule automatic refreshes. Your NetSuite budget vs actual reports update on schedule, every schedule, without manual intervention.
Get started with automated NetSuite budget vs actual reporting. Connect your first data source free and see how live data transforms financial planning.