Looker dashboards give data teams a governed, reusable way to surface metrics across the organisation. Build a dashboard once with the right LookML model behind it, and every stakeholder gets the same numbers from the same source of truth.
This guide covers three ways to create Looker dashboards in 2026: user-defined dashboards in the UI, LookML dashboards with version control, and pulling Looker dashboard data into Google Sheets or Excel using Coefficient for teams that need the underlying data in a spreadsheet.
Enterprise Looker vs Looker Studio: Which Are You Using?
Before building anything, it is worth clarifying which product you are working with. Google operates two separate tools under the Looker name and the dashboard-building process is different in each.
| Product | What it is | Who builds dashboards | Price |
|---|---|---|---|
| Enterprise Looker | Full BI platform with LookML semantic layer, Explores, and governed dashboards | Data engineers and analytics engineers; business users consume | From ~$5,000/month platform + per-user fees |
| Looker Studio | Free self-service dashboard tool (formerly Google Data Studio) | Any user via drag-and-drop interface | Free (Pro from $9/user/month) |
This guide covers enterprise Looker. If you are looking to build dashboards in Looker Studio, the steps are different. Looker Studio uses a drag-and-drop canvas rather than LookML-defined Explores and requires no data engineering knowledge to get started.
Latest AI Dashboard Features in Looker
Three AI capabilities shipped in 2025 and 2026 change how teams build and interact with Looker dashboards.
Gemini-Powered Natural Language Querying
Gemini AI integration enables any user to ask questions in plain English against Looker’s LookML semantic layer. A business user can type ‘Show me revenue by region for Q1 2026 vs Q1 2025’ in a Looker dashboard without writing LookML or SQL, and receive an AI-generated visualisation. The answer is consistent with the governed LookML definition. Gemini queries the semantic model, not raw warehouse tables. This reduces the dependency on data engineers for ad-hoc dashboard questions. See Google Cloud documentation for current availability.
Visualization Assistant
The Visualization Assistant lets dashboard builders describe the chart they want in plain English and generates the visualisation automatically. Instead of navigating chart configuration menus, a builder types ‘bar chart showing top 10 customers by revenue this quarter’ and the Assistant creates it. This reduces dashboard build time for common visualisation patterns, particularly for analysts who know what they want to see but spend time on chart configuration.
Automated Slide Generator
Looker can now generate presentation-ready slide decks directly from any dashboard, with AI-written summaries of the key trends and insights. This removes the manual work of screenshotting dashboards and writing narrative context for business reviews or stakeholder presentations. The AI analyses the visualisations and generates coherent explanations of what the data shows.
How to Create Looker Dashboards: The 3 Methods
1. Building User-Defined Dashboards
You can create user-defined dashboards in the Looker UI, but before you can build one, you’ll need:
- A Manage Access, Edit access-level for the folder that will store the dashboard
- These Looker permissions: save_content and see_user_dashboards
- Access to the LookML models for the data in the dashboard
Create a Looker Dashboard from a Folder
Open your Looker account. Select the folder you want to store your dashboard in. Then follow these steps:
- Click New at the top right of your folder.
- Select Dashboard from the dropdown. The Create Dashboard window will pop up.
- Enter your dashboard’s name. Press the Create Dashboard button. Looker will create a blank dashboard.
- Add Tiles to your dashboard by selecting Edit Mode. You can enter Edit Mode by clicking the Edit Dashboard in the middle of the dashboard pane or from the dashboard menu.
Now you can start building and designing your dashboard.
Create a Looker Dashboard from a Look or an Explore
You can also create a Looker dashboard from a Look or an Explore:
- A Look is a saved visualization that business users can create.
- An Explore is the starting point for a query in Looker. Explores reference views and can contain joins to other views.
Follow these steps to create a dashboard from a Look or an Explore:
- Navigate to a Look or an Explore where you want to create your dashboard. Click Save in the settings (gear icon) menu.
- Select As a new dashboard from the sub-menu. You’ll see the Save as a new Dashboard window appear.
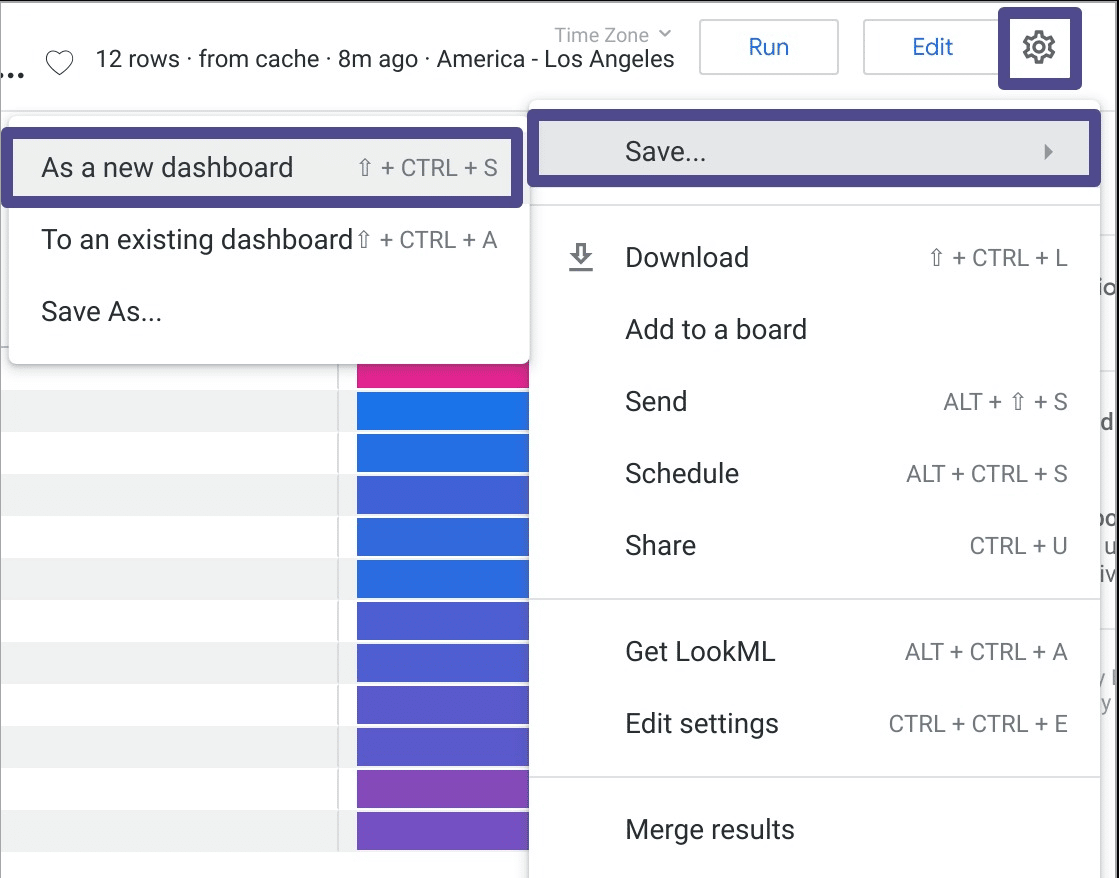
- Type your new dashboard’s name into the Settings tab’s Title field. The name will apply to the tile and the dashboard, which you can change at any time.
- You can edit the dashboard’s name by entering Edit Mode on the dashboard.
- Choose the folder where you want your dashboard to be saved.
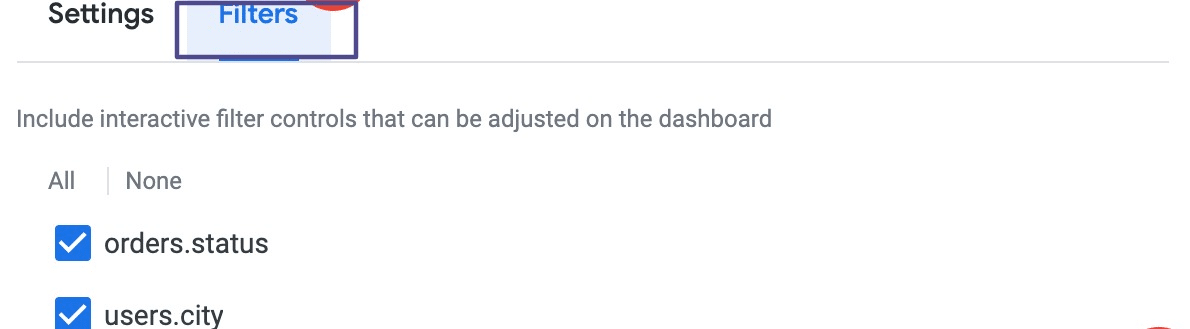
- Select the Look or Explorer filters you want to apply as dashboard filters under the Filters tab. Custom filters cannot operate as dashboard filters, but they can still function as Tile filters.
- Click Save when you’re done.
- You’ll see the dashboard in your Add to a Dashboard window. From there, select your new dashboard and add it as a Query tile.
That’s how you create your Looker dashboard from an Explore or Look.
Adding tiles and text to your Looker dashboard
Looker supports three types of dashboard tiles:
| Tile type | What it does | When to use it |
|---|---|---|
| Query tile | Independent query linked to the dashboard. Changes to the underlying Look or Explore do not affect it. | When you need a standalone visualisation specific to that dashboard. |
| Look-linked tile | Query linked to a saved Look. Updates to the Look automatically update every dashboard using it. | When the same chart appears across multiple dashboards and should stay consistent. |
| Text tile | Static descriptive text using markdown syntax. | Section headers, contextual explanations, dashboard descriptions. |
To add a Query tile: in Edit Mode, click Add at the top left and select Visualization. Choose your Explore from the menu, configure the fields, filters and visualisation, click Run, then save the query as a tile. Resize and position tiles by dragging them in Edit Mode. The first tile fills the full dashboard width. Additional tiles take up to one-third width and arrange horizontally.
Creating query tiles within your dashboard
- Navigate to Edit Mode to build a query tile within the dashboard
- Click Add on the top left button and select Visualization. Or click the Add button in the middle of the dashboard pane.
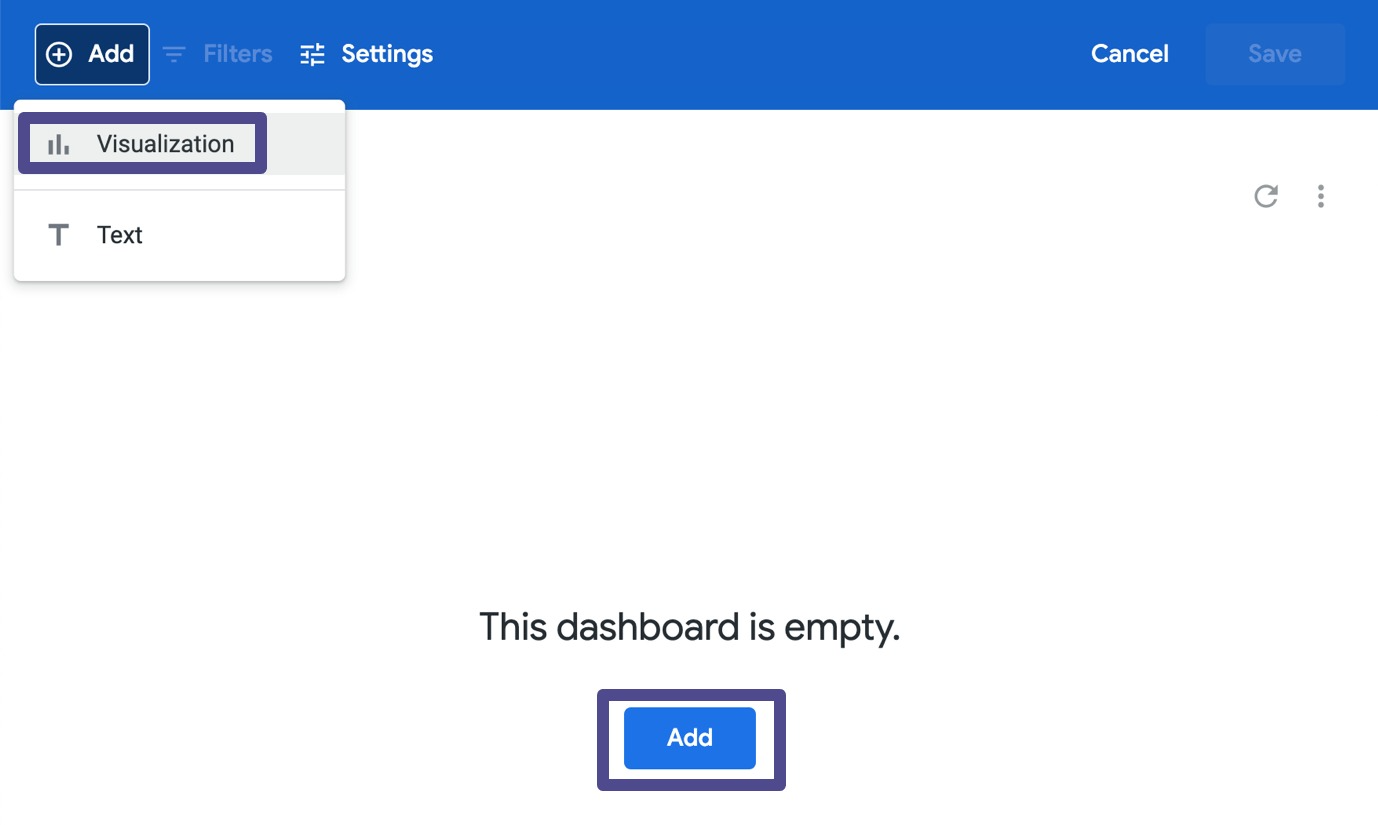
- You should see an Explore menu. Click on the menu and choose how you want to configure your query. Here’s an overview of some of the corresponding options:
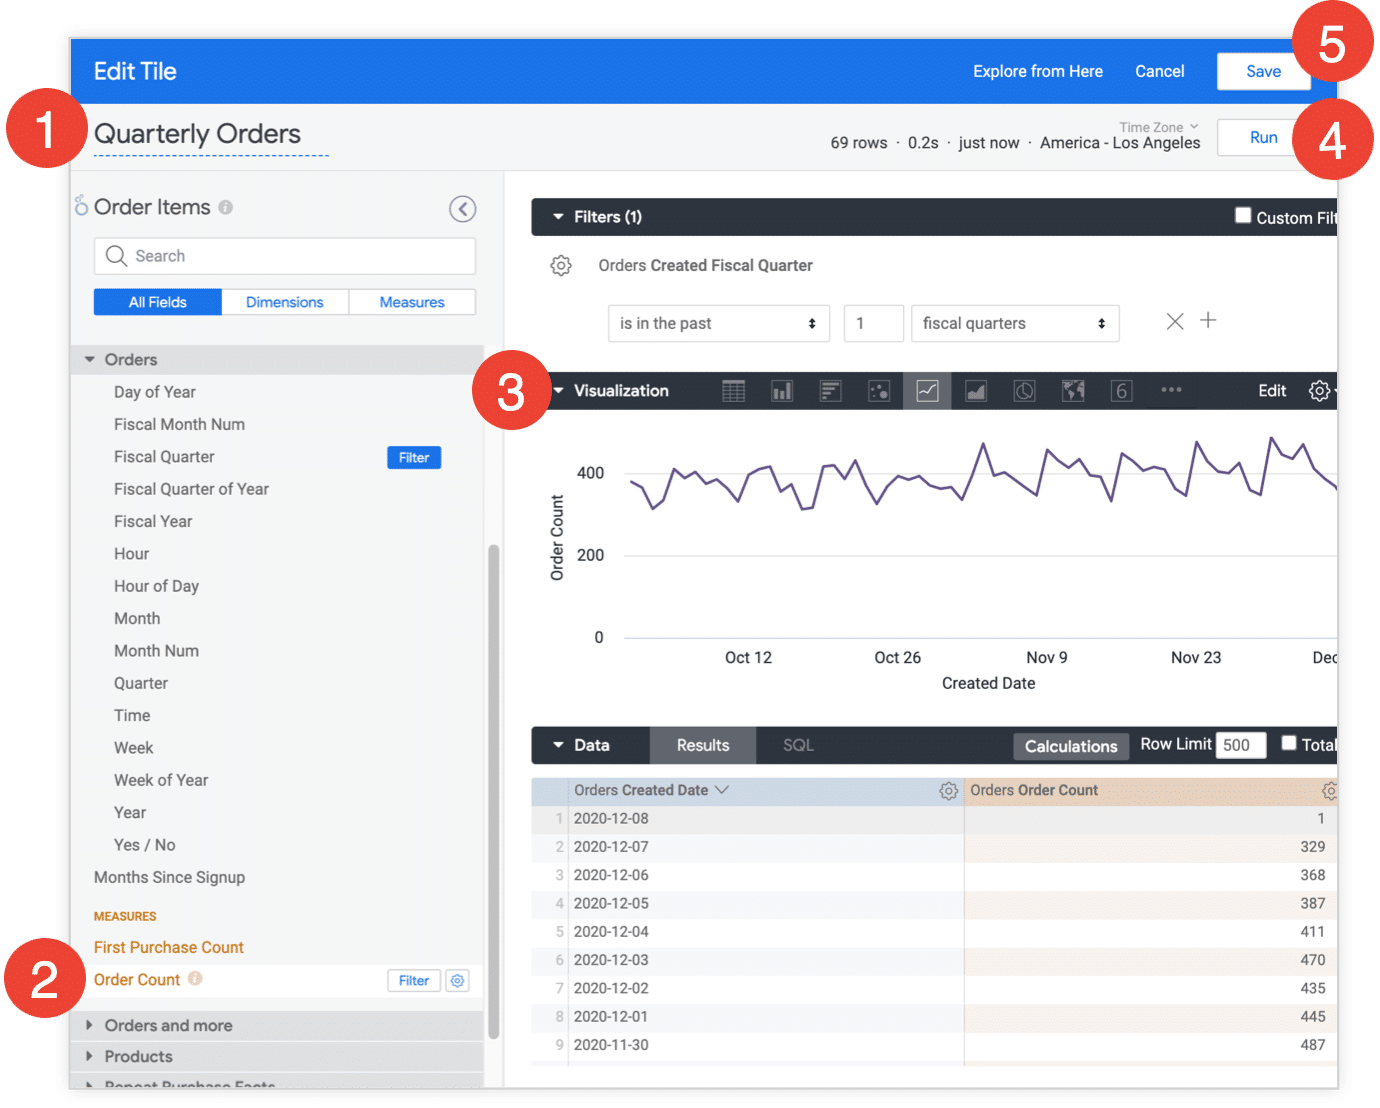
- Name your query (the tile’s name on the dashboard).
- Choose your query’s fields and filters.
- Set up your Visualization options.
- Click Run after setting up your query.
- Then save the query as a tile within your dashboard.
Adding query tiles from a Look
- Go to an Explore or a Look and click Save from the settings menu at the top right of the interface.
- On the displayed sub-menu, click To an existing dashboard to open the Add to Dashboard window.
- Choose the folder where the dashboard is stored and select the dashboard. Then click Save to Dashboard.
- Click the dashboard’s title in the confirmation message to enter Edit Mode. You can start moving and resizing tiles accordingly from here.
- If the Look was made from the same Explore, the new tiles will automatically have the dashboard filter.
Adding Look-linked tiles from a Look
- If the Look and the dashboard are in the same folder, you can insert a Look-linked tile on the dashboard. If not, then move the Look and the dashboard into a single folder.
- Click To an existing dashboard on the sub-menu to open the Add to Dashboard window.
- Select the folder containing the dashboard and Look.
- Select the dashboard and click Add Look to Dashboard.
Adding query tiles from an Explore
- From an Explore, navigate to the query you want to add to a dashboard.
- Click the gear icon. Select Save from the dropdown menu. Then select To an existing dashboard on the sub-menu.
- On the Add to Dashboard window, enter your tile’s title and choose the folder where the dashboard is stored.
- Select the dashboard. Click the Save to Dashboard button.
- Click the dashboard’s title in the confirmation message to launch the dashboard in Edit Mode. From here, you can adjust the tiles as you like.
Adding text
- Once in Edit Mode, click the Add button. Select Text from the dropdown.
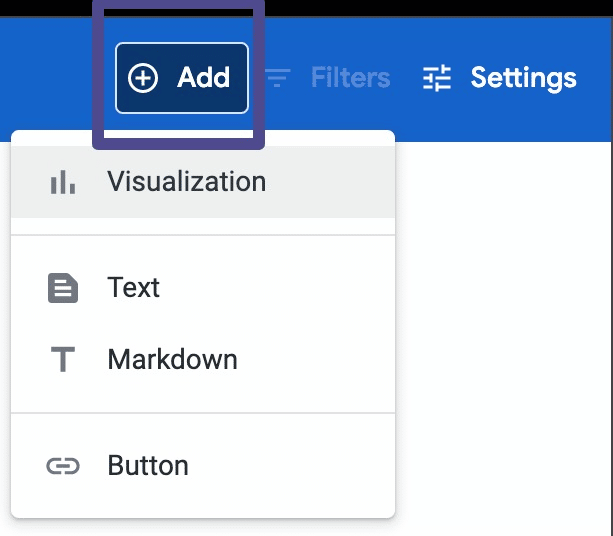
- Enter your title, subtitle, and body in the Add Text window. Titles, subtitles, and body text can support some HTML, including images and links. Additionally, body text supports markdown.
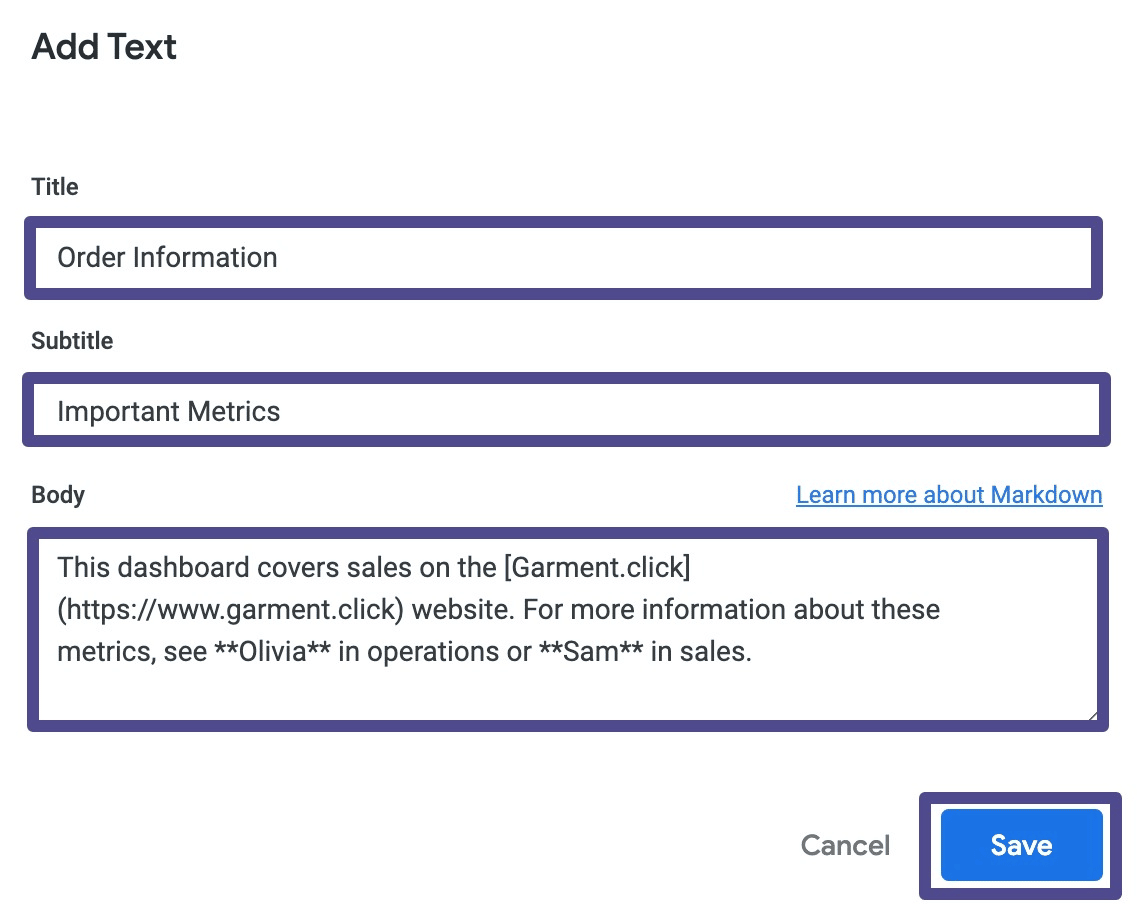
- Click Save and your text tile will appear at the bottom of the dashboard. Adjust and move the tile as you like.
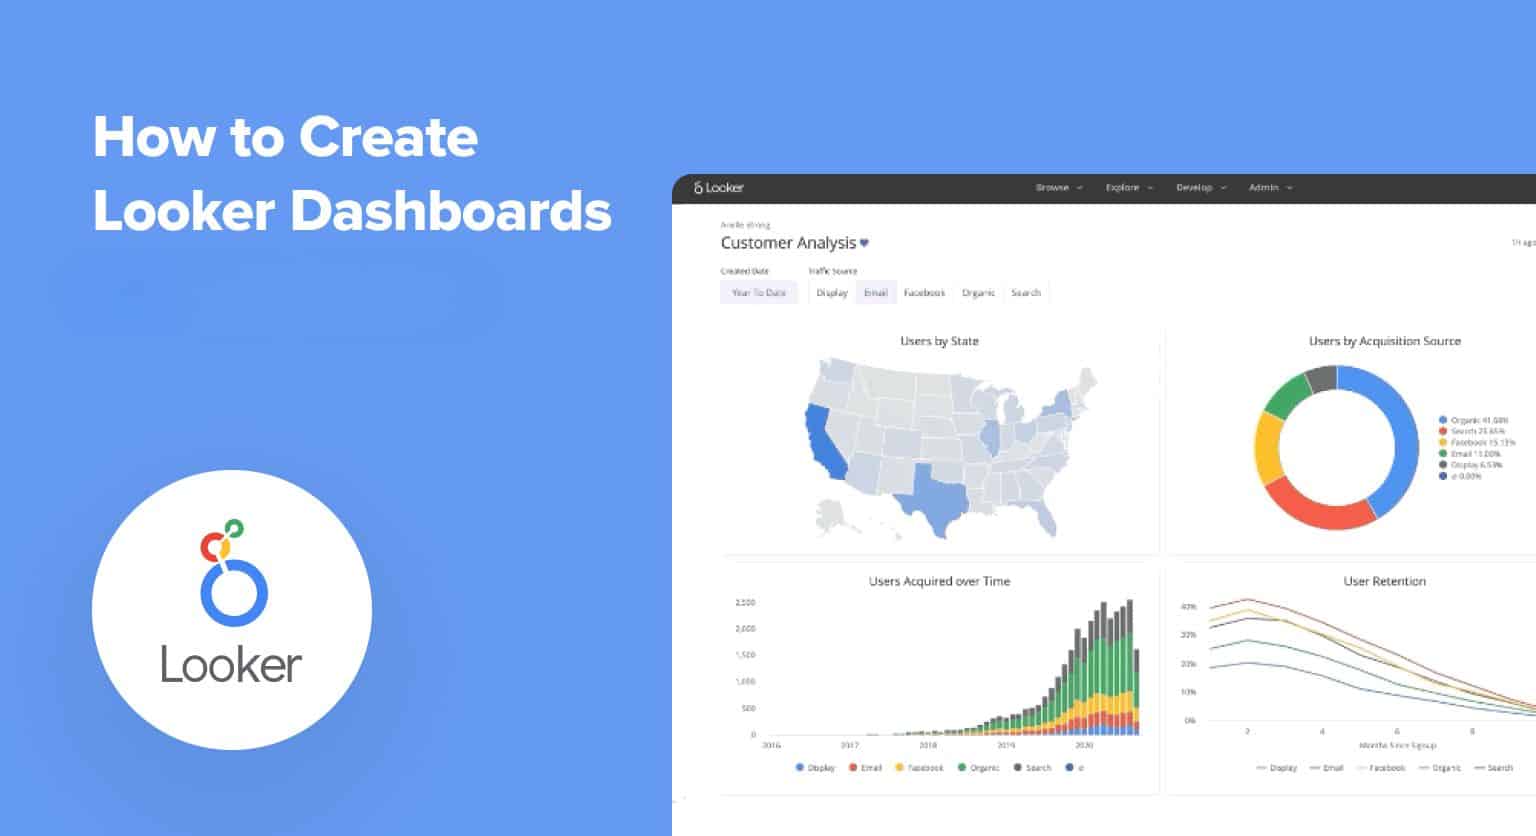
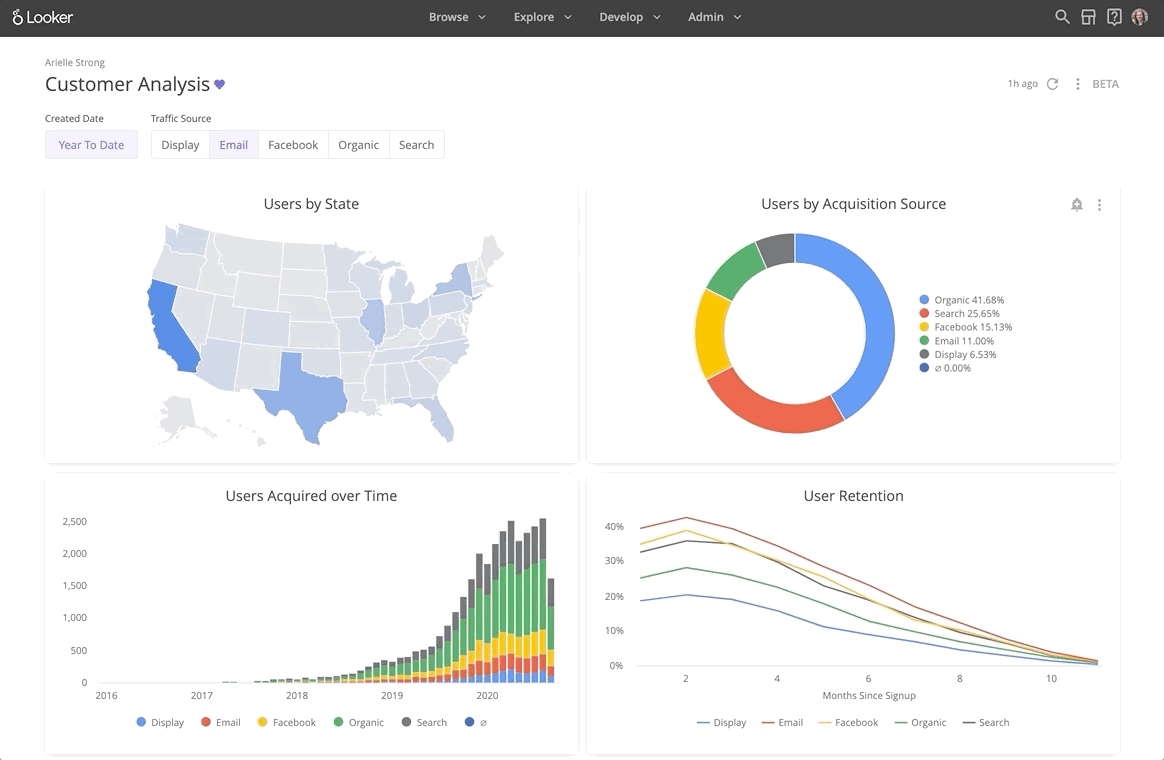
Final Product
After adding all your tiles and other elements, you’ll have a complete Looker dashboard, such as the Customer Analysis dashboard we built below.
Other steps in creating user-defined Looker dashboards that are not covered in this guide include:
- Adding buttons
- Adding data actions to the tiles
- Adding a dashboard description
- Configuring dashboard settings
Now you can use Looker’s cloud-based BI features to create real-time dashboards for insightful data analysis.
2. Creating LookML dashboards
You can also create LookML dashboards in Looker. LookML is a language for describing dimensions, aggregates, calculations, and data relationships in a SQL database.

Stop exporting data manually. Sync data from your business systems into Google Sheets or Excel with Coefficient and set it on a refresh schedule.
Get Started
A LookML project is a collection of model, view, and dashboard files that are typically version controlled together via a Git repository. Before creating a LookML dashboard, you’ll need:
- The access level (Manage Access, Edit) for the folder where you want to place your dashboard.
- The necessary Looker permissions to create LookML dashboards.
- Access to the LookML models for data you wish to use in the dashboard.
Once you’re done with the prerequisites, you can start building a LookML dashboard:
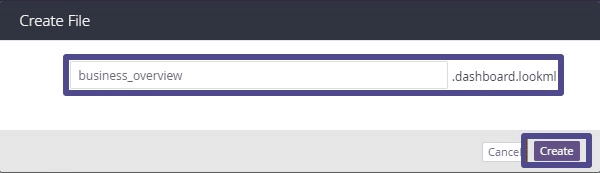
- Enable Development Mode in the Develop menu and go to your project.
- Click the plus (+) icon at the top of the file browser panel within the Looker IDE. You can also select the three-dot menu to make the file inside the folder, then click Create Dashboard.
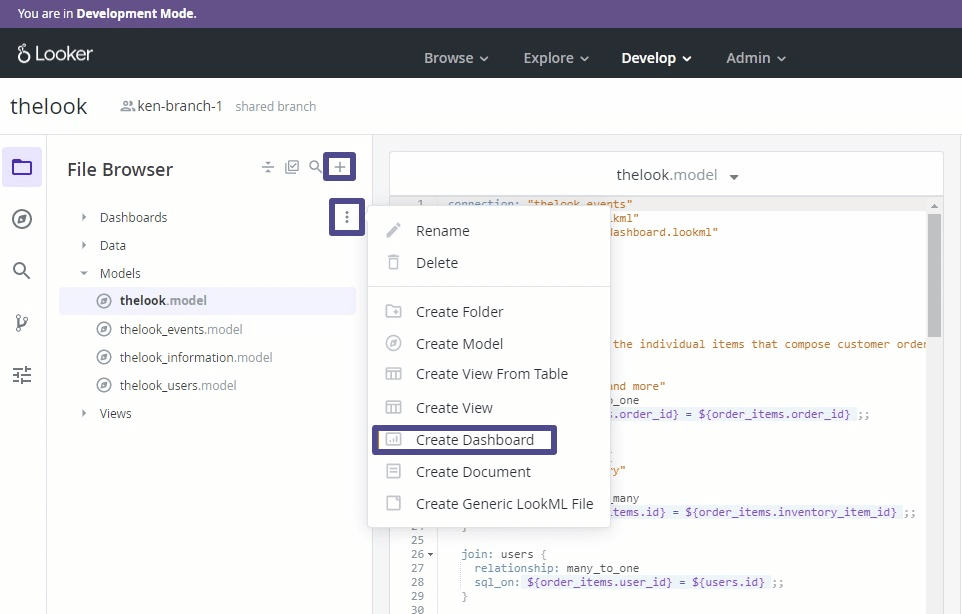
- Name your dashboard file and click Create. New LookML dashboard files automatically set the preferred_viewer dashboard parameter to dashboards-next to default to the new dashboard experience.
- Start creating your LookML dashboard from here. You can configure preferred_viewer to dashboards to render new LookML dashboards as legacy dashboards.
3. Connecting Looker Dashboard Data to Google Sheets
Looker dashboards surface governed, transformed BI data to the teams who access Looker directly. But many business users (finance managers, RevOps leads, sales ops) who do their analytical work in Google Sheets or Excel need access to the underlying data rather than a read-only dashboard view.
Coefficient connects Google Sheets and Excel directly to Looker, allowing business users to import data from Looker dashboards and Explores into their spreadsheets with auto-refresh. Once connected, the Looker data updates automatically on a set schedule, so spreadsheet-based reports stay current without manual exports.
To connect Looker to Google Sheets or Excel via Coefficient:
- Install Coefficient from the Google Workspace or Excel Marketplace. Launch it from the Extensions menu in Google Sheets or Excel.
- Select Import Data, then choose Looker as the data source.
- Enter your Looker instance URL and paste the Client ID and Client Secret from your Looker Admin panel (Admin > Users > Edit API Keys).
- A popup shows your available dashboard folder structure. Select the dashboard or Explore you want to import and click Import.
- Set an auto-refresh schedule (hourly, daily or weekly) to keep the data live.
| “The realization that my spreadsheet could directly connect to our BI tool and data warehouse was an absolute game-changer. It was like having my own instance in spreadsheets.” Coefficient customer |
Looker Dashboard Best Practices
Limit tiles per dashboard
Each tile runs an independent SQL query when the dashboard loads. More tiles mean more simultaneous queries against your data warehouse. Google Cloud’s performance guidance recommends limiting tiles, as each element consumes memory proportional to the data it returns. A dashboard with 20 tiles that all run simultaneously on load will be noticeably slower than one with 8 focused tiles.
Use caching and datagroups
Configure datagroups in your LookML model to sync dashboard caching with your ETL process. Rather than setting dashboards to query live on every load, datagroups trigger cache invalidation only when the underlying data has actually been updated. This reduces warehouse load and speeds up dashboard rendering for users who do not need sub-15-minute data freshness.
Filter early, at the LookML level
Push filters into the LookML model wherever possible rather than applying them as post-query dashboard filters. Table calculations, merged results and custom fields applied after the query all consume additional memory. If the same calculation appears across multiple dashboards, define it in LookML once as a dimension or measure so it executes in the database rather than in the browser.
Separate dashboards by audience
A dashboard built for a VP of Sales and one built for a sales rep should look different, even if they draw from the same underlying model. Executive dashboards should show 5 to 7 high-level KPIs with trend context. Operational dashboards can show more granular data with drill-down capability. Building one universal dashboard that tries to serve both audiences typically serves neither well.
Use required filters for large datasets
For dashboards querying large tables, set required filters at the dashboard level so users cannot run the dashboard without specifying at least a date range or another high-cardinality filter. Preventing open-ended queries on large datasets is the single most effective way to avoid timeout errors and slow load times.
Frequently Asked Questions
What is the difference between a Looker dashboard and a Looker Studio dashboard?
They are built on completely different products. A Looker dashboard (enterprise Looker) is built on top of a LookML semantic model by a data engineering team. Every metric is governed centrally. A Looker Studio dashboard is built by any user via a drag-and-drop canvas connected directly to data sources. Looker Studio is free; enterprise Looker starts at approximately $5,000/month platform fee.
What is a LookML dashboard vs a user-defined dashboard?
A user-defined dashboard is created in the Looker UI by any user with the right permissions. It is stored in a folder and is not version-controlled. A LookML dashboard is defined in a YAML-based file inside a Looker project and is version-controlled alongside the LookML codebase via Git. LookML dashboards are preferred for production dashboards that need change tracking and deployment pipelines. User-defined dashboards are better for exploratory or ad-hoc work.
Can you export a Looker dashboard to Google Sheets?
Yes, via Coefficient. Coefficient connects Google Sheets directly to Looker, allowing you to import data from Looker dashboards and Explores with scheduled auto-refresh. This is more reliable than manually downloading CSV exports and re-uploading them. The Looker data stays live in the spreadsheet without manual intervention.
Why are my Looker dashboards slow?
The most common causes are: too many tiles running simultaneously on load, queries returning large volumes of rows without filters, post-query processing features (merged results, table calculations, custom fields) consuming browser memory, and pivoted dimensions with high cardinality. Start by limiting tiles, adding required filters, and moving repeated calculations into the LookML model. Use datagroups to sync caching with your ETL cycle rather than querying live on every load.
Do you need to know LookML to build Looker dashboards?
For user-defined dashboards, you do not write LookML directly but you do need a data team to have already built the LookML models (Explores, views, dimensions, measures) that power your dashboard tiles. For LookML dashboards, yes. They are defined in YAML that references LookML model components. Business users typically build user-defined dashboards on top of models the data team has already created, rather than writing LookML themselves.
Can Looker dashboards be embedded in other applications?
Yes. Looker’s Embed edition supports white-labelled embedded analytics with SSO integration and API-controlled access. It is one of the strongest embedded analytics platforms in enterprise BI. This requires the Embed edition of Looker, which is custom-priced and typically costs six figures annually. See Looker’s embedding documentation for current capabilities.