What are add-ons for Google Sheets?
Google Sheets add-ons are third-party applications that boost the spreadsheet program’s functionality. Most add-ons are designed for specific uses, functions, and features, including data analysis and reporting. Essentially, the best Google Sheets add-ons can put your spreadsheet tasks on steroids. They can take your raw data and turn it into powerful tools for data analysis and reporting purposes and processes.Are Google Sheets add-ons free?
Google Sheets add-ons can be free or paid, depending on the service provider. Some developers offer free and premium versions of the add-ons, where you gain access to more (or advanced) features for a subscription fee. Some paid add-ons also include free trial periods ranging from three to 30 days.How to install and manage Google Sheets Add-ons
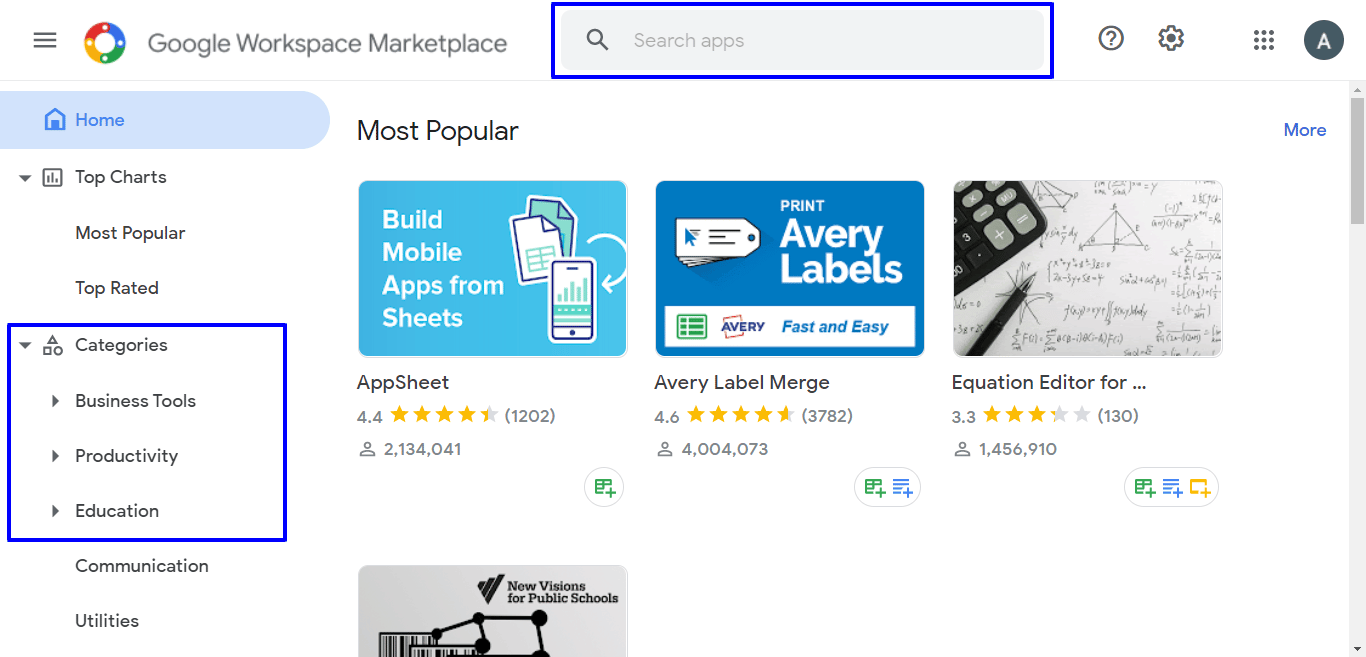
The steps below outline how you can download add-ons, how to find them in Google Sheets, and how to access the app management feature. Start by opening an existing (or new) Google spreadsheet. Navigate to Add-ons on the menu bar and click Get add-ons.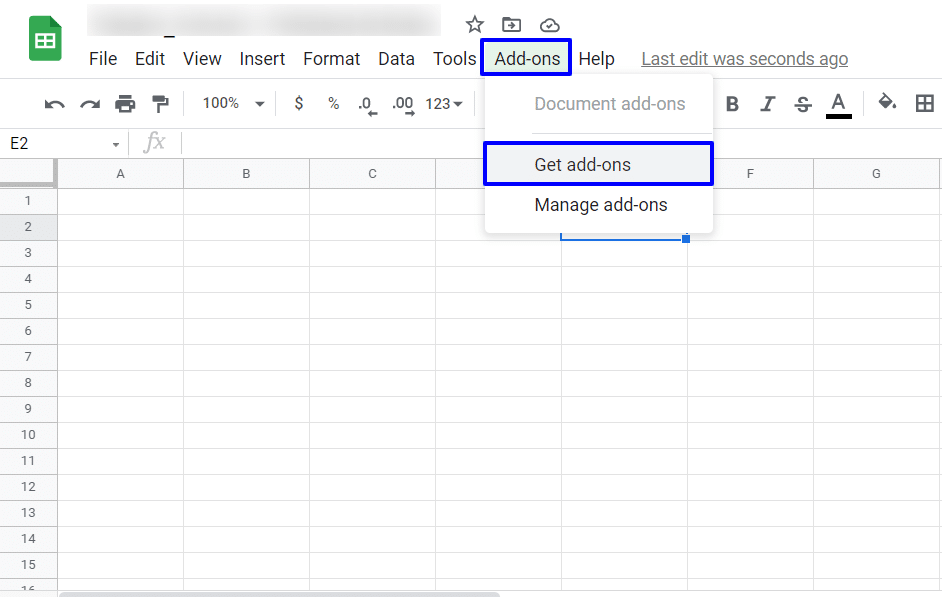
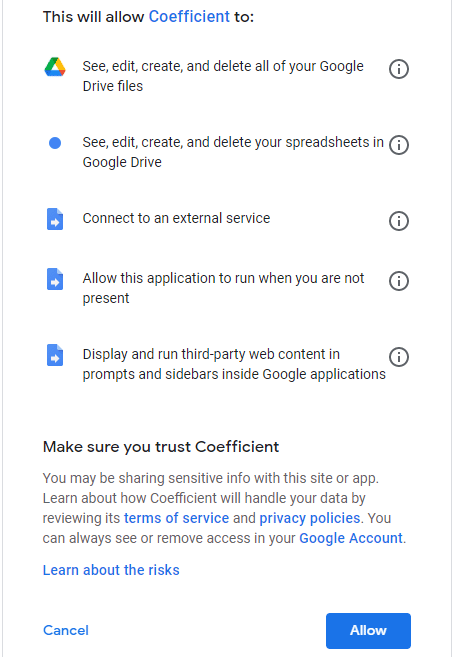
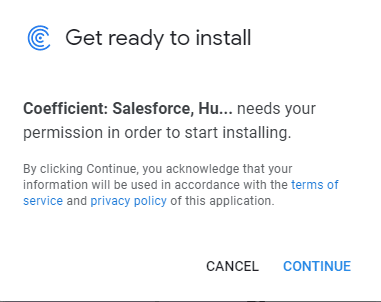 Choose the account you want to link with the app, and on the pop-up window, allow access.
 The app should automatically be installed in Google Sheets. You can access and launch the app on the Add-ons tab.
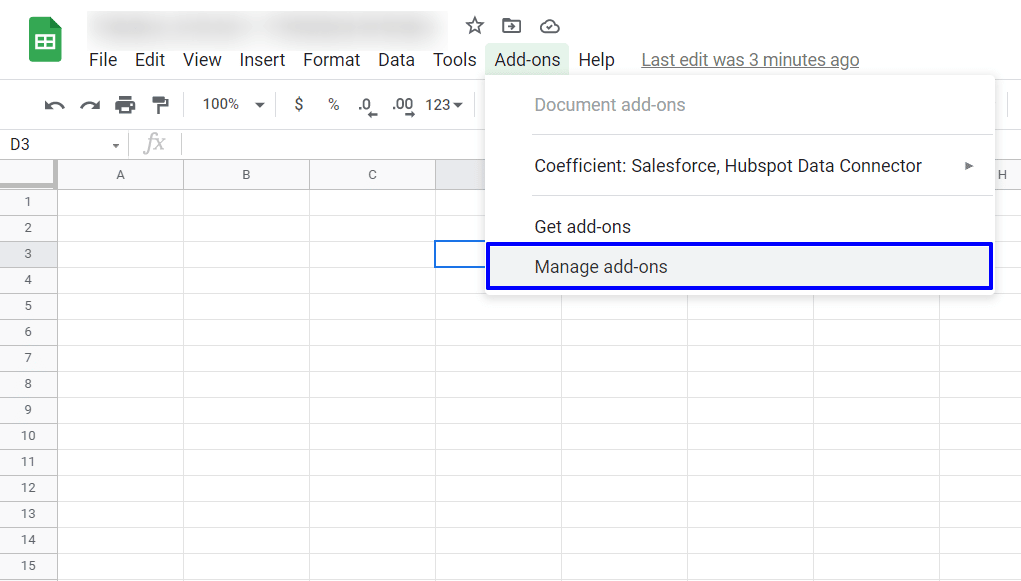
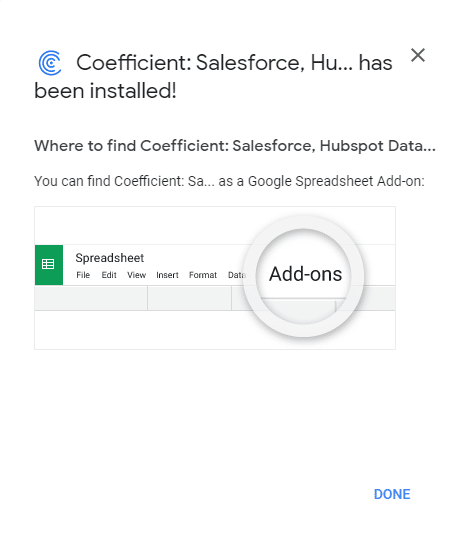 Click Manage add-ons from the dropdown to use it on the current spreadsheet or document, to get help, to report an issue, or to uninstall the add-on.
What are the best add-ons for Google Sheets?
Generally, the best Google Sheets add-ons depend on your needs and what you use them for. In this guide, we’ll go over the top apps for data analysis and reporting. Let’s start with our top five picks for Google Sheets add-ons with robust features for reporting.Google Sheets add-ons for reporting
1. Coefficient
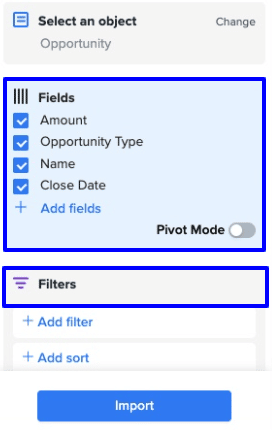
The Coefficient Salesforce, HubSpot Data Connector is a powerful no-code solution that lets you and your team work with real-time data directly from Google Sheets. The add-on lets you sync your spreadsheets to your systems, such as HubSpot, Salesforce, MySQL, Slack, data warehouses, and other data sources. You can import, export, and sync your datasets in a few clicks without object data mapping and other often complicated steps involved in traditional ways of fetching data. This helps you accomplish flexible, accurate, and real-time report creation and data analyses, even if you don’t have a lot of SQL knowledge or experience using advanced tools. For instance, if you want to pull data from your HubSpot account, you can click Import on the Coefficient window within Google Sheets, then select the data source.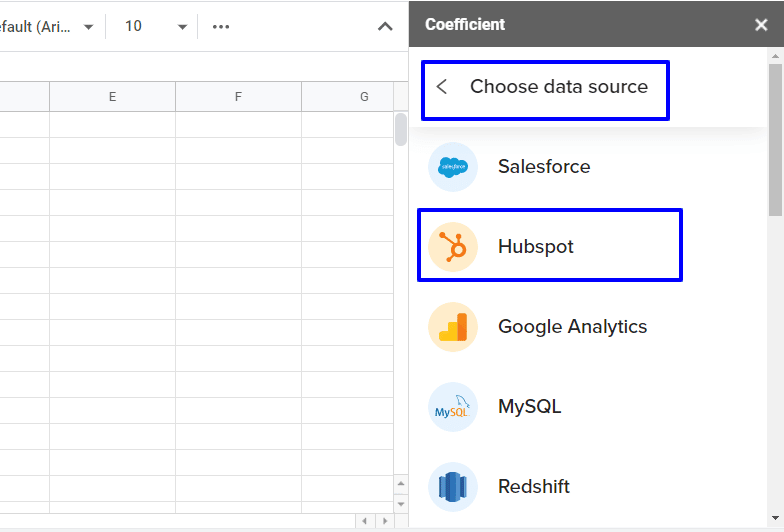
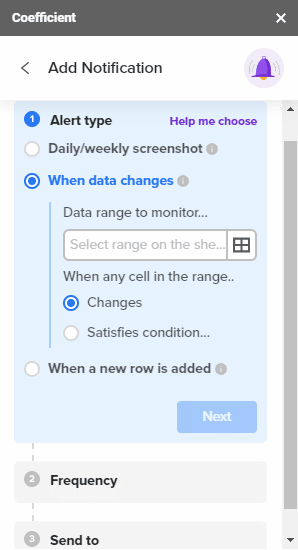
 Coefficient also offers native Slack integration with a business rule engine. It lets you set automated alerts or email notifications to keep everyone in the loop when your data gets updated.
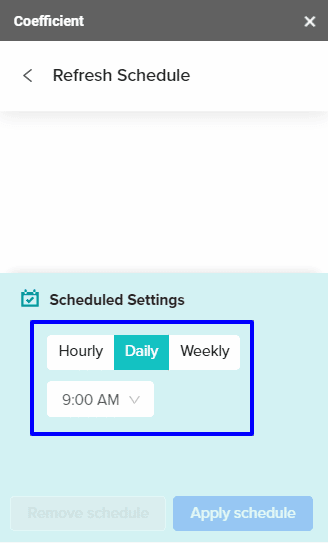
 The app’s auto-refresh feature lets you schedule automatic updates, so you and your team always work with live data. This means you won’t need to build the same reports twice or repeat the data importing process, saving you huge chunks of time and energy.
 Coefficient makes building your reports and even other add-ons (we’ll tackle these later) more powerful because it can get you all the data you need anytime in a few clicks and through automated updates.
2. ThoughtSpot for Google Sheets™
ThoughtSpot for Google Sheets™ helps you uncover insights hidden in your spreadsheet data and create powerful visualizations using simple, natural language search—no formulas, data modeling, or paid subscription required.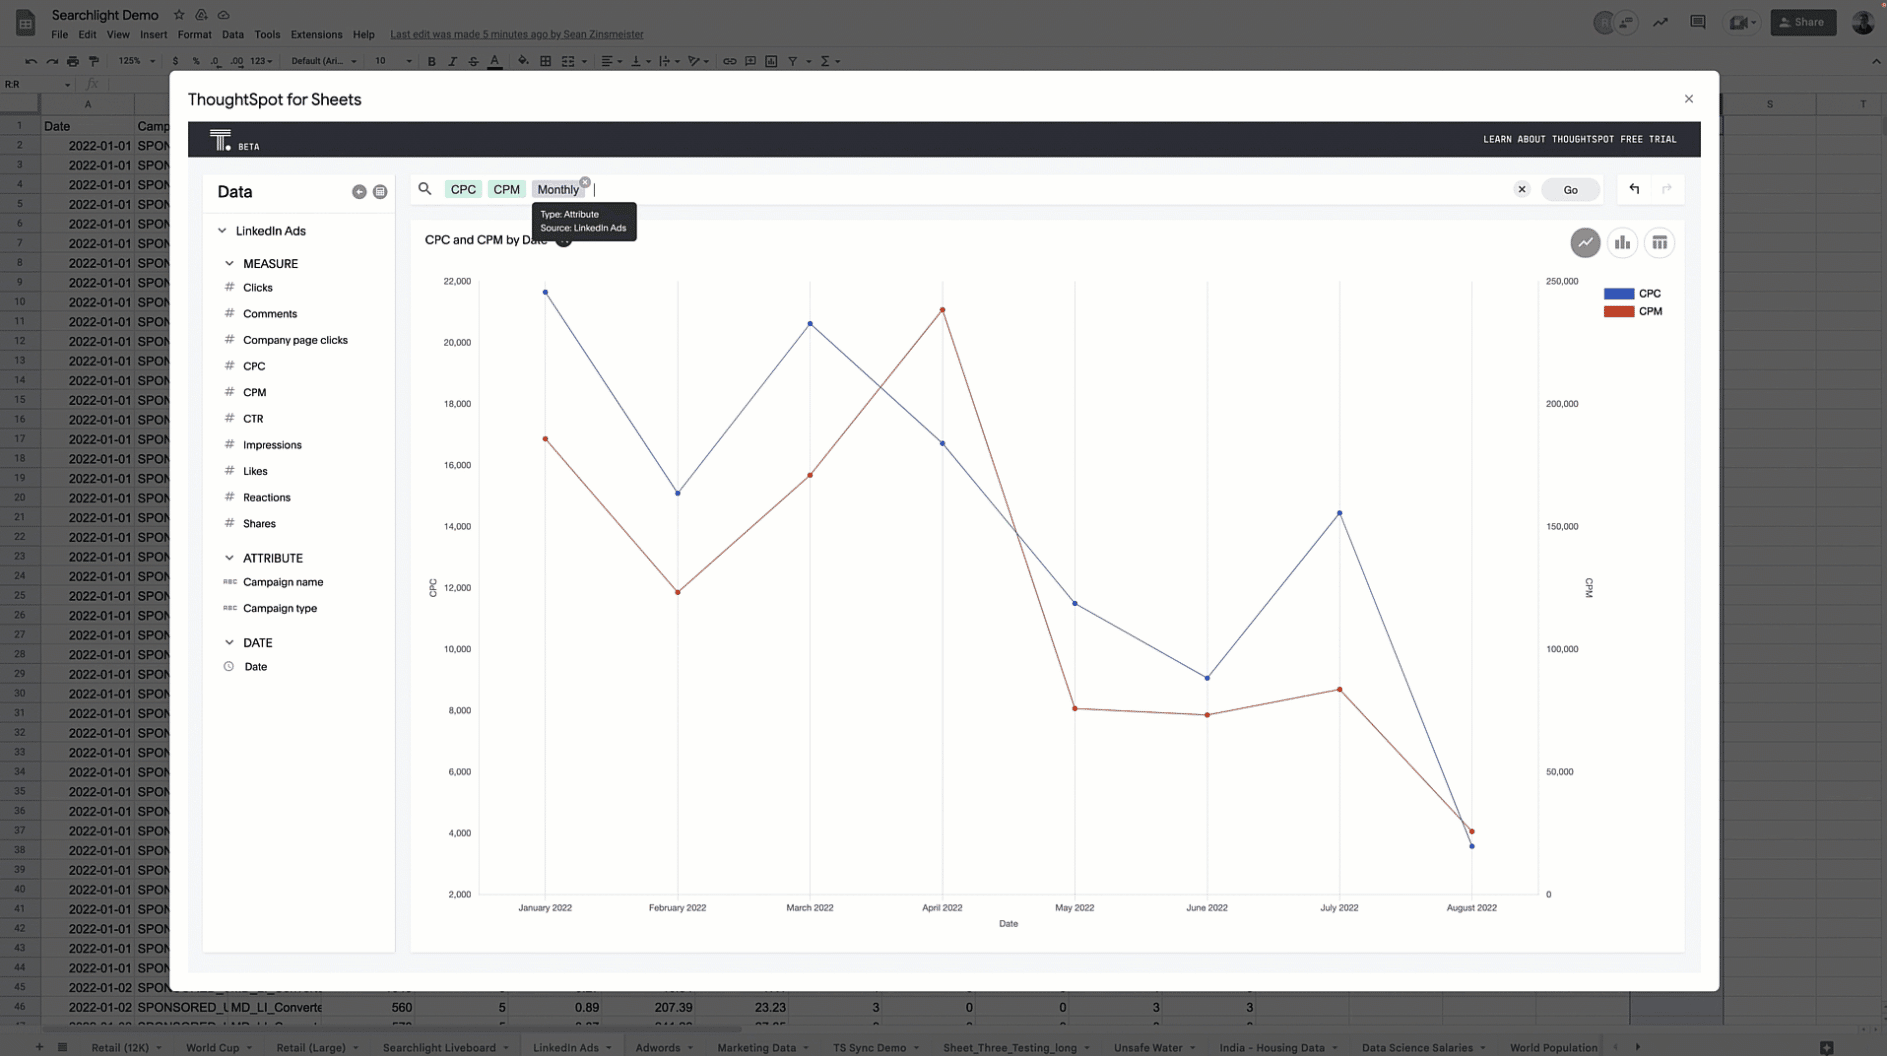 Setup is easy. After installing the app, navigate to the Sheet you want to explore, and launch the ThoughtSpot application from your extensions dropdown. ThoughtSpot for Google Sheets™ automatically categorizes your data (e.g. DATES, MEASURES, and ATTRIBUTES) and creates a user-friendly display that’s easy to search and drill into.
Start searching your data by typing phrases into the search bar like [top], [bottom], [daily], [weekly], or [last two weeks]. Not sure where to begin? You can click through suggested search terms in the column on the left-hand side of the screen.
Setup is easy. After installing the app, navigate to the Sheet you want to explore, and launch the ThoughtSpot application from your extensions dropdown. ThoughtSpot for Google Sheets™ automatically categorizes your data (e.g. DATES, MEASURES, and ATTRIBUTES) and creates a user-friendly display that’s easy to search and drill into.
Start searching your data by typing phrases into the search bar like [top], [bottom], [daily], [weekly], or [last two weeks]. Not sure where to begin? You can click through suggested search terms in the column on the left-hand side of the screen.
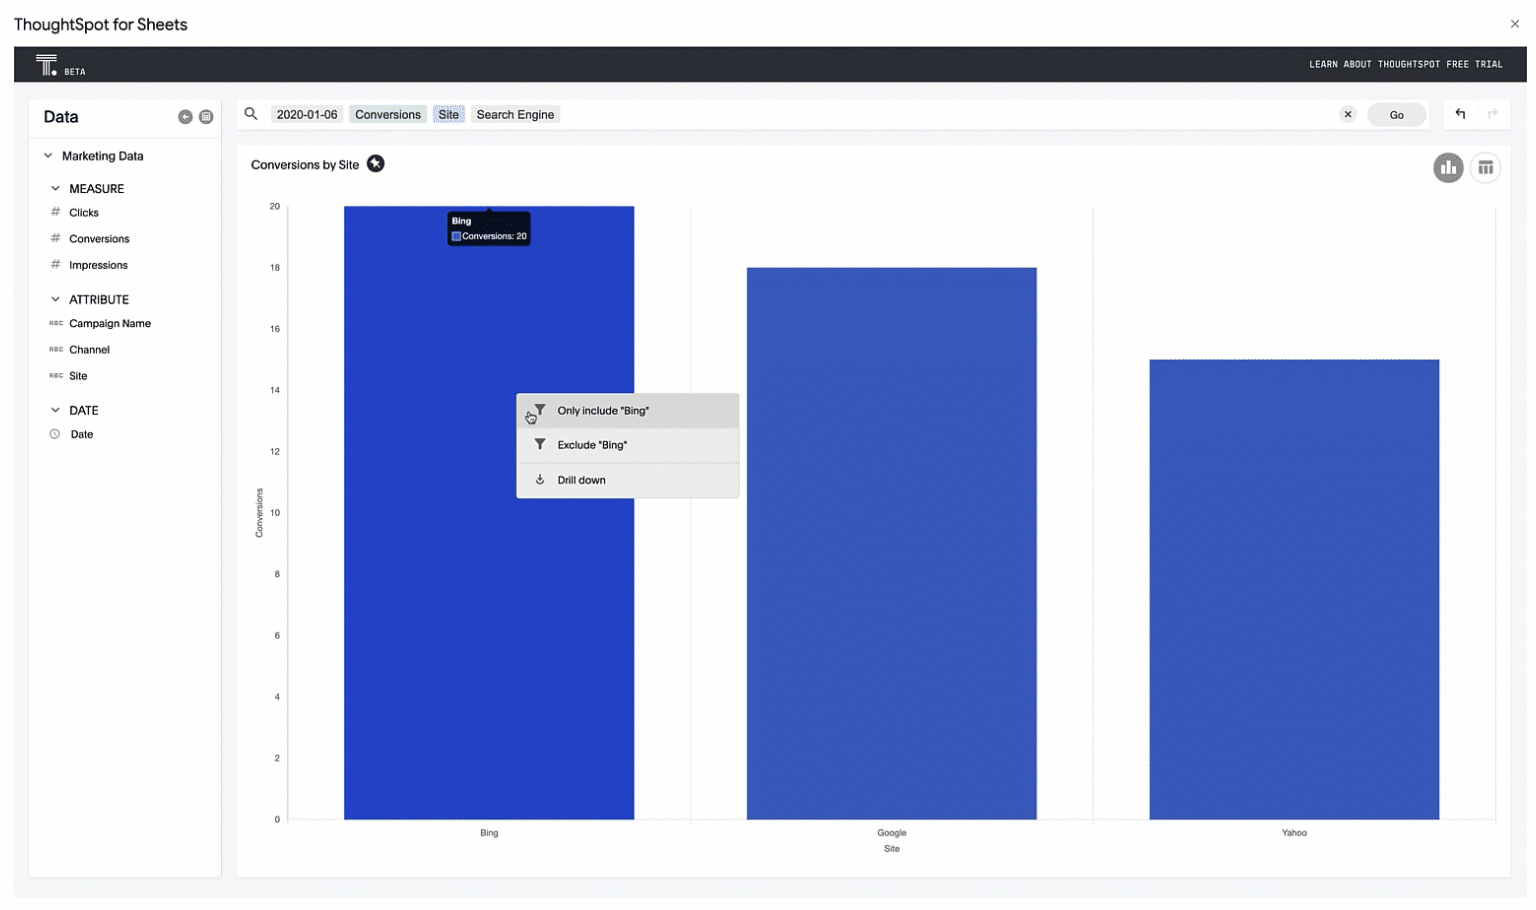 Say goodbye to VLOOKUPS. ThoughtSpot for Google Sheets™ makes it easy to find granular insights in any dataset. Simply right click on the point in your chart that you want to investigate, then select the data point you’d like to drill further into.
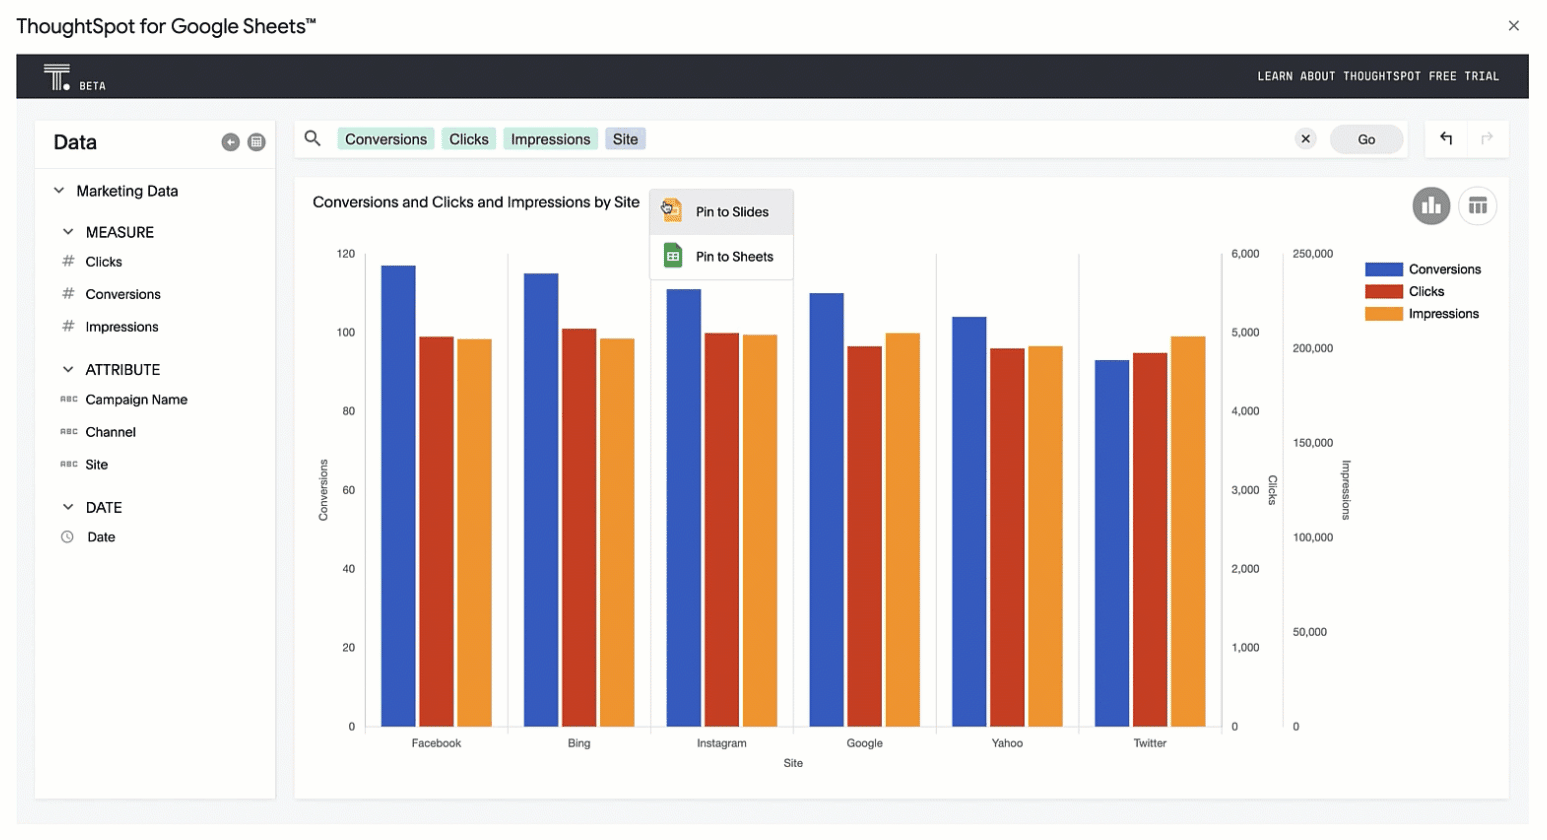 Share your insights. Once you have your visualization, you can easily Pin to Slides so you can share with clients, at important team meetings— all hands or board meeting, or while collaborating with team members.
2. Awesome Table
The Awesome Table Google Sheet add-on can turn your spreadsheet data into dynamic, sophisticated web formats and visualizations. It lets you display your data as maps, directories, charts, traditional tables on Google websites, and web platforms, such as Drupal and WordPress. You can transform your flat spreadsheets into filterable, dynamic, and searchable maps or catalogs from Google Sheets and Microsoft Excel using easy-to-use tools even with no coding experience. Create a visualization easily by choosing the Google spreadsheet or data source you want to display.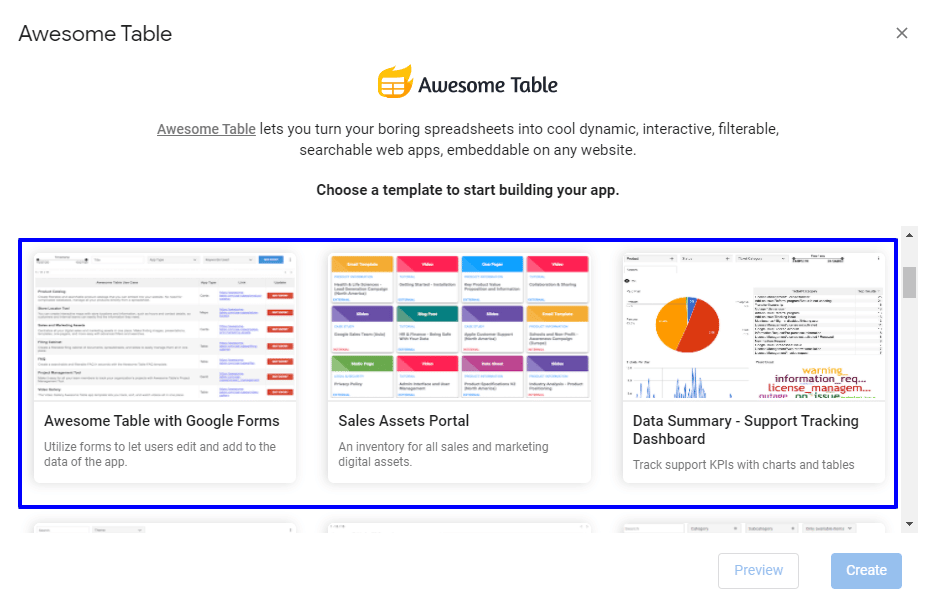
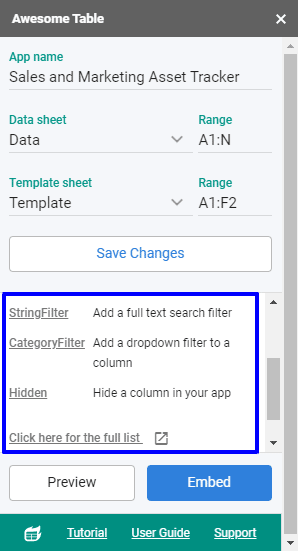 Customize your app’s appearance further by adding custom JavaScript, HTML, or CSS. Once you’re done, you can embed your visual on your website or the intranet.
You get digestible, shareable, and actionable spreadsheet data and reports you can easily share and display.
Customize your app’s appearance further by adding custom JavaScript, HTML, or CSS. Once you’re done, you can embed your visual on your website or the intranet.
You get digestible, shareable, and actionable spreadsheet data and reports you can easily share and display.
3. Document Studio
Document Studio helps you create customized certificates, documents, and reports automatically from your merged Google Sheets, Google Forms responses, and Excel files. This eliminates manually copying and pasting from your source documents to create sophisticated, professional-looking documents, such as customer invoices, sales pitches, event tickets, and other reports you generate regularly. Document Studio streamlines your document creation and sharing process, allowing you to generate your reports in a few clicks. Add your source data in Google Sheets, import it from a CSV or Excel file, or create a document from your new Google Forms submissions. Then, make your coeff-templates with markers in Google Documents, Google Sheets, or Google Slides.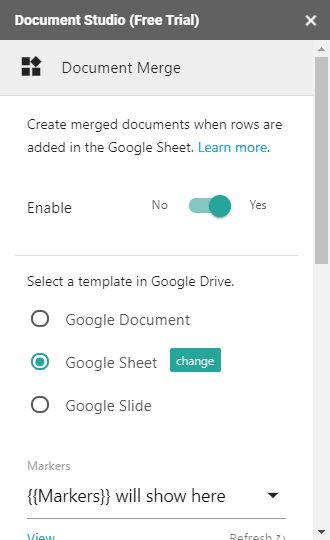 The app generates multiple documents, one in each row within the source sheet, and replaces template markers with your actual data.
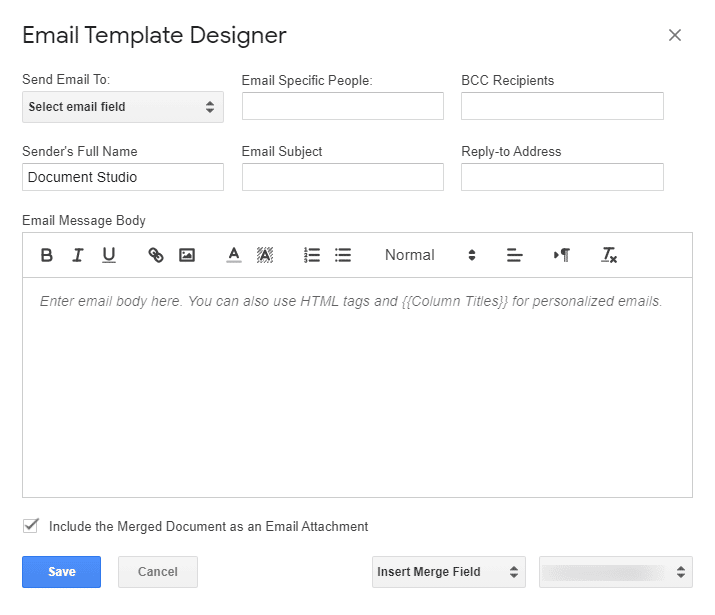
Document Studio also offers a Mail Merge feature that lets you send your generated documents and reports automatically. It’s What You See Is What You Get (WYSIWYG) email designer helps you personalize your emails and add your logo.
The app generates multiple documents, one in each row within the source sheet, and replaces template markers with your actual data.
Document Studio also offers a Mail Merge feature that lets you send your generated documents and reports automatically. It’s What You See Is What You Get (WYSIWYG) email designer helps you personalize your emails and add your logo.

4. Power Tools
Power Tools provides a set of more than 30 solutions for daily user tasks in Google Sheets. The app’s tools significantly cut down on repetitive actions. It enhances Google Sheets features by unifying and organizing your data, allowing efficient and seamless report generation. Some of Power Tool’s most notable features let you compare with VLOOKUP, remove duplicates, merge cells, generate numbers, count and sum colored cells, import ranges from multiple sheets, and other functions. The app also comes with text toolkit utilities to add and remove characters and strings, split texts into columns, change cases, and trim whitespaces. The app’s tools are categorized into ten groups according to their main function.- Dedupe and compare data
- Smart toolbar for one-click actions
- Work with text
- Merge and combine sheets
- Split toolset
- One-step tools to process data
- Convert data format
- Randomize
- Clear contents within Google Sheets by type
- Formula tools
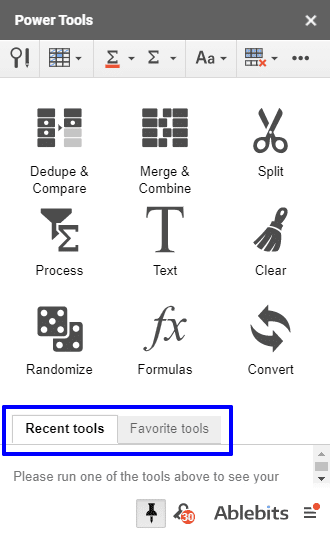
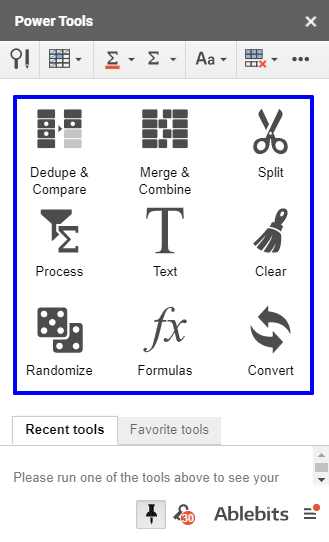 You can see a history of your recently used tools to apply operations to various ranges quickly. Add your regularly used tools to your Favorites for instant access.
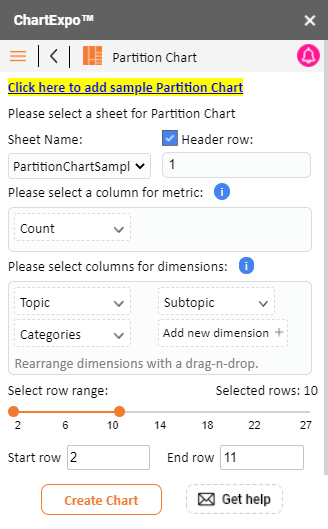
5. ChartExpo
ChartExpo™ is one of the best Google Sheets add-ons for data visualization. The app simplifies creating various visuals in Google Sheets, including flowcharts, network diagrams, survey graphs, comparison charts, and other visualizations for your reporting needs.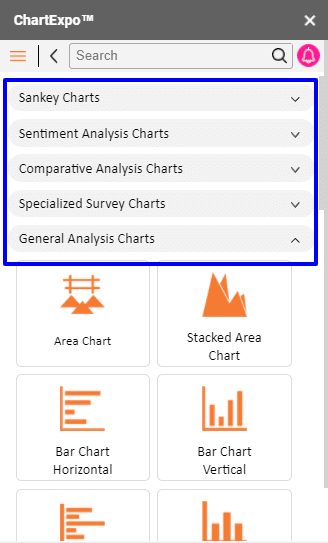 Customize your visualizations’ fonts, colors, backgrounds, styles (among others) using the app’s rich properties framework.
 You save tons of time and effort creating dynamic visualizations even without any design experience or skills.
Sharing and publishing your charts is a breeze since you can download your visualizations as JPG or PNG and embed them on your website.
Those are the best Google Sheets add-ons to use for reporting. Now let’s move on to the five reliable apps for data analysis.
You save tons of time and effort creating dynamic visualizations even without any design experience or skills.
Sharing and publishing your charts is a breeze since you can download your visualizations as JPG or PNG and embed them on your website.
Those are the best Google Sheets add-ons to use for reporting. Now let’s move on to the five reliable apps for data analysis.
Google Sheets add-ons for analysis
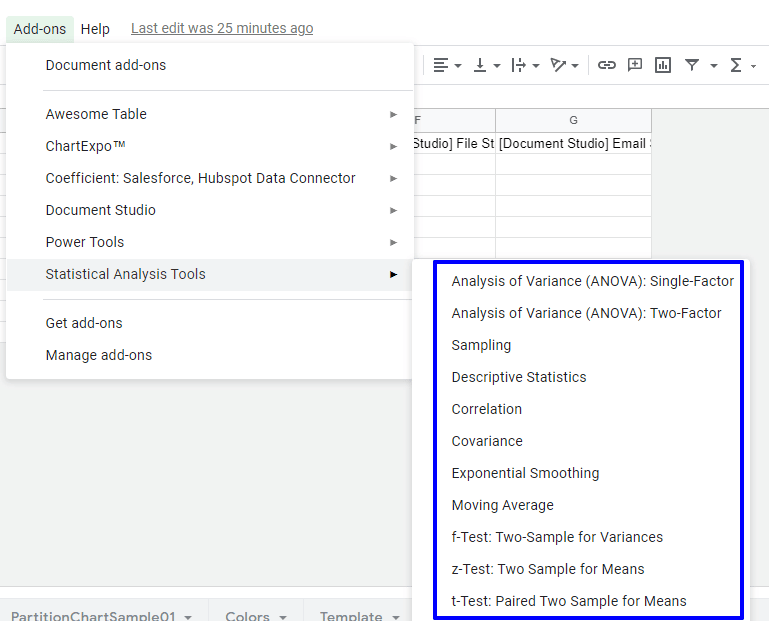
6. Statistical Analysis Tools
Statistical Analysis Tools is a Google Sheets add-on package containing functions designed to automate the generation of statistical analysis techniques. The app works almost exactly like the MS Excel Analysis ToolPak, but it includes a few enhanced features, such as dynamic results and speed performance. This add-on is equipped with tools, including:- Correlation
- Sampling
- Exponential Smoothing
- Descriptive Statistics
- Moving Average
- Covariance
- t-Test: Paired Two Sample for Means
- f-Test: Two-Sample for Variances
- z-Test: Two Sample for Means
- Analysis of Variance (ANOVA): Single-Factor
- Analysis of Variance (ANOVA): Two-Factor (without replication)
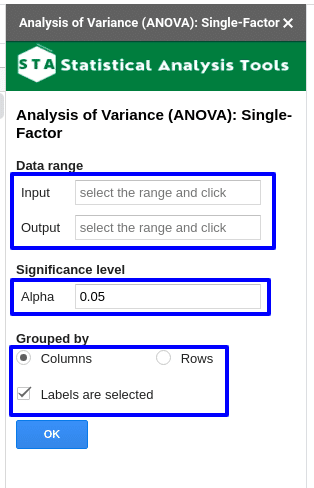 With the app, you won’t need to manually input functions and formulas to your dataset to get your desired calculations and values, streamlining your data analysis.
7. Advanced Find and Replace
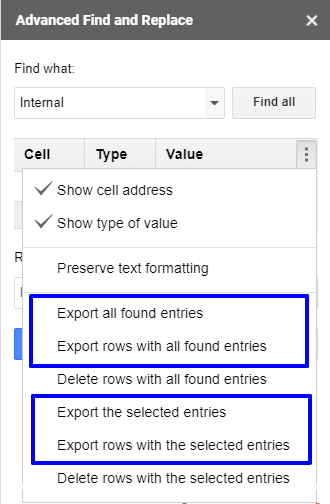
Advanced Find and Replace offers advanced search features to speed up finding and replacing text in your formulas, looking for values, checking hyperlinks behind the text, and searching notes in all your spreadsheets simultaneously. It’s a simple yet powerful tool that instantly gives you a list of your searched spreadsheet entries and lets you replace them in one click. It has a feature that lets you find and replace within columns by selecting the required data range or scanning your selected sheets.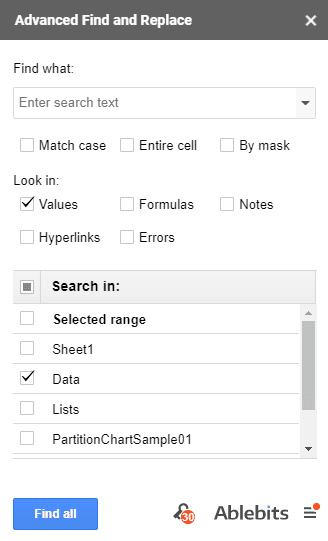 The Advanced Find and Replace add-on offers the tools you need to discover your required data. It gets all your listed matches and lets you navigate to them instantly, allows you to replace all or selected records, and export found values or the whole rows containing them.
 The app simplifies and eliminates manually finding, replacing, and tweaking your datasets for efficient data analysis in Google Sheets.
8. BigQuery Uploader for Sheets
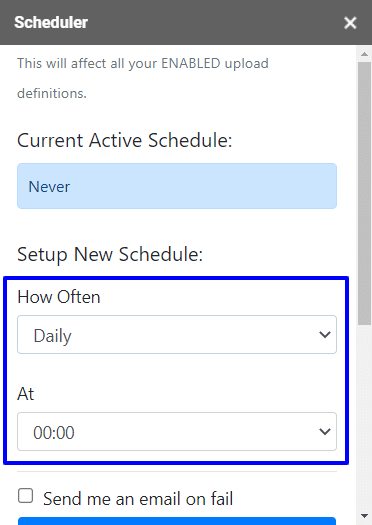
Manually uploading multiple spreadsheets into BigQuery is often slow-moving and complex, making BigQuery Uploader for Sheets a handy Google Sheets add-on for this task. You can set up your upload definitions and run automated (or manual) uploads.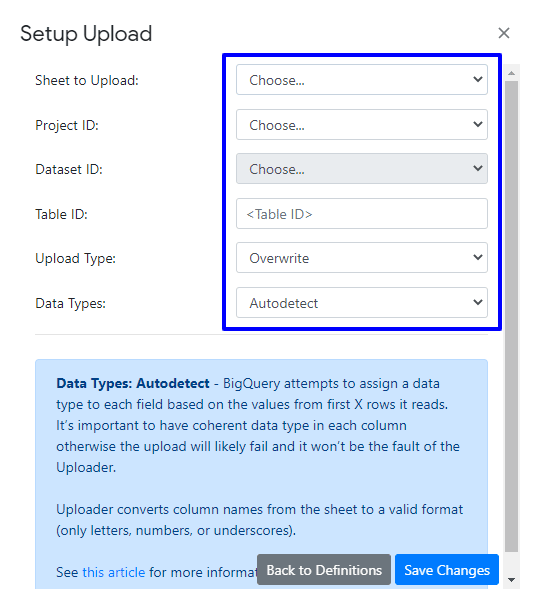
 You can maintain your spreadsheet reference tables and push them to BigQuery, renaming your columns manually to meet BigQuery requirements.
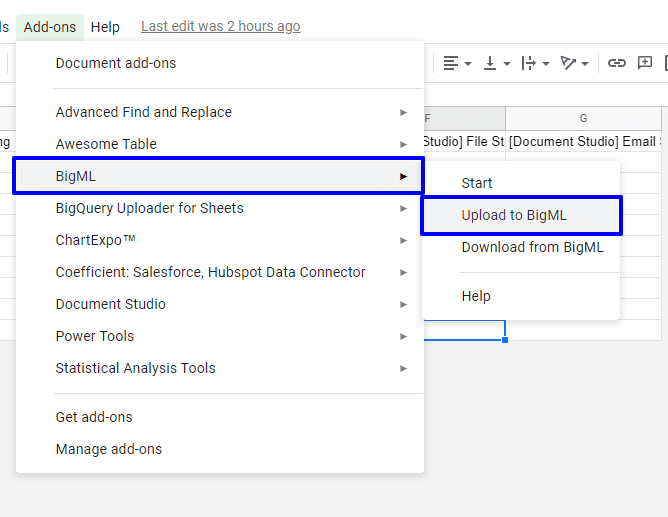
9. BigML
The BigML add-on simplifies filling the blanks in your datasets within Google Sheets via clusters and Machine Learning (ML) prediction models. The app helps you fill in your spreadsheet columns by predicting the missing values with the current decision tree models in BigML.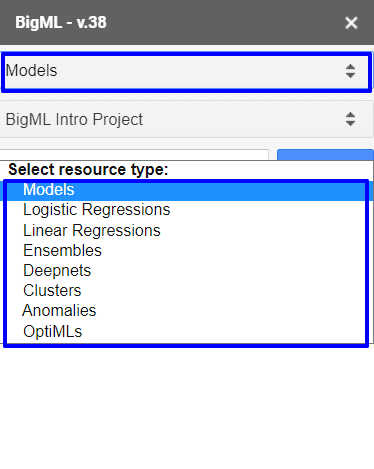
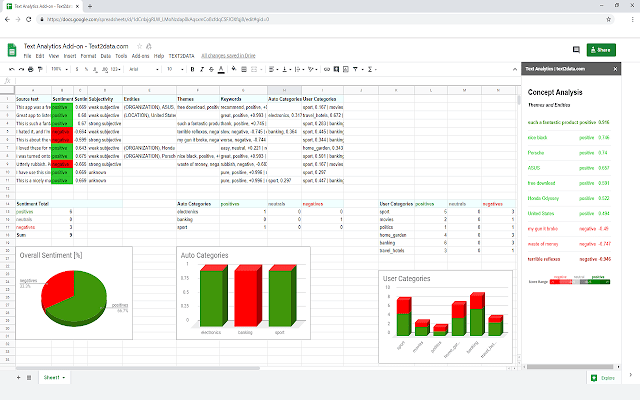
10. Text Analytics
Text Analytics uses Artificial Intelligence (AI) to analyze your text and perform sentiment analysis on your marketing data in Google Sheets.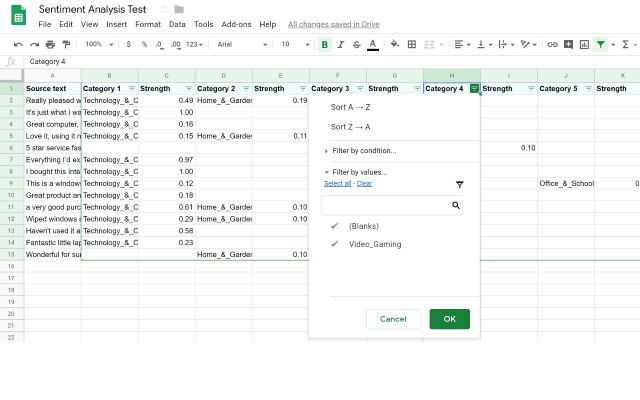
- Perform sentiment analysis on text documents to identify positive, neutral, or negative sentiments
- Detect information, such as spam, emotion, or slang languages
- Perform advanced data mining
- Categorize text documents into user categories
- Gain information on crucial keywords and their polarity within the document
- Extract data from documents with pre-trained models
Start using Google Sheets add-ons for data analysis and reporting
Now that you know the ten best Google Sheets add-ons, start leveraging them for your data analysis and reporting processes. Various Google Sheets add-ons offer unique features and tools depending on their functions, so find the ones that best fit your needs and supercharge your tasks on Google Sheets. Start with the top apps discussed in this guide and build your arsenal from there. Plus, the Coefficient app makes the rest of the add-ons more powerful by allowing you to pull data and reports from your sources to Google Sheets effortlessly. This application lets you import and export volumes of data with a few clicks, whether they live in your CRM platform, a data warehouse, or on the cloud. You’ll get all the accurate and updated data you need to perform analysis, generate reports, and use the other Google Sheets add-ons as quickly and seamlessly as possible. Try Coefficient for free today!
425,000 Pros Sync Live Data from Their Business Systems into Spreadsheet
Stop exporting data manually. Sync data from your business systems into Google Sheets or Excel with Coefficient and set it on a refresh schedule.