Overview
Do you want to streamline your Salesforce data reporting through snapshots but are not entirely sure how to do it? We’re here to help.
Taking regular snapshots of your Salesforce data allows you to report on your historical data efficiently. This gives you a wide-angle view of your teams’ performance while gaining critical sales and marketing information that might otherwise go unnoticed easily.
That said, Salesforce reporting snapshots serve as data compilations focusing on historical trends instead of current opportunities. These capture and store particular datasets at your predefined intervals, generating snapshots that give you and your teams valuable information for comparison and analysis.
Read on to learn more about the importance of snapshotting your Salesforce data, the steps to why doing it in Google Sheets can be a better option, and how the Coefficient app can help streamline the process.
What are reporting snapshots?
Reporting snapshots are point-in-time copies of one or more object fields in a report captured at specific intervals. The system doesn’t overwrite the data when a new snapshot is taken but creates a new copy instead.
In Salesforce, a new custom object handles this, with fields mapped between the report fields and the snapshot object’s fields, creating new records each time a snapshot occurs.
When using Coefficient, this is handled by copying the data into a new Google Sheet.
Why are reporting snapshots important?
Reporting snapshots are essential because they tell you about the reported objects’ current state at the time of the snapshots.
While automatic date fields such as Created Date and Closed Date can help you establish an Opportunity’s major milestones, they are also highly specific events and don’t paint the whole picture of how an Opportunity progressed from start to finish.
So what can you do?
First, you can anticipate questions about your data by creating reporting fields or automated activities when certain modifications happen, such as stage changes.
The second option is to utilize reporting snapshots in either Salesforce or Coefficient to capture the data in advance and analyze and report on it after.
The added benefit of this method is that you won’t need to build automation around every status. Also, you won’t need to know what you’re looking for before getting started, and simply remember to turn it on.
How are reporting snapshots used?
Generally, you can use reporting snapshots to capture historical data about one or more objects in Salesforce. The software’s built-in tools use a report to filter that data and allow business users to change the captured data.
Coefficient’s approach is slightly different since you won’t need to create a custom object and create a record mapping between the report fields and the custom object.
You’re also not limited to only include fields that are part of your report since, under Salesforce’s model, new report fields require mapping to a corresponding field on the reporting snapshot object.
Add it to your report and check the box to enable report snapshots. Doing so allows you to get data about each selected field and each record captured each time the report runs. This gives you a complete history of when each record gets added or removed, including how their values changed over time.
This running log of how data such as Opportunities enter, leave, or change in a report gives you crucial historical information to analyze how the data transforms over time.
You can answer questions such as, “Where do our opportunities tend to get stuck in the sales pipeline?” and “How many cases are left open over the weekend?” This also helps you measure whether you’re making the right adjustments to address these issues effectively.
How to get started with Salesforce data snapshots
Salesforce offers documentation on setting up reporting snapshots, but the process requires an admin to set up your reports and add new fields to the snapshot.
However, this isn’t always ideal, especially if you want to enable reporting snapshots for a test or allow other users control over their Salesforce snapshots.
The steps below outline how to set up reporting snapshots in Salesforce.
Step 1: Create a Report containing the data you want to use. If we’re building a report to see how cases change over time, you might want to include fields such as Case Number, Case Status, and Case Owner at a minimum.

Step 2: Ask your admin to create a new Custom Object using the fields you have in your report as a template. However, this won’t work for certain field types because certain data types aren’t available to users.

For example, Case Owner is a lookup field that can use both User and Group as targets. This means a formula field needs to be added to the case, converting the owner’s name to text.
A corresponding text field must also be added to your new snapshot object and include these fields in your report.

Step 3: From here, your admin will have to create a new Reporting snapshot. The admin can choose the report you made, select the source field from the report, and then the snapshot object’s corresponding field.
- Type in the Snapshot Name. Select the report you want to snapshot and the object that will hold the snapshot data.

- Click Save & Edit Field Mappings.
- Set the Field on the Report that should go with the corresponding fields on the snapshot object you created.

- Click Save.
- Click Edit under Schedule Reporting Snapshot.

- Set a schedule to run the snapshots. Try to balance the snapshot frequency with reporting requirements, the volume of records involved, and how that information changes.

You should now have a set schedule for the snapshots.
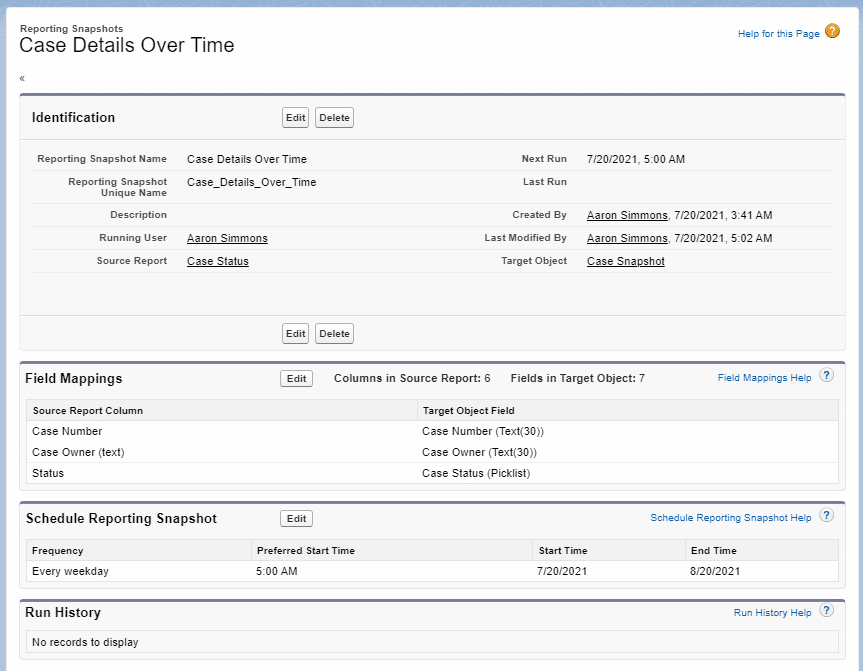
Step 4: Once you have some snapshot data to work with, you can create your snapshot report by selecting the report type of the snapshot object you created earlier.
The Salesforce snapshots will populate over time, allowing you to see how your metrics change over time easily.

The downside to this method is that it takes a lot of work and requires admin intervention to set up and maintain going forward.
This is where Coefficient comes in handy.
The app will not only handle the snapshotting for you, but it also allows you to push your data to Google Sheets seamlessly. This helps simplify your reporting process since working with your data in Google Sheets is often easier than using Salesforce’s standard reporting.
You can find more info in the blog post linked here: How to calculate and track sales velocity over time in Google Sheets.
The steps below show the basics of snapshotting Salesforce data in Google Sheets using Coefficient.
Step 1: Take an existing report or create a new export with Coefficient.
Step 2: On the Google Sheets menu, launch the Coefficient Sidebar and click Import Data.
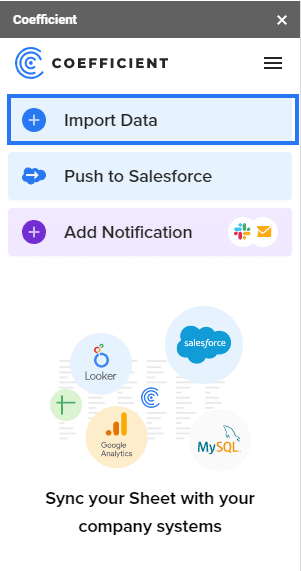
Step 3: Choose Salesforce as your data source.

Step 4: Select Import from Report (or Import from Object if you want to manage the data pull directly in Google Sheets).
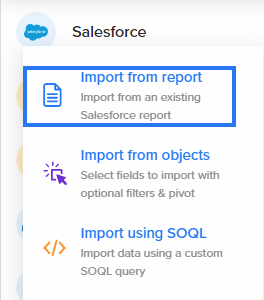
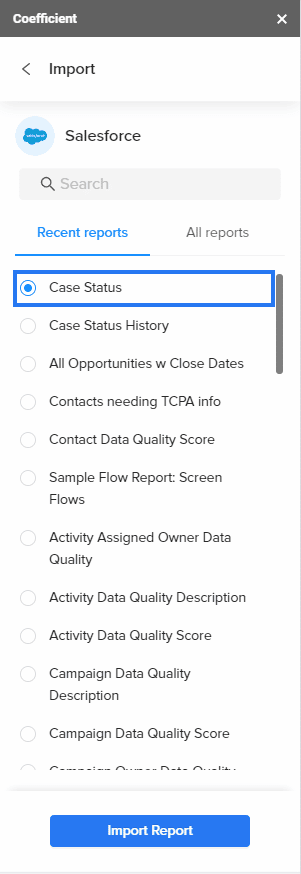
Step 5: Choose the Case Status report.

Stop exporting data manually. Sync data from your business systems into Google Sheets or Excel with Coefficient and set it on a refresh schedule.

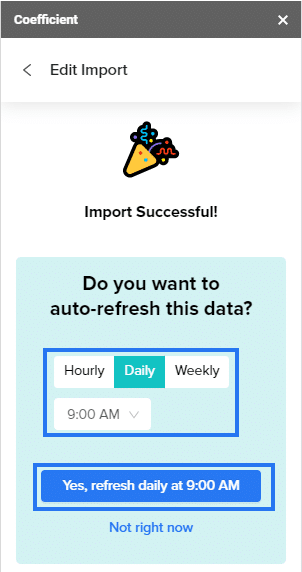
Step 6: Choose a frequency and time to auto-refresh your data.
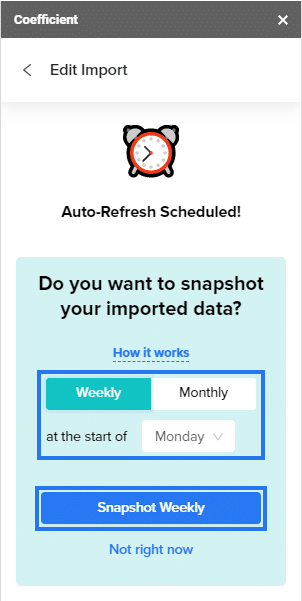
Step 7: Set your preferred data snapshot frequency.
Step 8: Apply any other changes you would like to the report, including removing unnecessary fields. The report will run on the schedule you set and snapshot based on your specified days and times.
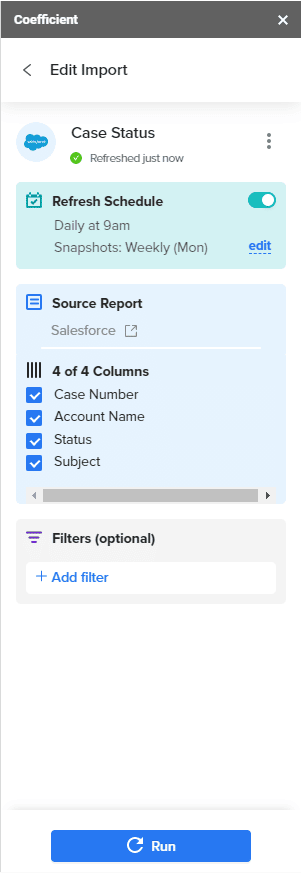
Step 9: Turn on automatic snapshots by setting a schedule, click Save, and you’re all set.
At the selected interval, the imported data gets captured in a new sheet, renamed to the snapshot data, and the original sheet is kept in place as the most up-to-date dataset.

You can then use your Salesforce reporting snapshots and data to create your new Google Sheets dashboards and get better insights from your data.
Salesforce Snapshots: Opportunity History Changes Template
Coefficient’s Opportunity History Template enables you to track sales forecast changes directly from Google Sheets. The template shows how new sales pipelines, lost opportunities, changing close dates, and up-sells impact your bottom-line revenue streams.
The template unleashes the full potential of Salesforce’s Opportunity History Field Tracking:
- Track your sales pipeline over any period of time
- Identify opportunities with value changes or time frame modifications
- Set custom fiscal year periods and monitor changes by month, quarter, or year
- Slice and dice opportunity changes by sales team, opportunity type, or account details
- Identify changes to close dates, opportunity amounts, and other fields that affect sales forecast
And the best part? The template only takes a few clicks to set up.
It’s easy — just navigate to the Opportunity History Template and make a copy.
Step 1: Go to File and click Make a copy.
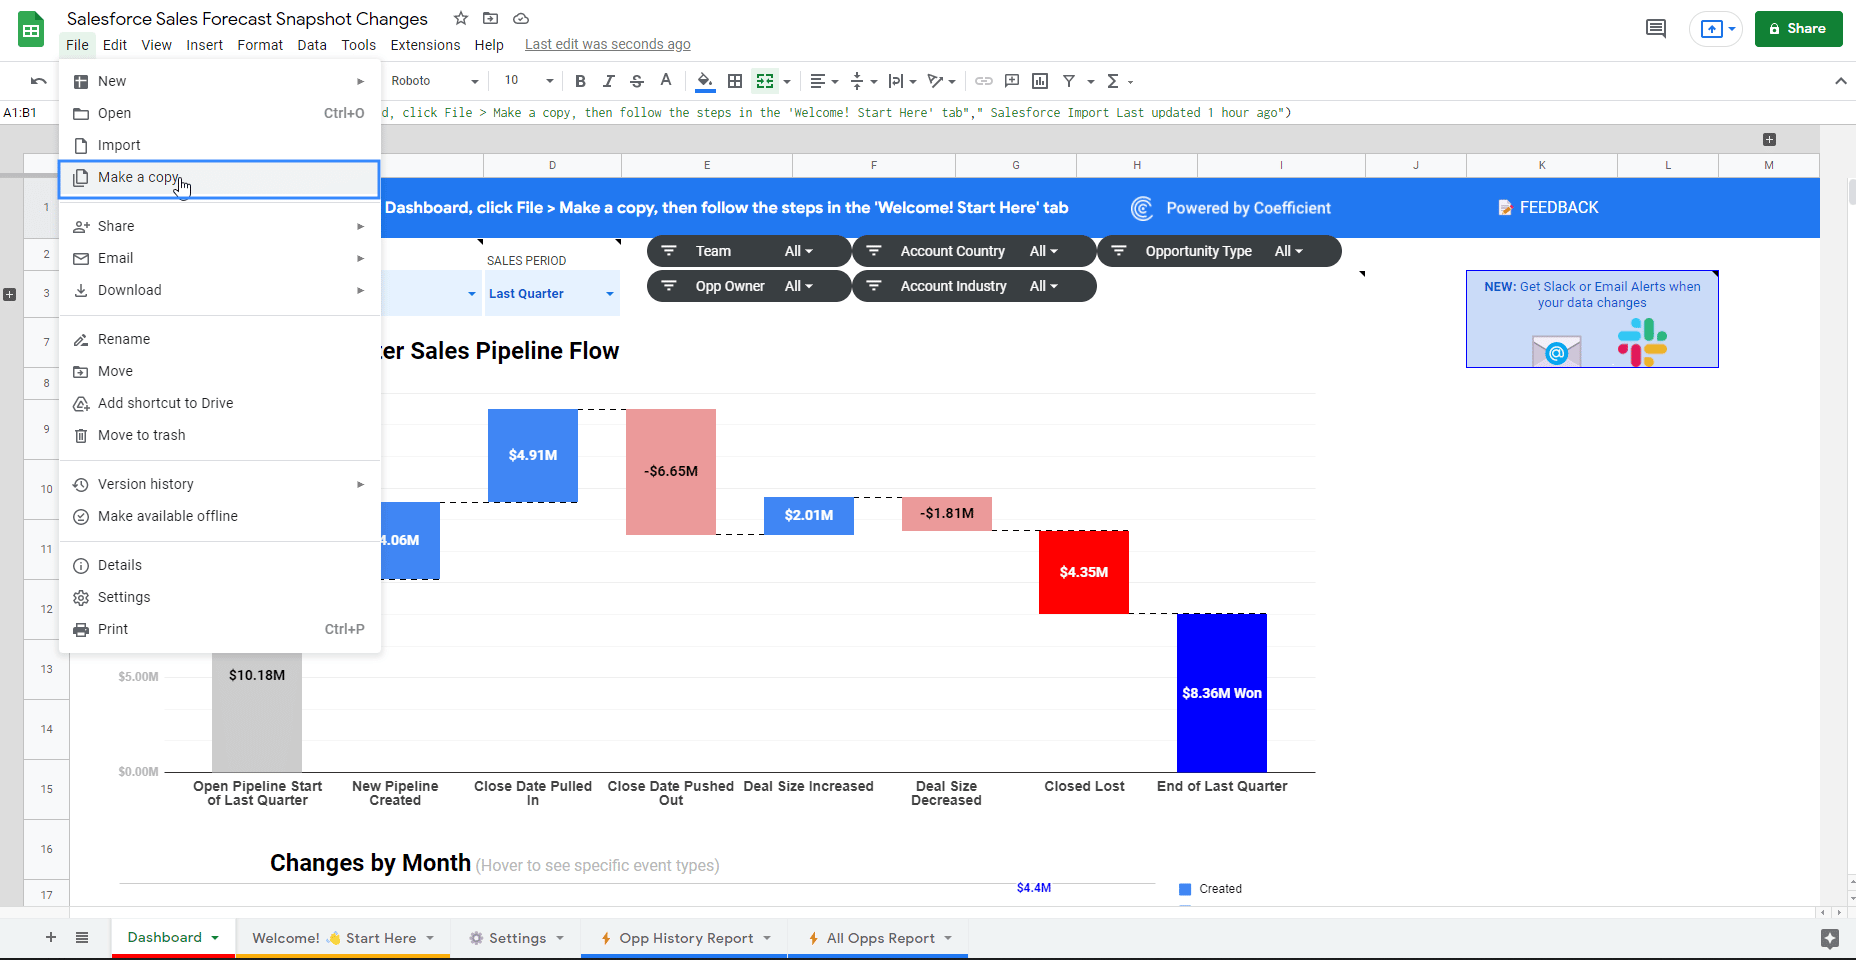
Step 2: Now go to Extensions in the same top panel, scroll down to select Coefficient, then click Launch.
Step 3: You see a panel on your right-hand side with a Coefficient menu. Select Connect to Salesforce.
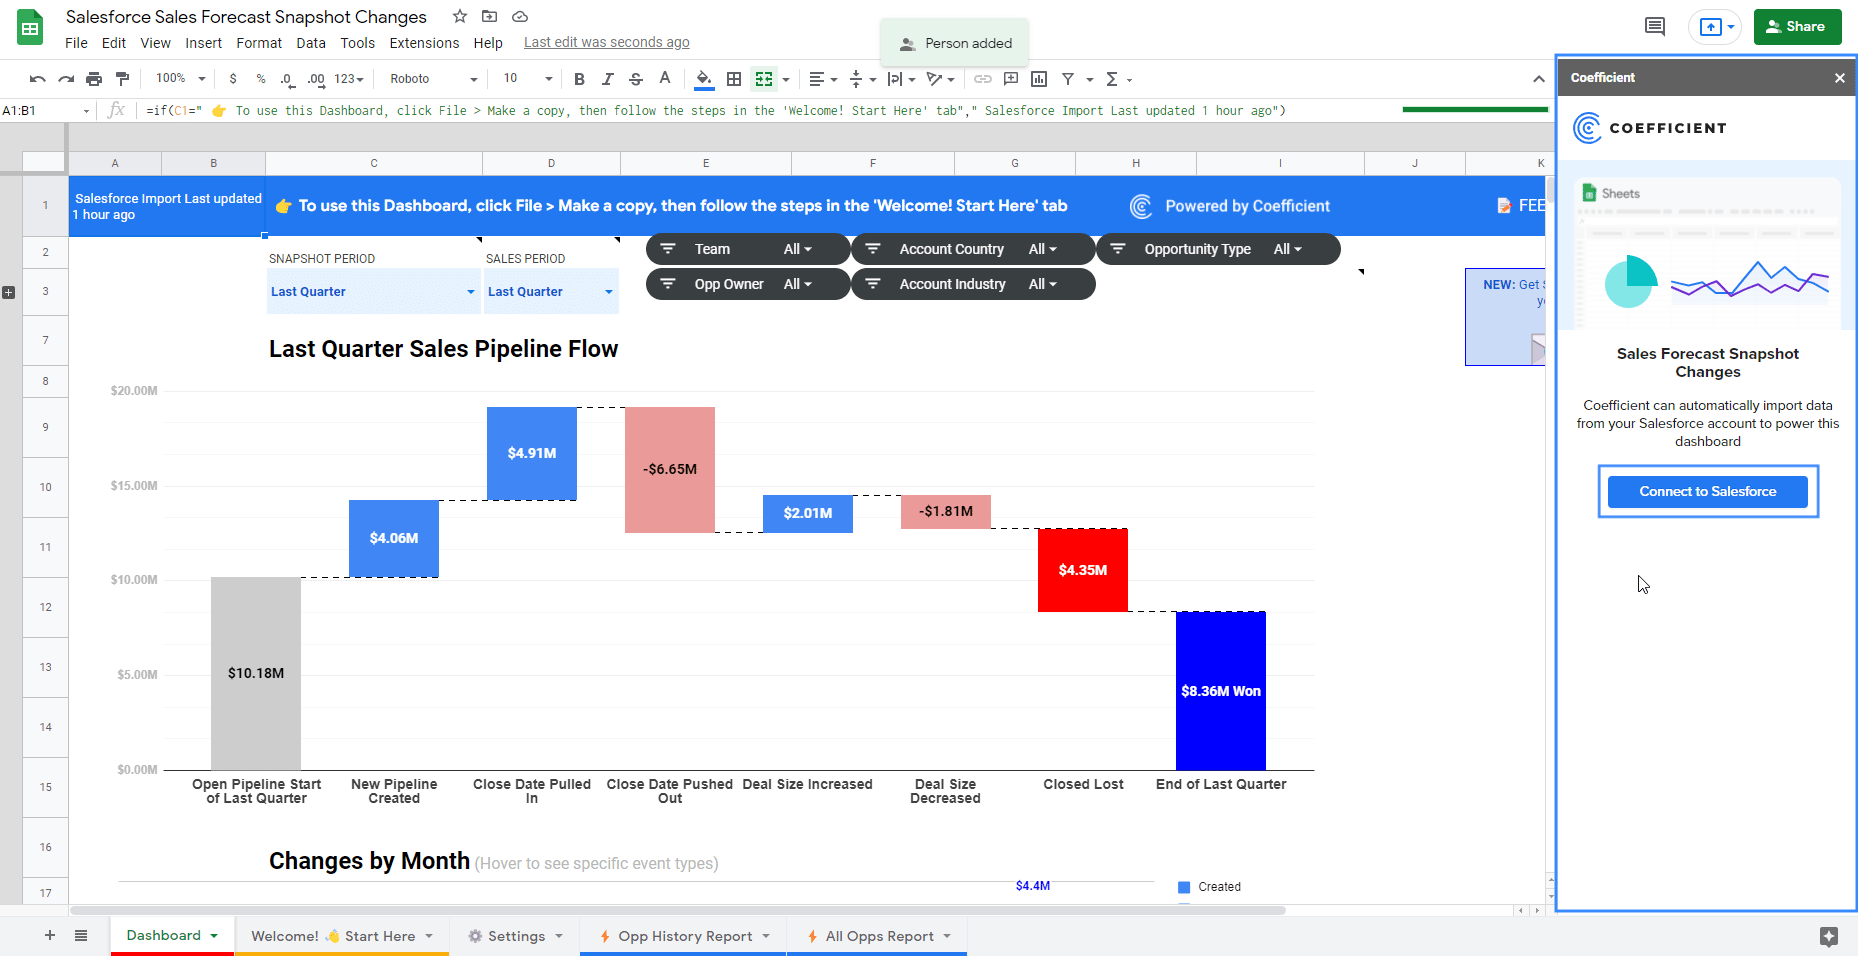
Step 4: Authenticate through Salesforce. You will be taken to the login screen for your org.
Following that, approve the access request by clicking Allow. The connection is made directly between your Google Sheet and your Salesforce instance. A success message will appear in the same panel. You’re connected! The dashboard will update with the new data.
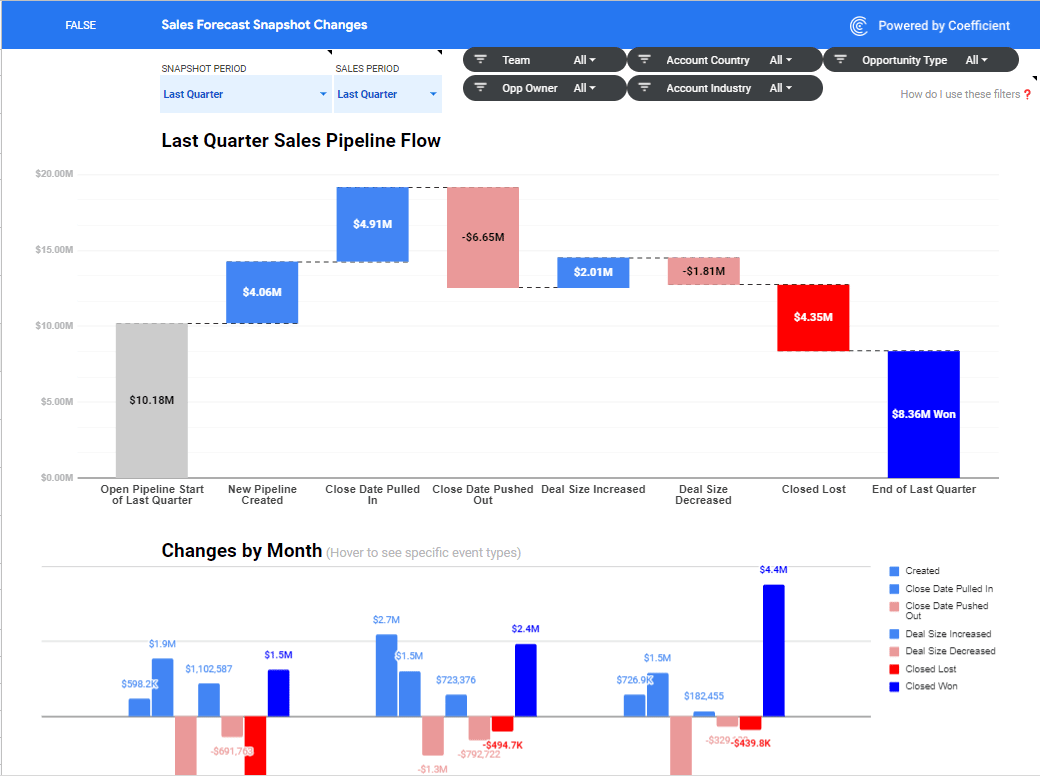
Salesforce reporting is often clunky, difficult to work with, and simply insufficient. But with Coefficient’s Opportunity History Template, you can bypass all the busy-work and get straight to the insights you need in a few clicks.
Snapshot your Salesforce data in Google Sheets
While taking snapshots of your Salesforce data in Google Sheets might only be a part of your data reporting, it’s a critical piece of your overall analytics process.
Salesforce reporting snapshots help you leverage data analytics successfully and yield actionable insights to support your historical data reporting and uncover critical trends.
In a nutshell, Salesforce reporting snapshots can help you monitor changes in your sales pipeline, track forecast accuracy, and see changes by account or case.
These can even serve as compelling evidence for team members who want to propose specific courses of action and other strategic approaches to management.
However, while snapshotting Salesforce data using the software’s built-in tools is fairly simple, it might not be the best method for non-technical users or those with no admin access.
What’s next?
If you want to supercharge snapshotting your Salesforce data, do it in Google Sheets and leverage the power of the Coefficient app. Coefficient eliminates the complexities and often tedious process that comes with conducting reporting snapshots in Salesforce.
With Google Sheets, you’ll have the familiar functions and features of spreadsheets while leveraging the power of Coefficient. You won’t need to map object fields as you would in Salesforce, with Coefficient doing most, if not all, the heavy lifting for you. If you don’t have admin access, no problem. Any user with the right credentials can run the snapshot. The best part is, you can automate the entire process. Set it up once, and you’ll get the data you need when you need it, saving you huge chunks of time and energy.
With Coefficient, you can easily import your Salesforce data to your spreadsheet in a few clicks, set a regular snapshotting schedule, and build your dashboards all within Google Sheets.
You can even push your Google Sheets data back to Salesforce, eliminating bulks of manual tasks that take up time and energy.
Try Coefficient snapshots today for free!
