The longer you wait to follow up on your leads, the harder it gets to close them as customers. That’s why you should never let the trail grow cold.
When you send follow-ups later, rather than sooner, there’s a good chance your would-be customers would no longer feel the urgency or the need to buy. Or worse, your competitors might have won them over by the time you send your follow-up.
Whichever the case may be, you end up losing big time.
And so the question becomes: How do you assess your follow-up initiatives and respond to your leads promptly to get better conversions?
The solution: Track your average lead response time.
In this guide, we’ll go over what a lead average response time is and how you can calculate it in Google Sheets using datasets imported from various data sources.
Table of Contents: Average Lead Response Time
- What is lead response time?
- Calculating the average lead response time in Google Sheets
- Step 1. Importing the Data to Google Sheets
- Step 2. Setting up the Time Difference Formula
- Step 3. Configuring the Month Column
- Step 4. Setting up the Data Validation for Salesperson Name
- Step 5. Configuring the Data Validation for Month
- Step 6. Setting up the Average Formula
- Tips to improve your average lead response time
- Manage all your lead sources efficiently
- Automate critical tasks and processes
- Identify issues that contribute to slow lead response time
- Inform potential clients of your response times
- Score and prioritize your leads
- Book demo meetings quickly
- Reduce the need for contacting sales reps
- Frequently asked questions about average lead response time
- Calculating average lead response time in Google Sheets is easy
What is lead response time?
Lead response time is the average time it takes for sales reps to follow up with leads. It is a critical metric for the sales enablement process.
Leads self identify as leads by submitting a web form, emailing, calling, downloading ebooks, and other actions.
Studies show that sales teams are seven times more likely to qualify a lead within the first hour upon initial contact with the optimum response time of five minutes.
The faster your sales reps can respond to leads, the higher their chances of having meaningful conversations, and in turn, increase conversions. This can also lead to better sales productivity.
Calculating the average lead response time in Google Sheets
Generally, you calculate the average lead response time by taking the total amount of time between lead creation and first response (for all leads assigned to a sales rep). Then, you divide that amount by the total number of leads your team responded to.
The steps below outline how you can calculate the lead response time in Google Sheets, from importing and setting up your data to using specific formulas to get your desired information.
Step 1. Importing the Data to Google Sheets
To import our data quickly from the data source and keep it updated at all times, we’ll use the Coefficient.io add-on for Google Sheets.
Coefficient lets you import, export, and sync your data seamlessly and update it automatically, saving you tons of time and energy when handling and analyzing your data.
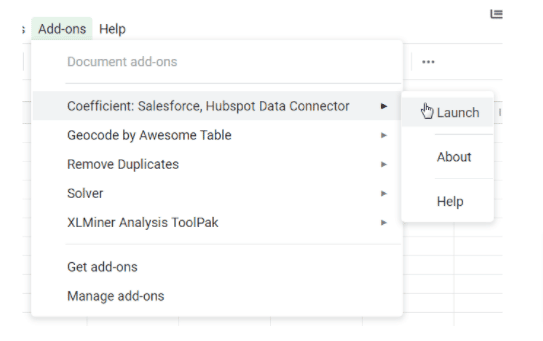
To install Coefficient, go to the Add-ons tab on the Google Sheets Menu, click Get add-ons, and search for Coefficient: Salesforce, HubSpot Data Connector.
After installing the app, go back to the Add-ons drop-down and launch Coefficient.
You could set up your importing options, connect your data source, and specify the objects fields to include, and then your sales content and info get imported to Google Sheets within seconds (or minutes).
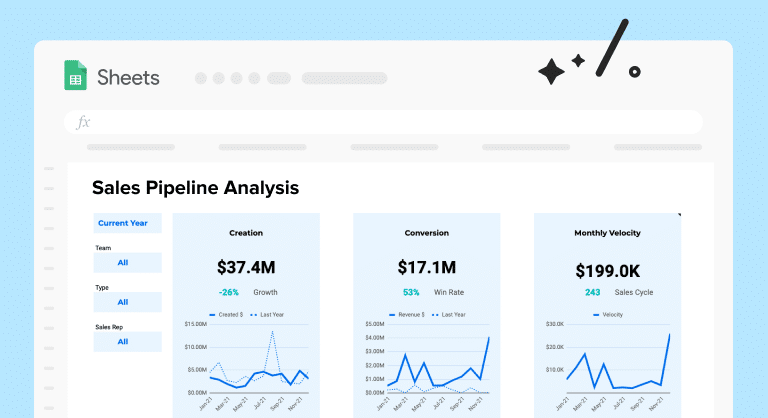
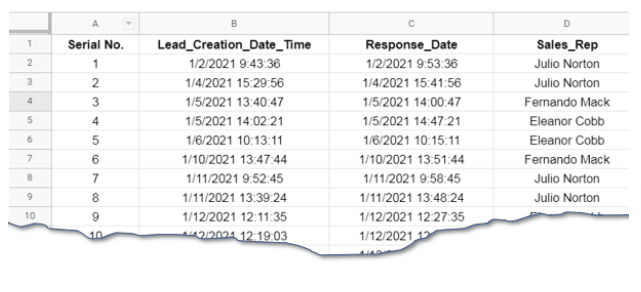
In this example, we have imported lead and opportunity data from Salesforce into our Google sheet.
Let’s assume the data below is available to us for analysis.
Step 2. Setting up the Time Difference Formula
To find the average lead response time in Google Sheets, calculate the difference between the lead start time and response time for each salesperson.
After getting the difference, use the AVERAGEIFS() function to get the average time for each sales representative for a respective month.
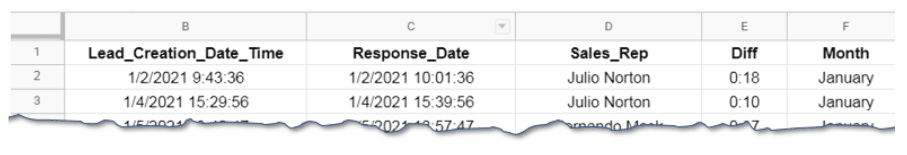
Using the sample data below, calculate the difference by subtracting cell C2 from cell B2. Then, store this value in column E and label it as “Diff.”
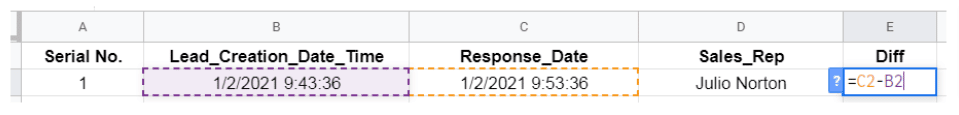
Format the number to display as hh:mm from the Format tab on the menu, then Number > More Format > More Date and Time Format.
Step 3. Configuring the Month Column
Add a column containing the months calculated from the lead_creation_date_time in column B.
Use that value to calculate the average lead response time each month and add a dropdown to select the data of the corresponding month you want to see.
The formula for this column is:
=ArrayFormula(INDEX({“January”,“February”,“March”},month(B2)))
The formula is an array formula that you execute by pressing Ctrl+Shift+Enter. The array formula can be identified by the text “ArrayFormula”.
It works by finding the month of the year from the lead time using the Google Sheets formula MONTH(). This MONTH() formula takes only one argument which is the date and returning the month number from 1 to 12.
The INDEX() formula works by taking a lookup_array as the first argument and a row number as the second to fetch the indexed item.
For this specific case, the array is the names of the months:
{“January”,“February”,“March”}
January has an index of 1, February has an index of 2, March has an index of 3, and so on. When MONTH() returns the month number, it is fed to the INDEX() formula and displays the respective item from the lookup_array.
This way, we can populate the last column with the corresponding months. Our final sheet should look like this:
Step 4. Setting up the Data Validation for Salesperson Name
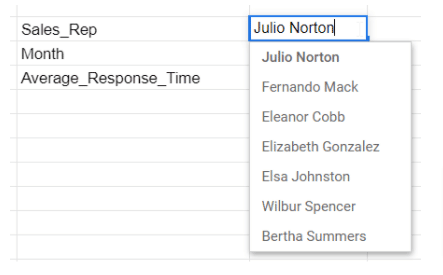
Add data validation to cell I2 so you can select from the salespersons.
Right-click on the cell I2 and select Data Validation. Choose List of Items from the dialog box and enter names of all of the salespeople.
After clicking Ok, you’ll have the names in a dropdown list.
This information will be fed to the second argument of the AVERAGEIFS() formula.
Step 5. Configuring the Data Validation for Month.
Click on cell I3 and go to the last option of Data Validation. From the Data Validation dialogue box, select List of Items and enter month name.
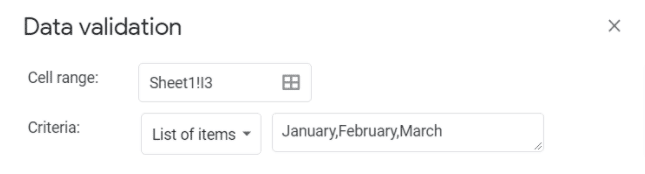
This step will create a dropdown for the month we will use in our averaging formula.
Step 6. Setting up the Average Formula
Configuring the average formula is the most important step since it will give us the average lead response time. All the previous steps lead to and facilitate the calculation of this value.
Use the formula AVERAGEIFS() with the following syntax:
AVERAGEIFS(average_range, criteria_range1, criterion1, [criteria_range2, …], [criterion2, …])
Below is a quick breakdown of the formula’s components.
- Average_range: This is the first argument of the formula and takes the value to be averaged. In our sample dataset, column E should contain the difference value for time.
- criteria_range1, criterion1: This is the second “pair” of arguments in the formula, meaning the criteria range and its respective criteria. It should be the range with no square brackets, which implies that this must be supplied to the formula or it won’t work. In this case, the criteria range is column D (Salesperson name) selected from the drop down in cell I2.
- [criteria_range2, …], [criterion2, …]): This refers to the third argument in the formula and is optional. Optional arguments have square brackets around them and you can skip them. In our example, column F is the criterion_range2, whereas criterion2 is cell I3 that contains a dropdown for the Months.
The final formula should be:
=AVERAGEIFS($E$2:$E$87,$D$2:$D$87,I2,$F$2:$F$87,I3)
Step 7. Final Result
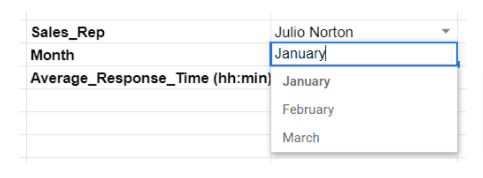
The final result will be displayed in hh:mm in the table below.
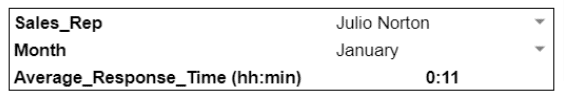
You can select from the combination of Sales Representative and Month to get the average lead response time in Google Sheets.
Tips to improve your average lead response time
While decreasing the average lead response time depends on a company’s sales enablement strategies, there are tried-and-tested tips you can adopt.
Below are some practical tips to help improve your average lead response time and ultimately boost your sales effectiveness.
1. Manage all your lead sources efficiently
It’s easy to overlook a specific lead source when your sales team deals with multiple (direct and indirect) channels on top of handling critical sales-facing tasks.
Your leads could come through:
- Company phone and email (including your individual employees’ phone lines and email accounts)
- Business profile, posts, and comments on social media channels, such as Facebook and Instagram
- Callback tools
- Website chat
- Web contact forms
- Software review websites
Ensure you have reliable systems, strategies, and tools in place to capture and track leads from your various sources efficiently.
For instance, you can use a Customer Relationship Management (CRM) tool with lead source tracking features to streamline the process.
This would help you capture quality leads in every possible channel, and your sales team could avoid missing out on tons of lead generation and conversion opportunities.
2. Automate critical tasks and processes
Automate reaching out to your potential clients and managing contact with leads.
Doing so can help reduce your lead’s waiting time to get a response from your sales reps while also improving your sales productivity.
For example, using callback automation software for your website can help connect your buyers to your sales reps instantly.

Stop exporting data manually. Sync data from your business systems into Google Sheets or Excel with Coefficient and set it on a refresh schedule.

Some callback automation tools with robust features allow you to apply scoring rules to display the callback widget when your leads are most likely to convert.
You can also link the widget within your email signature or connect it to your contact forms, making it quick and easy for potential clients to reach your sales team through various channels.
Automation eliminates manual tasks in contact lead management and, in turn, it helps improve your sales reps’ average lead response time and boosts sales productivity.
3. Identify issues that contribute to slow lead response time
Improve your strategy and perform sales coaching on contacting and managing leads. A comprehensive sales training helps address issues that can lead to a poor average lead response time.
Some of these issues come from sales reps who:
- Do not know the importance of the average lead response time in the sales process
- Fail to properly apply sales coaching or sales training learnings to their actual jobs
- Classify leads based on their subjective opinion
If left unchecked and without appropriate sales coaching, these seemingly small problems can become bigger issues contributing to slow lead response times.
Refine your sales team and reps’ approach to lead management and response through proper sales training (or retraining). This conveys the importance of a timely lead response and helps your team implement appropriate measures.
Conduct sales coaching, encourage proactive approaches when reaching out to leads, and refine your sales enablement to improve your company’s overall average lead response time.
4. Inform potential clients of your response times
Tell your leads how long it will take for your sales team to respond to their queries and requests in order to set proper expectations.
For instance, if your site visitor submits a web form, show the waiting time information. Display your business hours beside your phone or email details on your website.
The lead response time you set for potential clients also serves as a target for your sales reps, encouraging them to provide timely replies within the given timeframe.
5. Score and prioritize your leads
Lead scoring allows you to rate your leads based on their perceived value to your business.
Factors, such as your lead’s industry, company size, job title, and previous interactions with your company, can help you assess the probability of closing the prospect and the account’s value.
Through lead scoring, you can uncover and prioritize your hottest, sales-ready leads. This helps your team implement appropriate and timely responses, leading to a better average lead response time and more conversions.
6. Book demo meetings quickly
Minimize the often long back-and-forth communication between your sales team and leads by allowing potential clients to instantly schedule a demo or call.
Cut down the number of exchanges when your sales team reaches out to potential clients by sharing your reps’ availability. This allows your leads to easily select a slot that works best for them.
You can take this approach a step further by letting your leads choose a time to chat while they sign up on your website.
It’s an excellent way to reduce leads who signed up but didn’t answer. It can also increase your speed to lead since potential clients can book a meeting immediately, and not spend too much time waiting for automated follow-up emails from your sales team.
7. Reduce the need for contacting sales reps
One way to shorten your average lead response time is to minimize the query volume from potential clients.
This means fewer waiting times for leads, and your sales team can focus on handling the most crucial leads instead of fielding huge call volumes.
A great solution is to publish helpful sales content, such as a Frequently Asked Questions (FAQ) page. This dedicated section should answer basic and commonly repeated questions of potential clients, such as your free trial details, security, and pricing.
Besides an FAQ page, consider displaying your relevant sales content, including your terms and conditions and product features, on prominent areas on your website or landing page.
Use applications that let you create useful sales content for potential clients, including a knowledge base, an online portal for booking meetings, and other functions that can reduce calls to your sales reps.
The more manageable the call volumes, the more efficient your sales team can attend to lead inquiries, improving your average lead response time.
Frequently asked questions about average lead response time
Below are some of the commonly asked questions about lead response time.
1. What is considered a good lead response time?
According to studies, reaching out to a potential customer within five minutes of the initial contact is considered an ideal lead response time.
Other data also state that calling a lead within five hours is 40% more effective than connecting with them after 24 hours.
Generally, it depends on your strategies and goals for sales effectiveness.
2. How does lead response time affect sales?
Lead quality diminishes the longer your sales team does not respond, reducing their chances of successfully connecting with the potential client.
After all, most leads don’t want to wait around for a sales rep to contact them and instead will go to and often buy from the company that responds first.
This makes it crucial for your sales team to act promptly since lead quality can quickly go bad in an hour, a day, or a week from the initial contact.
A quick lead response time means better chances of engaging and connecting with potential clients, increasing your sales team’s chances of closing sales.
3. Why calculate the average lead response time in Google Sheets?
Google Sheets is a free, widely used program, making it a familiar and relatively easy tool for calculating and analyzing your average lead response time. This simplifies tracking your sales effectiveness.
Google Sheets allows you to use functions and formulas for your other related sales data analysis. Also, moving your datasets in and out of the program is a breeze with data connectors and apps.
Calculating average lead response time in Google Sheets is easy
Calculating your average lead time in Google Sheets is quick and easy with the help of our guide.
This allows you to track and analyze your lead response time more efficiently, improve your sales enablement process, and ultimately boost your sales productivity and effectiveness.
Performing the average lead time calculation in Google Sheets is more seamless with Coefficient.
The app’s powerful data importing, exporting, and syncing features let you connect your data sources and move your datasets to and from Google Sheets in seconds.
No more manual importing, object field mapping, and downloading the export file from your email to import your data. Coefficient allows you to fetch your datasets directly from the database to Google Sheets in a few clicks.
You can also schedule your data to automatically refresh so you won’t need to repeat importing data every time the source information changes. This way, you always work with the latest data to calculate and track your average lead response time efficiently.
Try Coefficient for free today!