


Table of Contents
![]()
- 1. Better Salesforce Opportunity Stages, Better Forecast: Here’s How
- 2. How to create a report in Salesforce?
- 3. A Guide to Custom Report Types in Salesforce
- 4. How to Create a Matrix Report in Salesforce
- 5. Joined Reports in Salesforce: Step-by-Step Tutorial
- 6. How to export opportunities from Salesforce
- 7. How to Build a Stage Report in Salesforce: A Step-by-Step Guide
- 8. How to Build a Salesforce Summary Report
- 9. How to Workaround Salesforce Report Limitations?
- 10. How to Clone a Report in Salesforce (And How to Never Do it Again)
- 11. How to Pull a Report in Salesforce
- 12. How to Share a Report in Salesforce
- 13. The Easy Way to Do Salesforce Field History Tracking
- 14. The Easy Way to Solve Salesforce Opportunity Management Problems

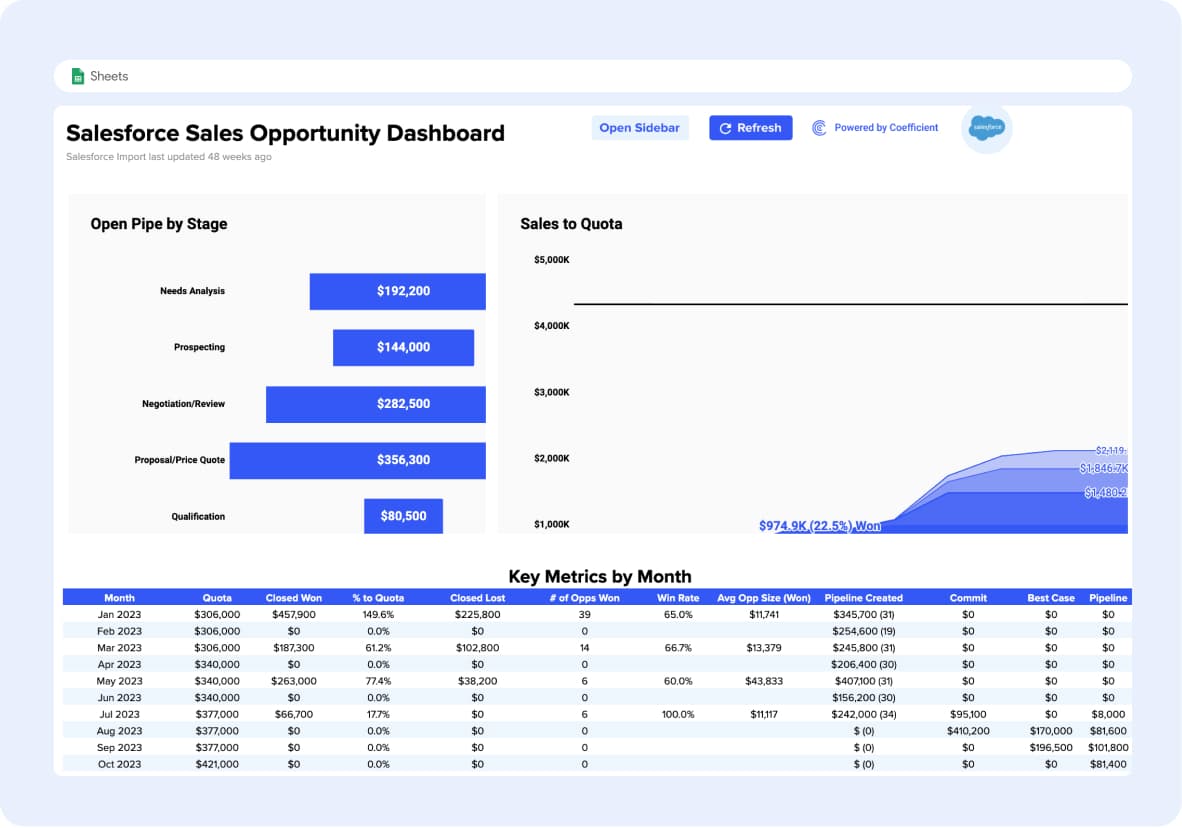
Salesforce reports are one of the most impactful features of the CRM platform. They allow your team to organize, analyze, and visualize sales data to make key decisions about your operations and org.
Salesforce offers four different types of reports, each with their own benefits, from tabular reports, to summary reports, to matrix reports, to joined reports.
The most popular Salesforce reports are summary reports.
Summary reports help slice and dice data in a myriad of ways for both custom and standard objects. They allow for groupings, display results as sums or as parts, and any user with the appropriate permissions can build them.
Summary Reports provide incisive results for a diverse array of Salesforce users. They’re in the toolkit for anyone, from a Salesforce Admin building complex company reports, to a Sales Manager who wants to identify high performing reps.
Read on to learn how to build a summary report in Salesforce, based on step-by-step walkthroughs and best-practices.
Salesforce report blockers holding you back? Sync live Salesforce data into Google Sheets, build any report you need, and share with your stakeholders for free (no extra Salesforce license needed).
Benefits of Salesforce Summary Reports
Summary reports are widely leveraged by Salesforce users, due to their power and versatility. Here are some of the benefits of summary reports:
- Analyze data grouped in rows
- Consume three levels of data in one view
- Combine charts, summary fields, and bucket fields
- Add easy-to-understand visuals in dashboards
- Access subtotals to get more granular results
How can you use summary reports in your org? Next, we’ll review a few common examples in Salesforce.
10 Examples of Summary Reports in Salesforce
You can create a summary report for just about anything in Salesforce. Some of the common use cases include, but are not limited to:
- Top Performing Sales Reps by Region
- Most Valuable Accounts per Opportunity Amount
- Opportunity Pipeline this Quarter
- Customer Support Rep Response Time
- Customer Satisfaction by Support Rep
- Neglected Leads to Focus On this Week
- Hot Leads that Need Attention
- Contracts Up for Renewal Ranked by Amount
- Tasks Due Today by Team Members
- Custom Object Records of Your Choice
If the data can be segmented, it can usually be inserted into a summary report in Salesforce.
And as long as reporting is enabled for custom objects, they will mesh seamlessly with summary reports.
Now let’s learn how to build a summary report in Salesforce.
How to Build a Summary Report in Salesforce
Building a summary report in Salesforce is actually quite easy. In our example, let’s view Closed Won Opportunities sorted by Type.
This will give us a better look at our revenue sources so we can focus on those in the coming quarters. Here’s how to build the report.
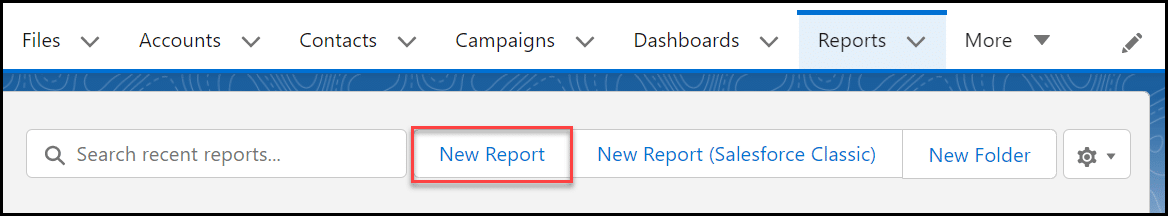
- Navigate to the Reports tab and select New Report.
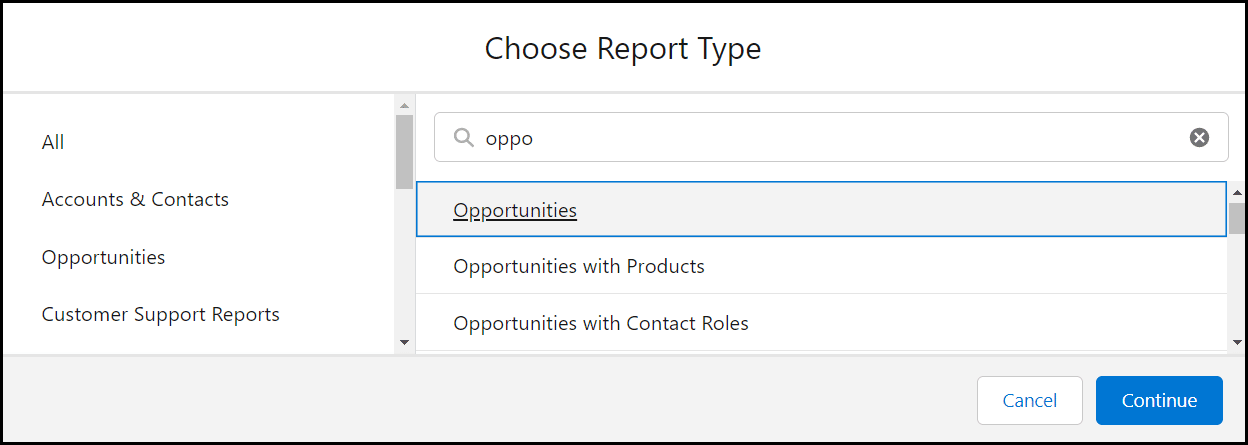
- Select the object for the basis of your report. For this example, we want to view Opportunities. Select Continue once your object (or objects) have been selected.
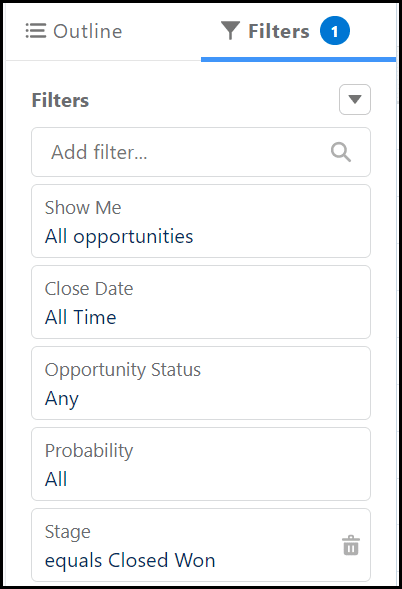
- Select the Filters tab, and begin to make adjustments. For our report, we changed Close Date to All Time and added a filter for Stage since we only want to see Closed Won.
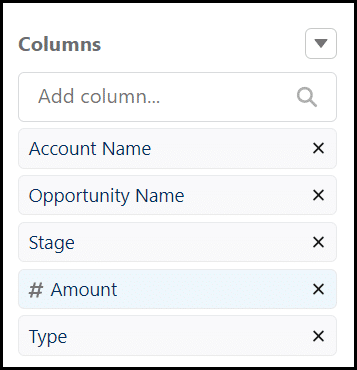
- Next, select the Outline tab. Clean up the Columns by selecting the “X” beside fields you do not wish to see in this report, and search for and add any fields you would like to see.
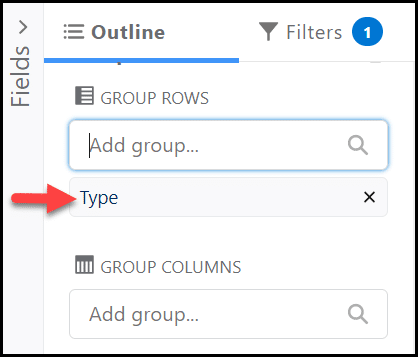
- White still on the Outline tab, add a field to the Group Rows section. This is what helps segment the report. For our report, we added the Type field.
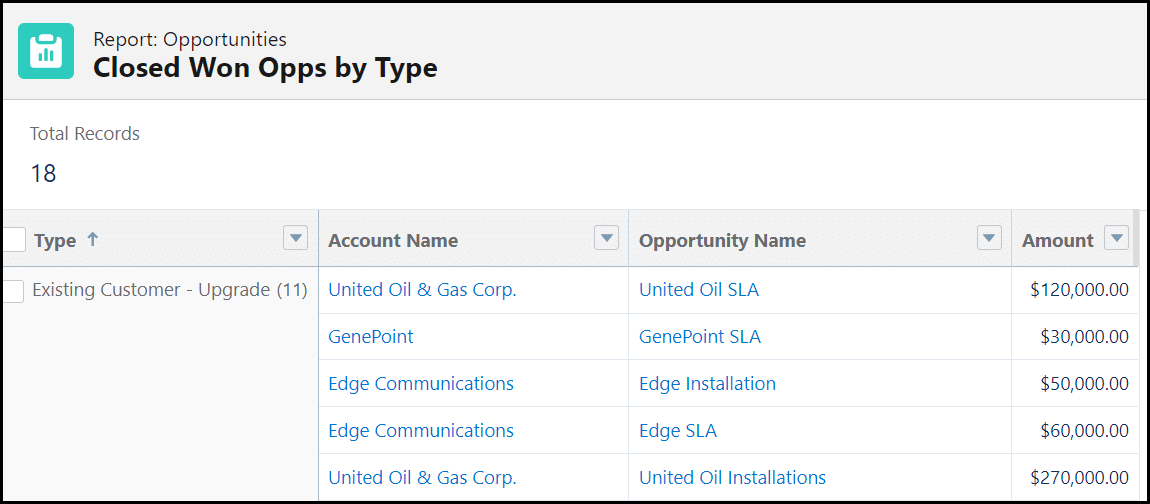
- Next, change the name of your report by selecting the pencil and select Save & Run to see the results. Once a folder is selected, your report will appear.

- Congrats! You now have a Summary Report in Salesforce! Use this time to make adjustments. Let’s remove the Stage field from the report since a filter focuses only on one stage.
But don’t stop there! You can make enhancements to your summary report that make it even more informative.
Enhancement Options
You can enhance your summary report to view your data in different ways, depending on what you need to accomplish. Here are some different ways to toggle your reports and improve your insights.
Turn Off Detail Rows
In some cases, you’ll just want to see raw numbers, without the details of record names or all the fields in one long report. There’s a simple solution for this — you simply need to turn off the Detail Rows.
You can see in this report that Detail Rows have been enabled, indicated by the white checkmark and blue background.
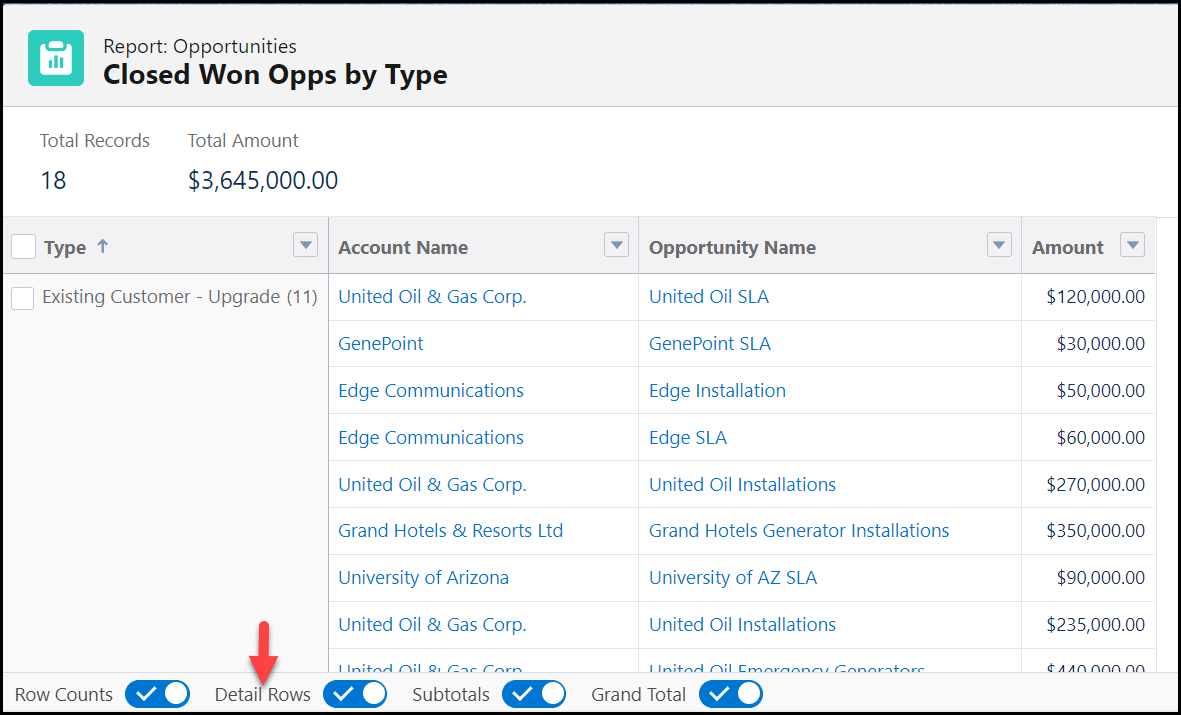
To turn that off, simply select the check. You can now see a more condensed version of your report.
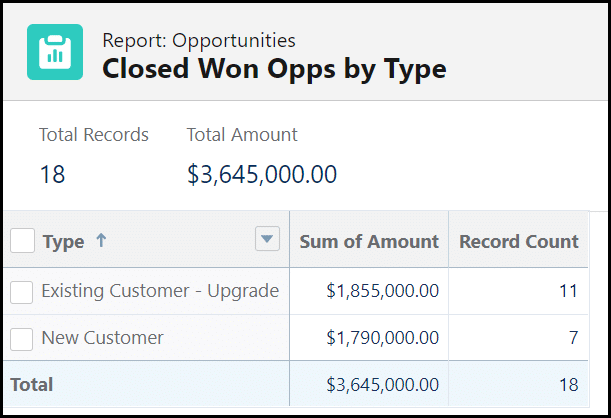
This is not a permanent change and can be done quickly and easily to see a breakdown of your report without having to scroll.
Add a Chart to Your Summary Report
A colorful visualization can supplement your summary report, and it does not take long to add. Plus, if you plan on using your summary report in a dashboard, a chart is essential.
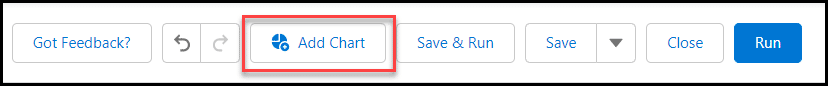
- Select Add Chart from within your report.
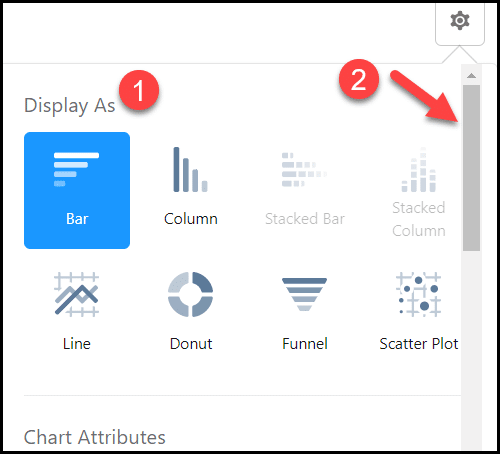
- A chart will automatically appear, but you can make changes by selecting the wheel from within the chart.
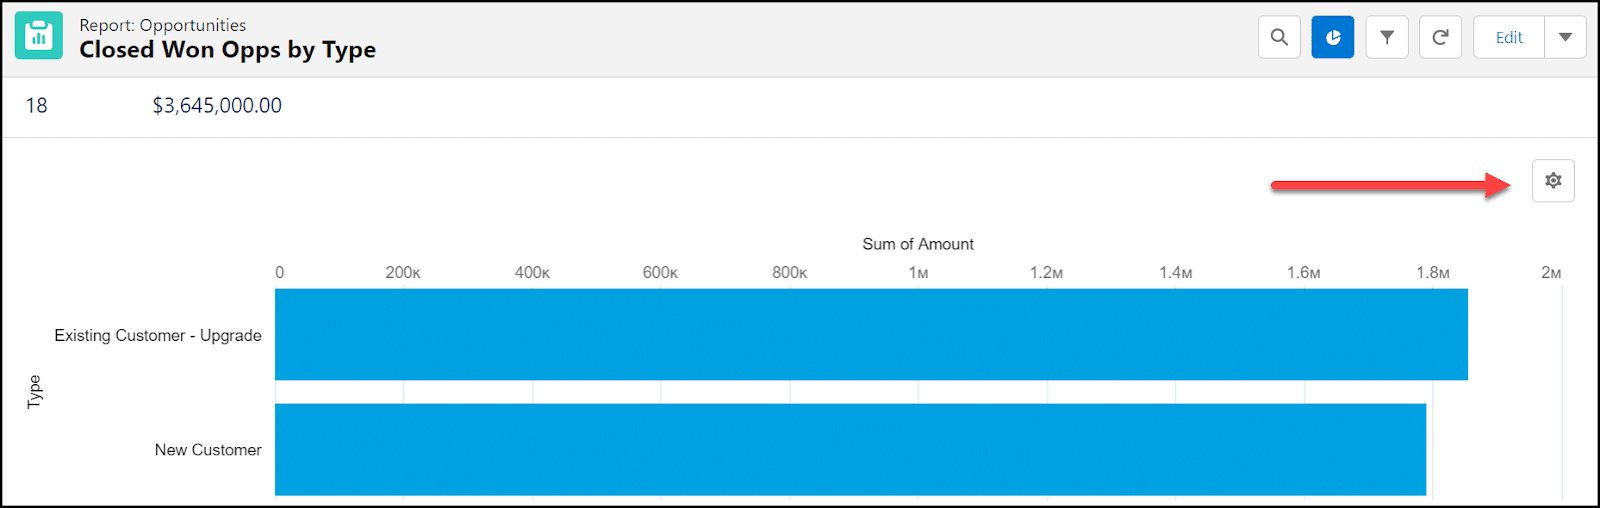
- Select your Display As (1) to indicate the type of visual you want, then scroll down (2) within the Chart Properties box to make additional changes.
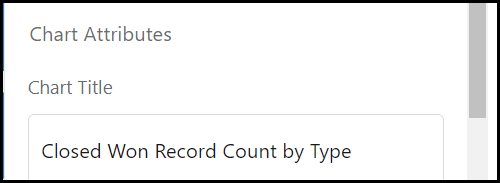
- Under Chart Attributes, enter a name for Chart Title. Continue to scroll through Chart Properties.
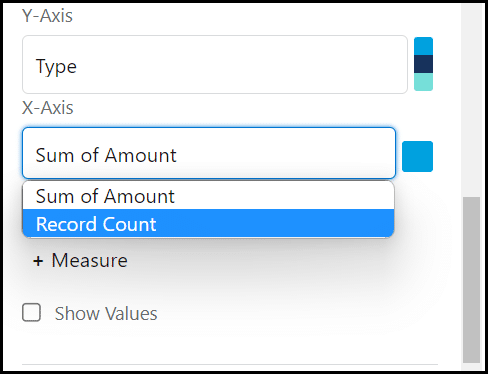
- Adjust X-Axis and Y-Axis if needed. Select the field under each Axis to see other options. In this example, we changed the X-Axis from “Sum of Amount” to “Record Count”. You can also choose to change colors, indicate measurement lines, or show values on the chart graphic.
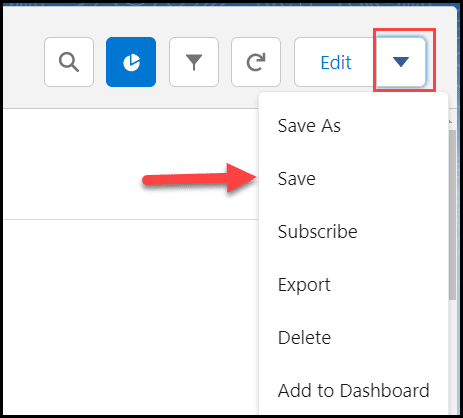
- Once you’re done making adjustments, select the drop down beside Edit on the report and select Save.
Now you have a chart that’s a hefty addition to your report and dashboard. This makes the data easier to digest and less overwhelming for those that find rows of results difficult to comprehend.
How to Access Summary Reports
The last thing you want to do is create a report and never use it again. There are numerous ways to access your reports once you’ve built them.
- Subscribe to your reports to have them emailed to your inbox.
- Find your report on the Reports tab on your home page.
- Access a dashboard that has all of your reports lined up for easy visibility.
- Nest a report on your Home screen.
There are also tips to keep in mind when it comes to making the most of your Salesforce Summary Reports.
3 Pro Tips
In our work with hundreds of sales teams, we’ve learned a thing or two about summary reports and how to best use them. Here are three ways to make your Salesforce summary reports more efficient:
- Don’t be afraid to play around with your report and save a version or two. You may discover you like it displayed differently depending on your audience.
- Keep your chart simple! Use the appropriate display for the type of information you have in your report.
- Use one report for multiple dashboard widgets. You can display the same data in multiple graphs, and reduce clutter by not having the same report saved numerous times.
Now that you know how to create a Salesforce Summary Report, you can keep an eye on important data and trends within your org!
Import Summary Reports into Spreadsheets for Expanded Analysis
Although Salesforce summary reports offer key insights, importing them into Google Sheets enables you to engage in expanded analysis and visualizations and share with stakeholders that don’t have access to an expensive Salesforce license.
With Coefficient, you can connect Google Sheets to Salesforce in a single click and import Salesforce data from existing reports, objects & fields, and custom SOQL queries.
Here’s how to import a summary report into Google Sheets with Coefficient:
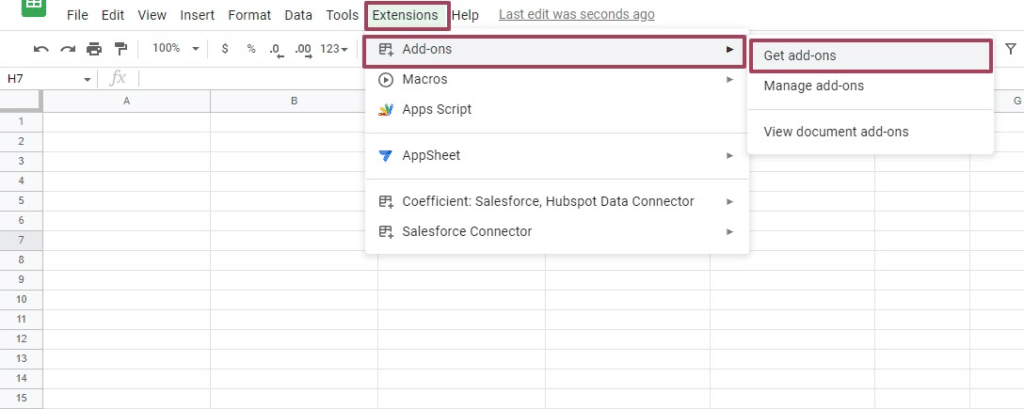
Click Extensions from the Google Sheets menu. Select Add-ons and choose Get add-ons. This will bring you to the Google Workspace Marketplace.
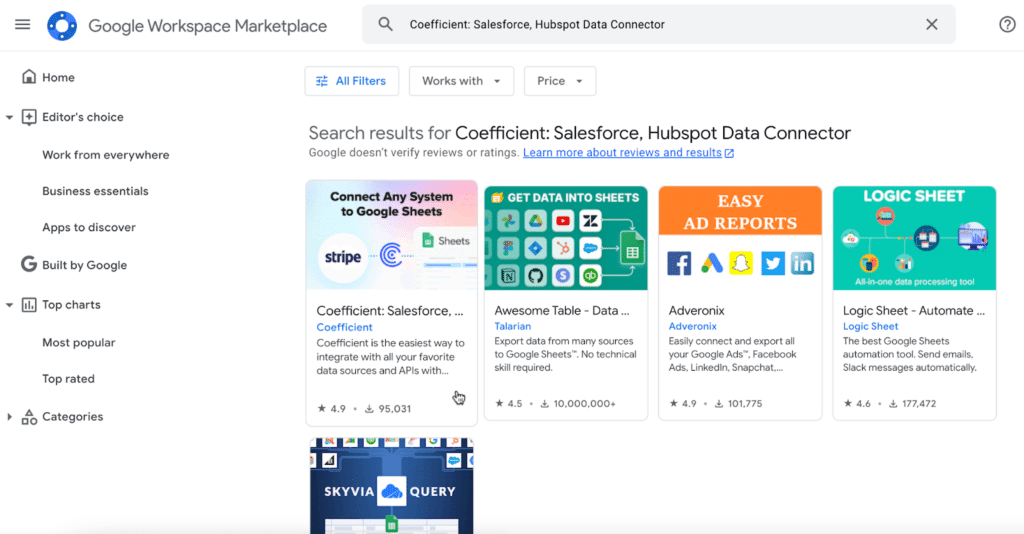
Search for “Coefficient”. Click the Coefficient app.
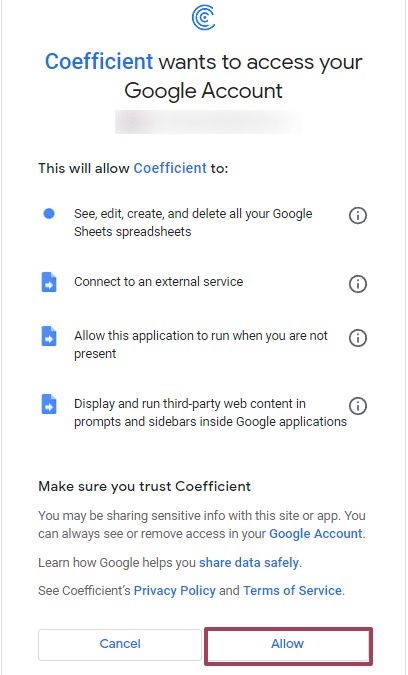
Approve the prompts to install.
Once installation is finished, return to Extensions on the Google Sheets menu. You will see Coefficient available as an add-on.
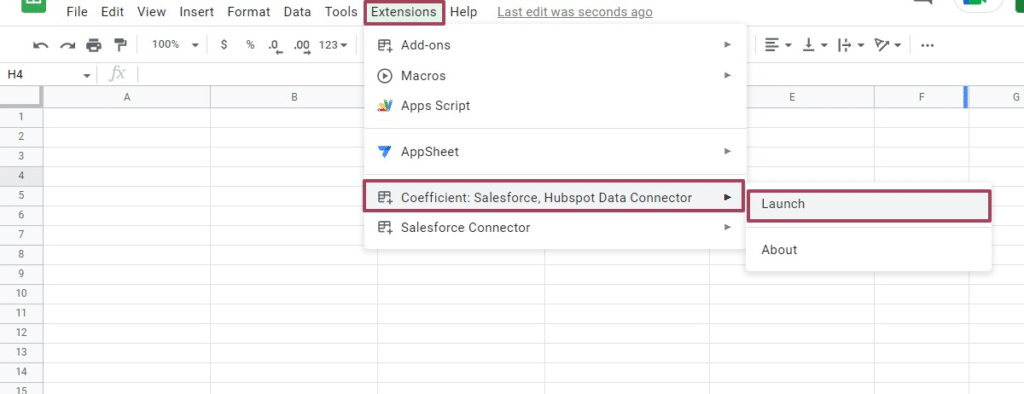
Launch the app. Coefficient will run on the sidebar of your Google Sheet.
Step 2: Select Import From… on the Coefficient sidebar
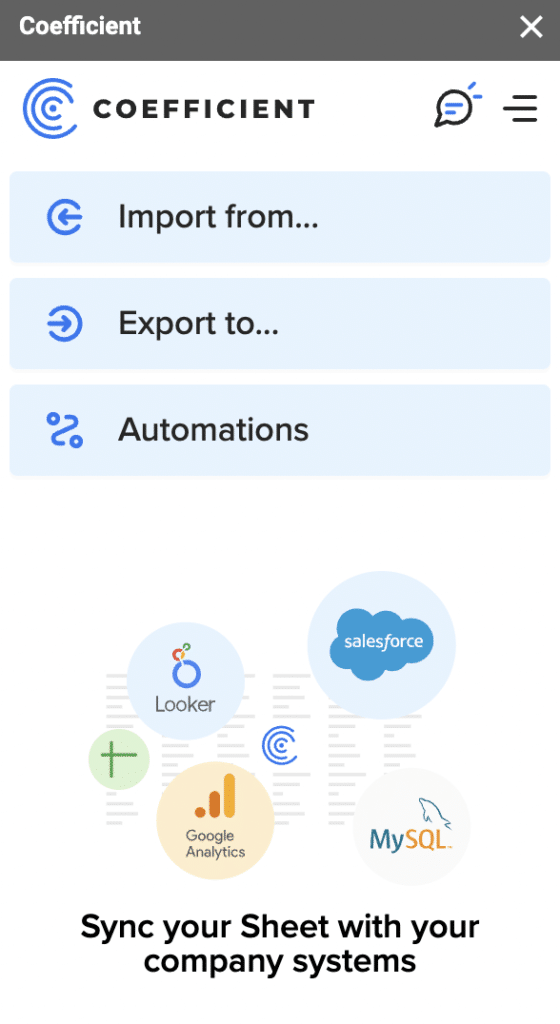
Choose Salesforce as your data source.
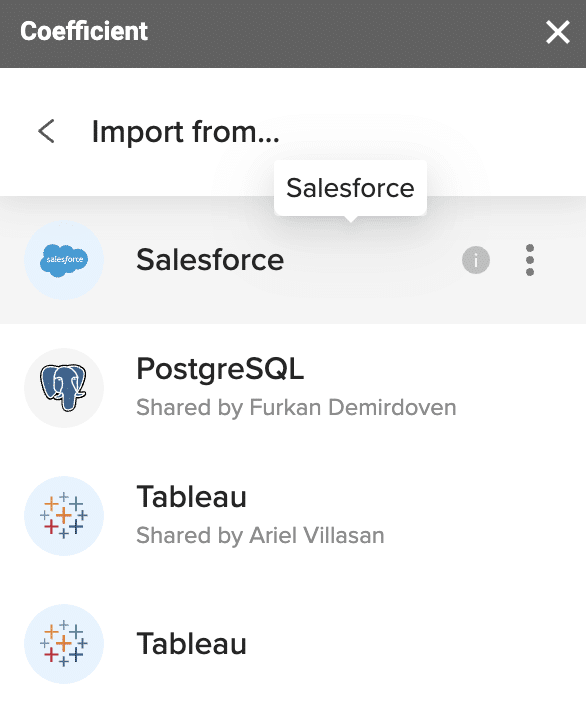
Enter your Salesforce credentials and press authorize. You will enter the “Import Salesforce” tab.
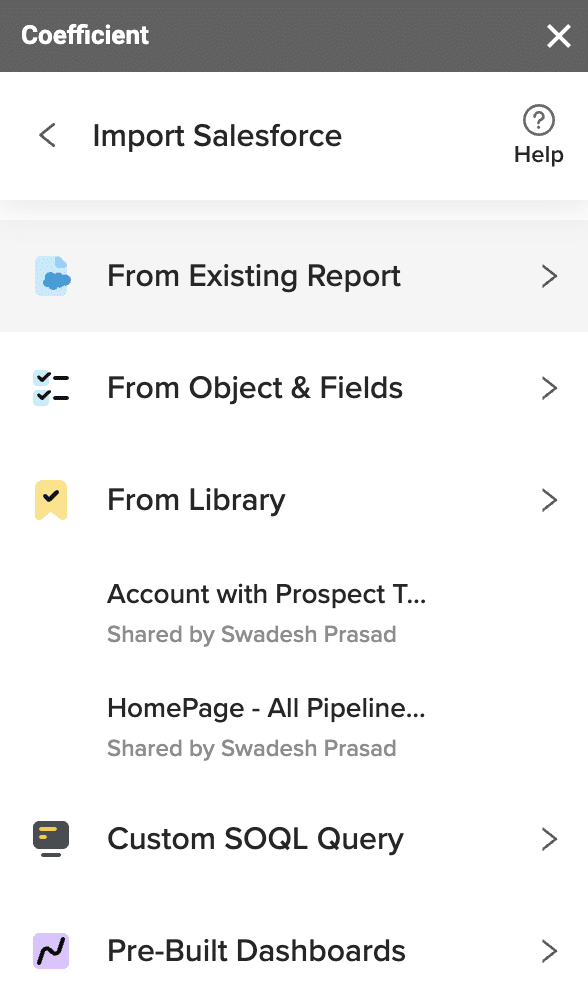
Here, you can choose to import data from a Salesforce report, Object & Fields, custom SOQL queries, or saved library imports.
Choose “From Existing Report” to import your summary report.
Choose your summary report and then click “Import”.
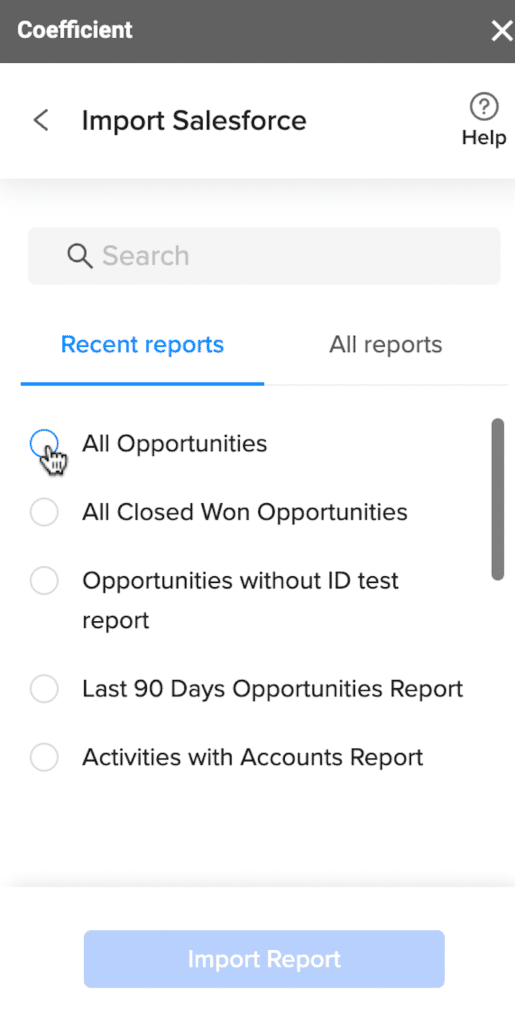
Your summary report will populate in your spreadsheet.
Navigate to the Coefficient sidebar to modify your source report in your spreadsheet.
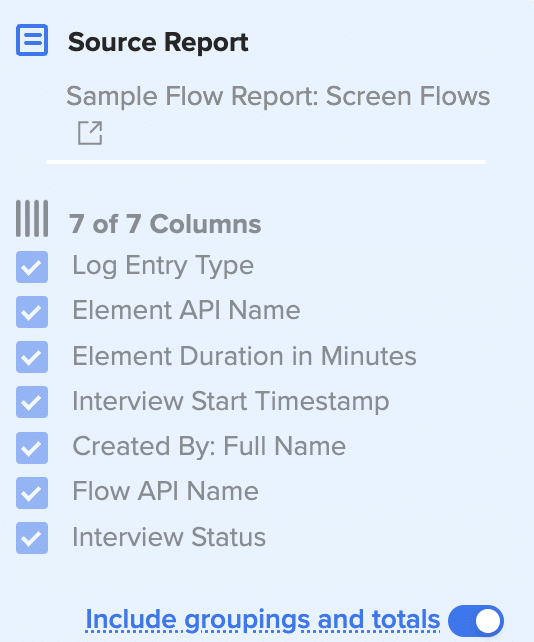
Choose the columns you want to include. Also, turn on “include grouping and totals” to import the raw data behind the summary.
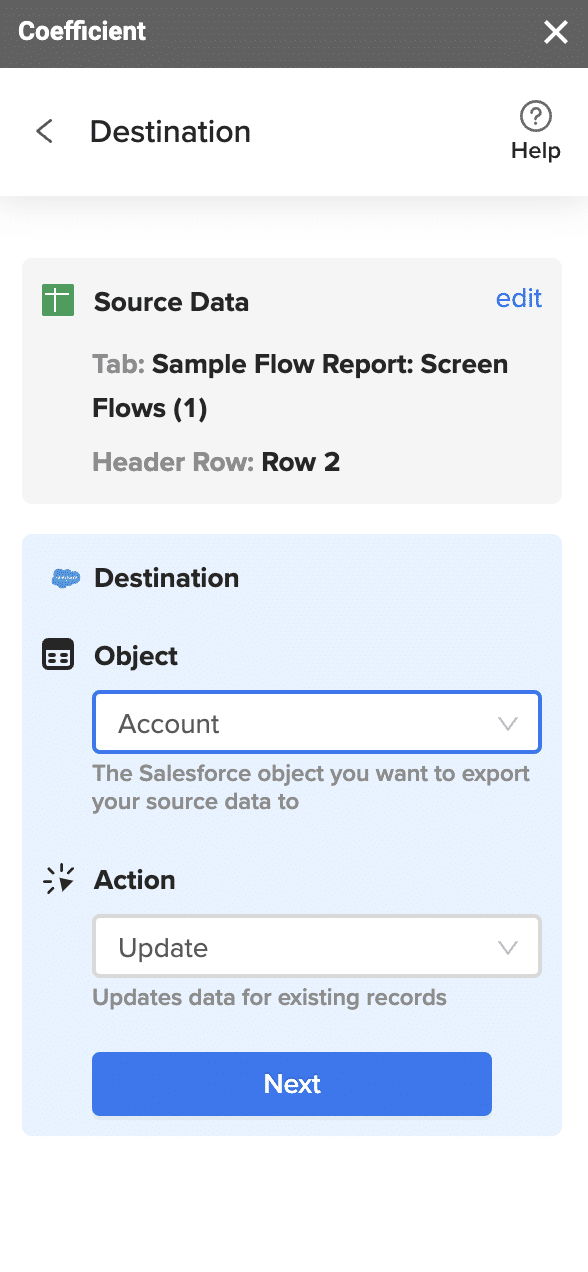
If you modify any of the data, you can export the data updates back to Salesforce CRM directly from Google Sheets.
Next, set up automatic data refreshes.
Coefficient automatically refreshes data to keep your Salesforce data up-to-date in your Google spreadsheet. You can configure your data to auto-refresh hourly, weekly, or monthly.
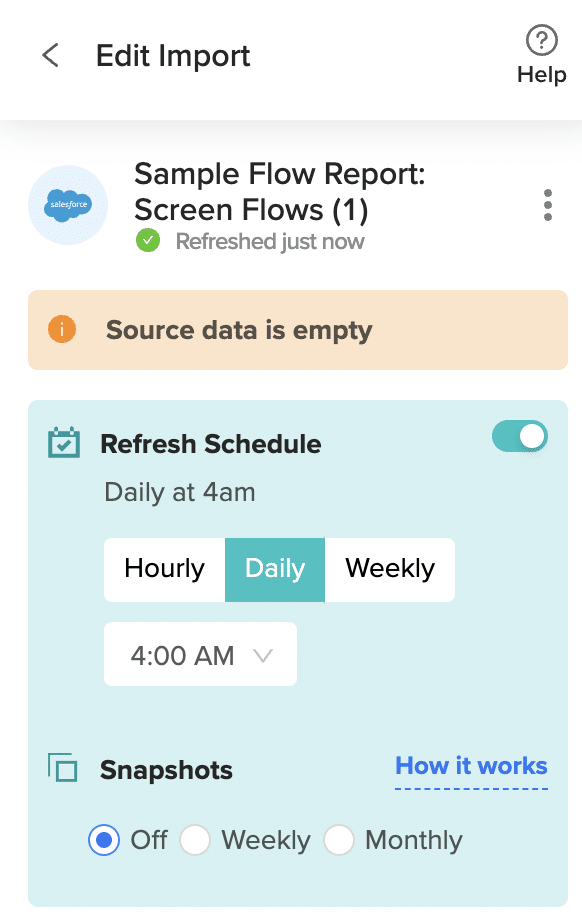
Coefficient also enables you to refresh data instantly by clicking the Refresh button at the top of your imported dataset.
Summary Report Versatility
Summary reports are the most popular report type in Salesforce, and for good reason. They enable you to analyze data grouped in rows, add easy-to-understand visuals in dashboards, and combine charts, summary fields, and bucket fields.
And if you want to make your Salesforce data analysis even more flexible, import your Salesforce reports into Google Sheets and leverage the built-in power of spreadsheets to generate new insights.
Get started with Coefficient for free to pull your Salesforce data into Sheets and conduct advanced visualization and reporting in your preferred spreadsheet platform.


