Need a sales forecasting dashboard? You’re in the right place. Sales forecasting dashboards give revenue teams visibility into future performance, helping them make data-driven decisions about resource allocation, growth strategies, and revenue targets.
This post showcases six exceptional sales forecasting dashboard examples to inspire your own forecasting process. We’ll also explain how to create custom forecasts without the endless manual updates.
Top 6 forecasting reports for high functioning RevOps teams
Revenue operations teams rely on accurate forecasts to align sales, marketing, and customer success efforts. These six templates offer different approaches to sales forecasting that can transform how your team predicts future performance.
12 Month Sales Pipeline Forecast Template by Coefficient
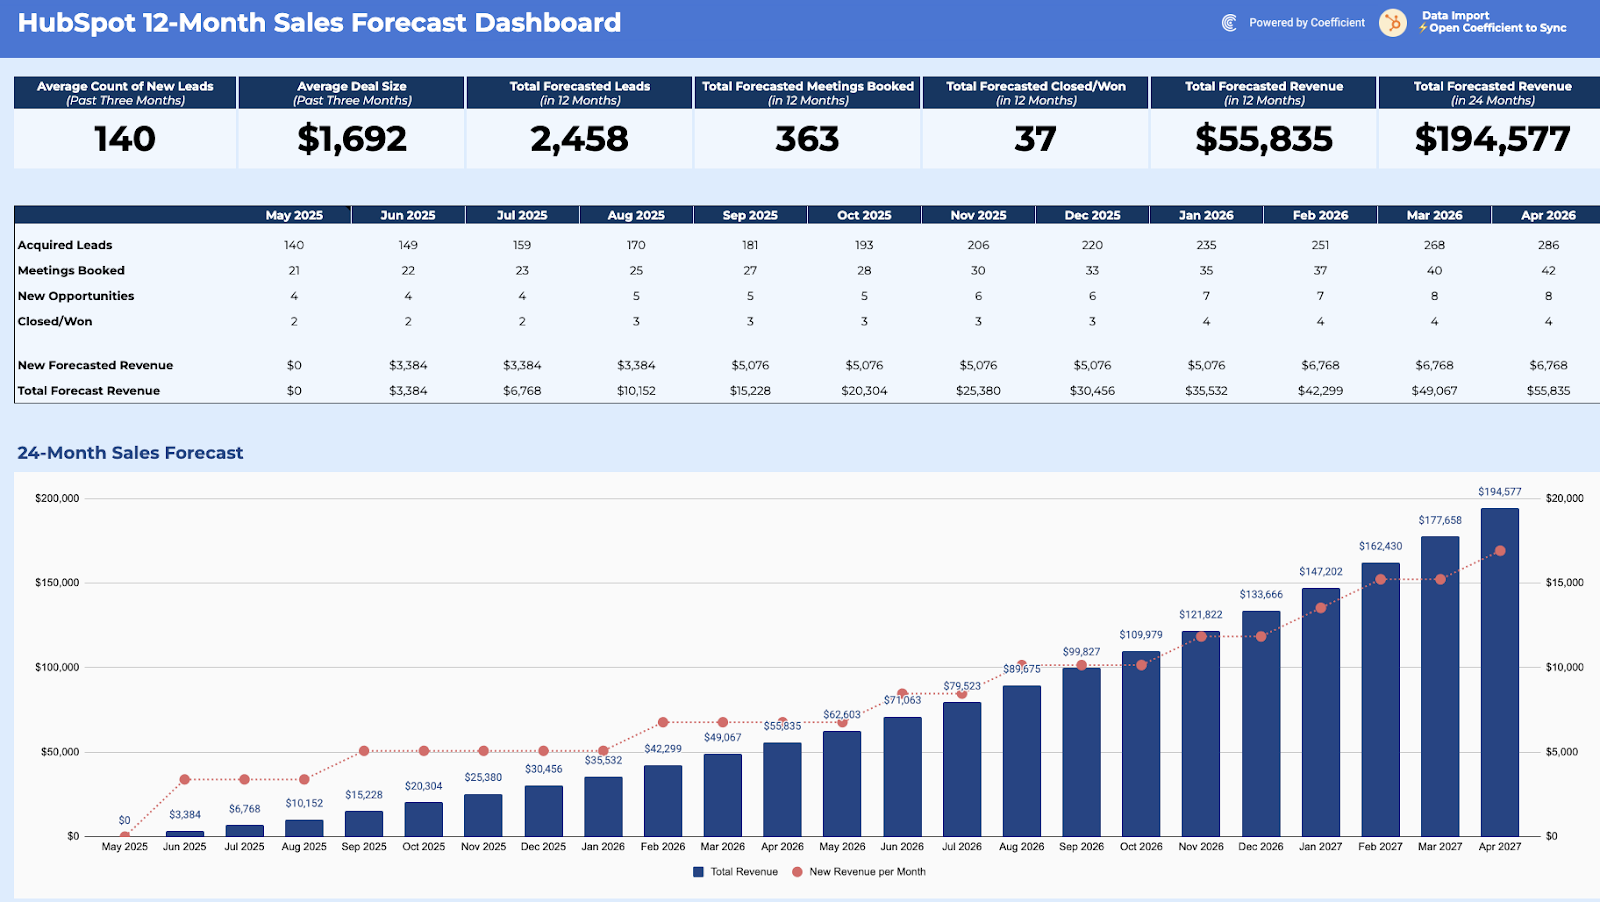
Coefficient’s 12 Month SAles Pipeline Forecast Template gives you a 12-month view of your sales pipeline with built-in forecasting models. Track your deals, conversion rates, and expected revenue with precision.
Key advantages:
- Available in both Google Sheets and Excel formats
- Compatible with three forecasting models out of the box (linear regression, weighted pipeline, and historical performance)
- Connects to live CRM data through Coefficient’s integration
- Automatically refreshes with the latest sales data
- Customizable dashboard views for different stakeholders
The template eliminates manual data entry. Connect your CRM once, and Coefficient pulls your pipeline data automatically. No more copy-pasting or CSV exports. Your forecast stays current without the busywork.
Quarterly Sales Forecast Template by Tableau
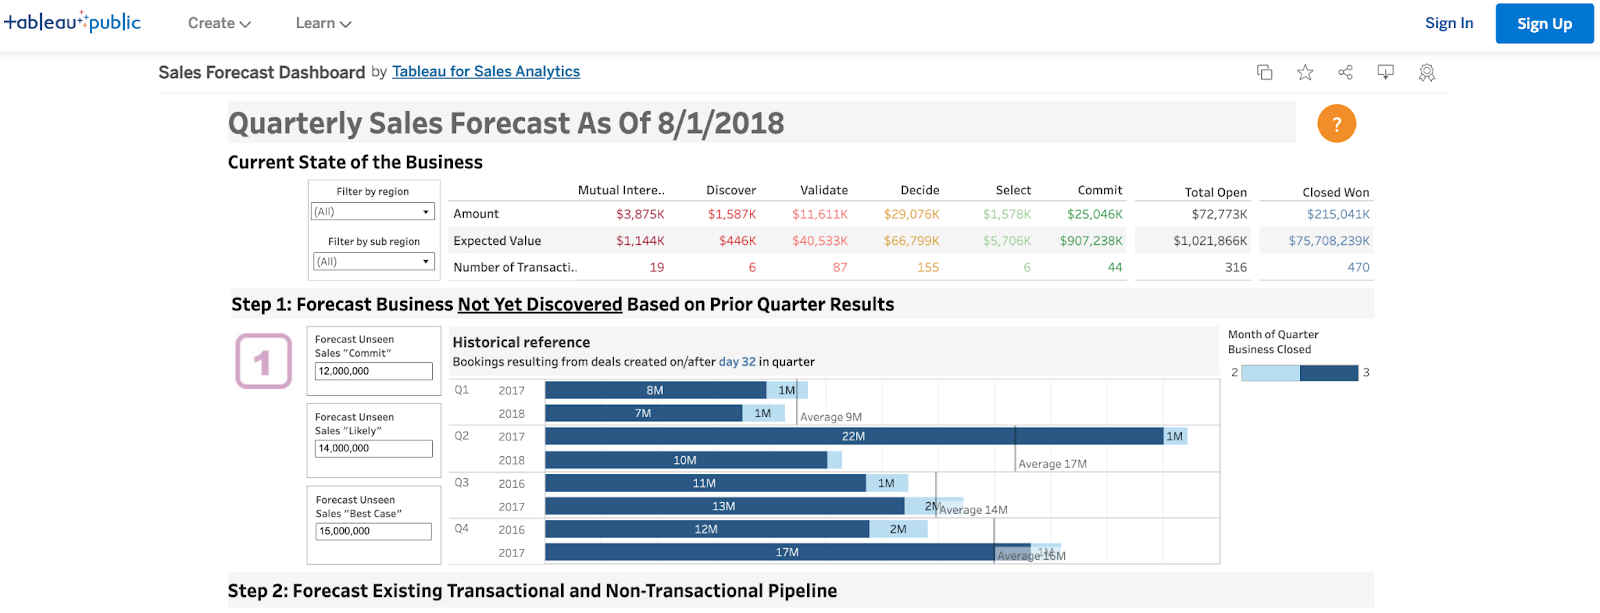
Tableau’s quarterly forecast template offers a visually striking approach to sales prediction. The interactive dashboard allows users to drill down into regional performance, product categories, and individual sales rep contributions.
Key advantages:
- Interactive visualizations that make patterns instantly apparent
- Multiple forecast views (quarterly, monthly, weekly)
- Advanced filtering capabilities for segment analysis
- Historical trend comparisons built in
- Confidence intervals to indicate forecast reliability
This template works well for teams already using Tableau, but requires consistent data preparation to maintain accuracy.
Sales Forecast Template by Salesflare
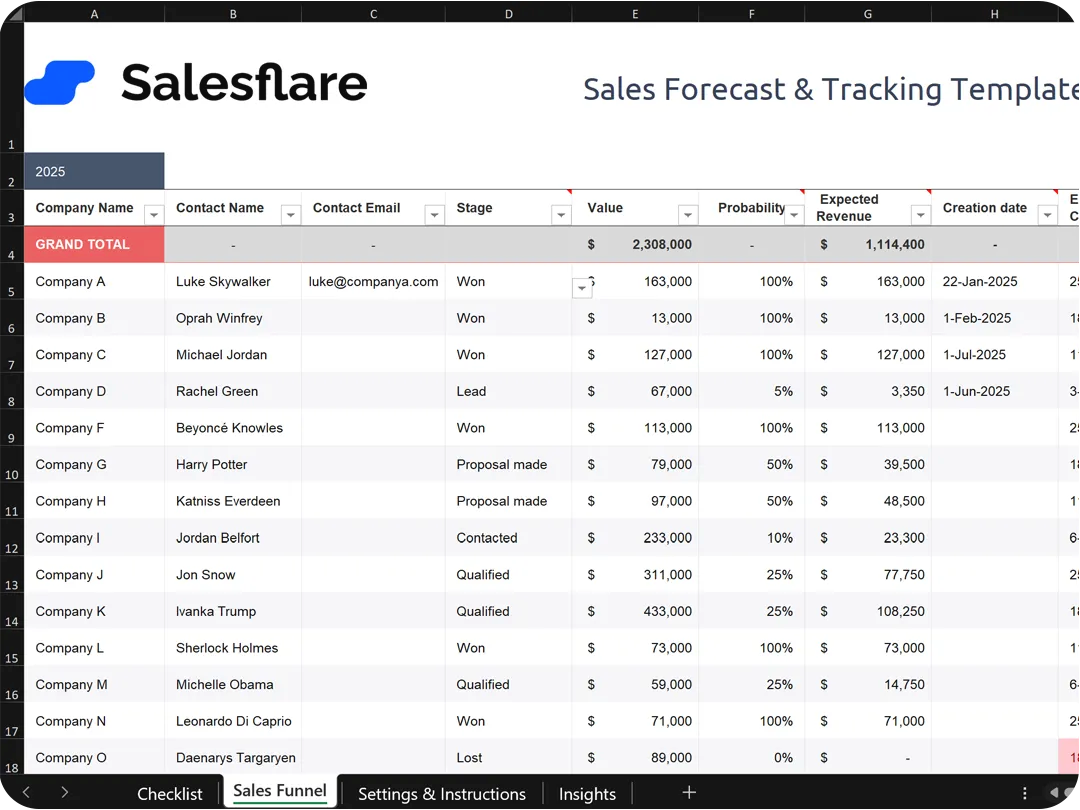
Salesflare’s template focuses on pipeline velocity and conversion rates. It helps sales leaders understand how quickly deals move through each stage and what percentage convert to closed-won.
Key advantages:
- Stage-by-stage conversion tracking
- Pipeline velocity metrics
- Rep performance comparisons
- Probability-weighted forecasts
- Simple, clean interface that’s easy to understand
This template works particularly well for B2B sales teams with longer sales cycles who need to track deal progress across multiple stages.
Sales Forecasting Templates for Retail Businesses by Close.io
Close.io offers a collection of specialized templates tailored to retail business needs. These templates help predict inventory requirements, seasonal fluctuations, and staffing needs.
Close.io provides nine different templates to meet various forecasting needs:
- Basic Sales Forecast Template: Simple forecasting for small businesses just getting started with predictions
- Weekly Sales Forecast Template: Tracks week-over-week performance with rolling forecasts
- Monthly Sales Forecast Template: Perfect for monitoring monthly targets and tracking progress
- Quarterly Sales Forecast Template: Ideal for seasonal businesses and quarterly planning
- Annual Sales Forecast Template: Helps with long-term strategic planning and year-over-year comparisons
- Sales Rep Forecast Template: Focuses on individual performance and quota attainment
- Product Sales Forecast Template: Tracks performance by product line or SKU
- New Business vs. Existing Customers Template: Separates new business from upsells and renewals
- Multi-Channel Sales Forecast: Tracks performance across different sales channels
These templates help retail businesses plan inventory, staffing, and marketing campaigns based on predicted sales volume.
Daily Sales Forecast Template by Smartsheet
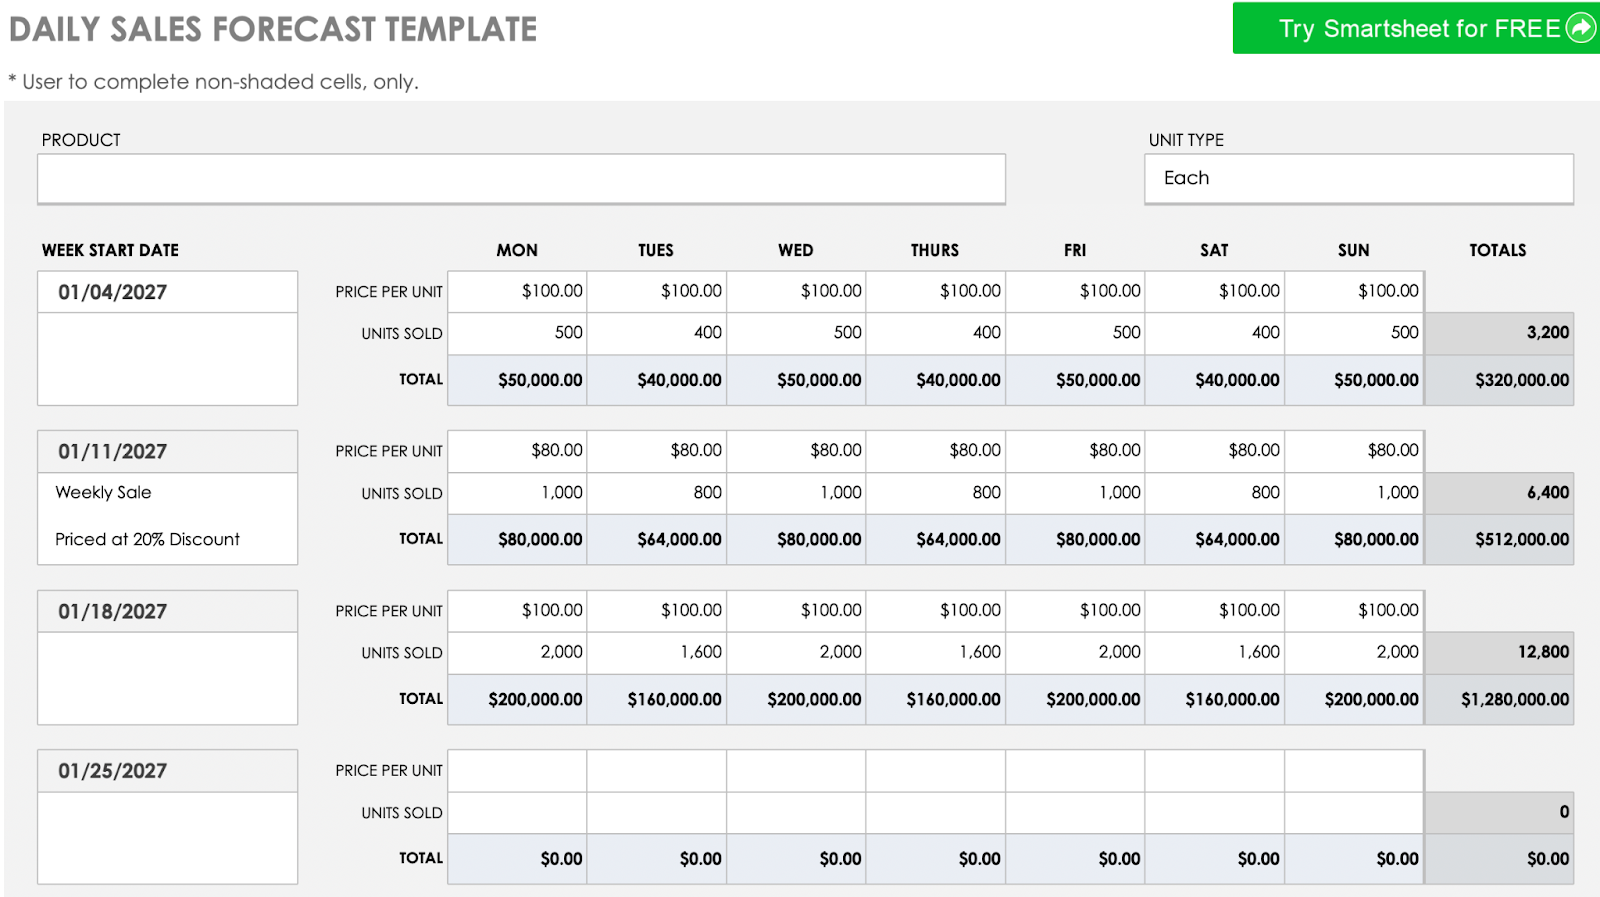
This template provides granular daily forecasting, which is essential for businesses with high transaction volumes or short sales cycles. The daily view helps identify patterns that might be missed in weekly or monthly forecasts.
Key advantages:
- Day-by-day forecasting for precise planning
- Rolling 30-day view to spot trends
- Daily vs. target comparisons
- Customizable for different business units
- Variance analysis built in
This template is particularly useful for retail operations, food service businesses, and companies with seasonal fluctuations that need to track performance closely.
How to create a custom sales forecast template
Want to build your own forecast? Here’s the quick run-down.
TLDR for creating a custom forecast in Google Sheets:
- Create columns for deal stages, amounts, and close probabilities
- Set up a weighted forecast formula (Amount × Probability)
- Add summary tables and charts for visualization
- Connect to your CRM with Coefficient to automate data updates
- Schedule regular refreshes to keep your forecast current
For a detailed breakdown of each step, check out our comprehensive guide to sales forecasting in spreadsheets.
The challenge with custom forecasts isn’t creating them—it’s maintaining them. Manual data entry leads to outdated forecasts and missed opportunities. Coefficient solves this by connecting your spreadsheet directly to your CRM, ensuring your forecast always reflects the latest pipeline data.
Take your sales forecasts from good to great
Sales forecasting doesn’t have to be complicated or time-consuming. The right template combined with automated data connections can transform your forecasting process.
With Coefficient, you can bring live CRM data directly into Google Sheets or Excel, creating forecasts that update automatically. No more manual exports, no more outdated information, and no more questioning if your numbers are accurate.
Ready to build better sales forecasts with your existing spreadsheet tools? Get started with Coefficient today and see how real-time data transforms your revenue predictions.
FAQs
What is a sales forecasting dashboard?
A sales forecasting dashboard is a visual tool that displays predicted sales performance over a specific period. It typically includes charts, tables, and metrics that show expected revenue, pipeline progression, and conversion rates. Effective dashboards highlight trends, compare performance to targets, and provide insights that help teams make informed decisions.
What are the most important metrics to include in a sales forecast?
The most critical metrics for sales forecasts include:
- Expected revenue by time period (weekly, monthly, quarterly)
- Pipeline coverage ratio (total pipeline value vs. target)
- Deal conversion rates by stage
- Average sales cycle length
- Win rate percentages
- Forecast accuracy (comparing previous forecasts to actual results)
How often should sales forecasts be updated?
Sales forecasts should be updated at least weekly for most B2B organizations and daily for high-volume B2C businesses. The key is to refresh your forecast whenever significant new information becomes available. With Coefficient, you can schedule automatic refreshes so your forecast always reflects the most current CRM data.
What’s the difference between bottom-up and top-down forecasting?
Bottom-up forecasting builds predictions from individual deals, opportunities, or SKUs, adding them up to create the total forecast. Top-down forecasting starts with company-wide goals or market size estimates and breaks them down into smaller segments. Most effective forecasting processes use a combination of both approaches to validate predictions.