Overview
If you want to predict a sales forecast effectively, you need to use your historical data to build reliable and comprehensive forecasting models. However, sales can fluctuate due to various trends, seasonality, and other factors, making accurate forecasting challenging. This is where it helps to use exponential smoothing when building a sales forecast in Google Sheets.
The exponential smoothing model allows you to analyze data from specific periods of time by focusing less on older data and more on the latest data. This produces “smoothed data,” making trends and patterns more visible.
In this guide, we’ll dive into what sales forecasting is, the different forecasting methods, how you can build a sales forecast in Google Sheets, and how exponential smoothing can be ‘exponentially’ better (see what I did right there?)
What is Sales Forecasting?
Sales forecasting refers to the process of predicting your future revenue by using a combination of data, experience, and gut. We are going to focus on the data side of the equation in this article. Sales forecasts are anticipated measures of how prospects and customers will respond to your company’s go-to-market initiatives.
Sales forecasting uses historical data and specific assumptions to identify trends that you can project into the future. This allows you to understand your sales operations better, from adjusting your budgets to anticipating future sales and expenses.
While forecasting can give you invaluable information and insights, it doesn’t exactly tell you the future or the definitive method to carry out actions and strategies.
At most, it provides you with the probabilities, giving you ideas on the best course of action. This makes it crucial to verify your sales forecast before deciding and acting.
Why use Google Sheets?
Google Sheets offers features that allow you to store, organize, calculate, and visualize data (among other things), and it includes several tools for forecasting.
You can also connect Google Sheets to external databases or import files. This allows you to perform a sales forecast even if your data comes from other sources and use the spreadsheet app’s built-in forecasting formulas and tools.
Google Sheets is easy-to-use, and you can visualize your sales forecasting data with ease using the app’s charts and customization features.
Forecasting Methods and Forecasting in Google Sheets
While there are many sales forecasting methods you can do in Google Sheets, let’s focus on three of the most commonly used quantitative forecasting methods using spreadsheets.
Moving averages
A moving averages method smooths out trends, such as a time series, within your data. Essentially, it is the average of any subset of numbers.
The goal is to strain out micro deviations from a sample time range so you can uncover longer-term trends that may potentially impact future results.
You can calculate the simplest form of a moving average by computing the mean of your given set of values for any period of time.
For instance, using a 20-year period of sales data, you can use the method to calculate a five-year moving average (four, three, and so on).
The moving average is the same, but the average (which represents the “middling” value of a particular set of numbers) is calculated a few times for multiple data subsets.
Exponential Smoothing Forecast (ETS)
Exponential smoothing is a forecasting method that analyzes data from particular periods of time and generates data without the “noise,” making trends and patterns more visible.
The method puts more weight on the most recent sales data than on older data. For instance, if you want to analyze 12 months’ worth of your company’s sales revenue using exponential smoothing, the method’s formula will assign more weight to your previous month’s earnings than last year’s.
Exponential smoothing lets you choose the amount of weight to place on your latest sales data by selecting a smoothing constant between .1 and 1 in your exponential smoothing formula.
The higher the constant value, the more weight assigned to your recent data.
Several exponential smoothing techniques include:
- Simple or single exponential smoothing. This technique uses a weighted moving average and exponentially decreasing weights.
- Holt’s linear trend or double exponential smoothing. The technique uses a level and trend component at each period of time. It also uses two weights (or smoothing parameters) to update components at each period. It is usually a more reliable technique to handle data showing trends.
- Triple exponential smoothing. This technique is the most advanced exponential smoothing variation and is more suited for data showing trends and seasonality or parabolic trends.
Linear regression
The FORECAST function in Google Sheets predicts future values using linear regression to determine the linear relation between value series and timeline series.
Regression is used to predict values, simple market trends, inventory requirements, and sales growth.
While a linear regression approach can be unsuitable for data with seasonality or non-linearity, it is effective for causal models because of its simplicity.
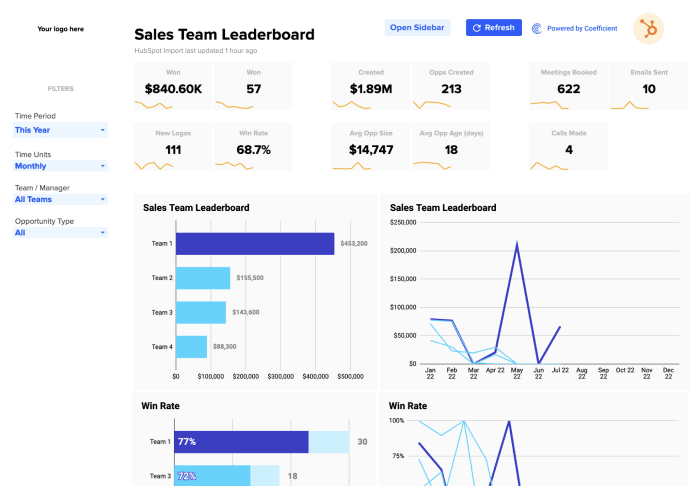
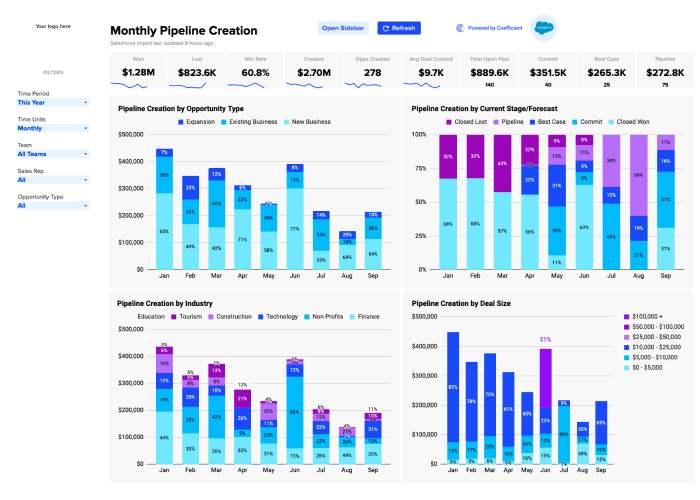
Looking to up your sales reporting game? Browse the Google Sheets dashboard gallery, make a copy of the reports you need, and sync your live CRM data in a few clicks.
How to do a Sales Forecast in Google Sheets
While there are several sales forecast methods you can perform in Google Sheets, exponential smoothing is one of the most commonly used because of its flexibility and ease of calculation. Want to get started quickly? Check out our pre-built Google Sheets sales dashboards.
Follow the steps below to conduct your first sales forecast in Google sheets using the exponential smoothing technique.
Step 1: Create or open your data set in Google Sheets
Let’s assume we’re using a Software as a Service (Saas) company’s historical data of monthly sales with one column showing the month and the corresponding amounts.
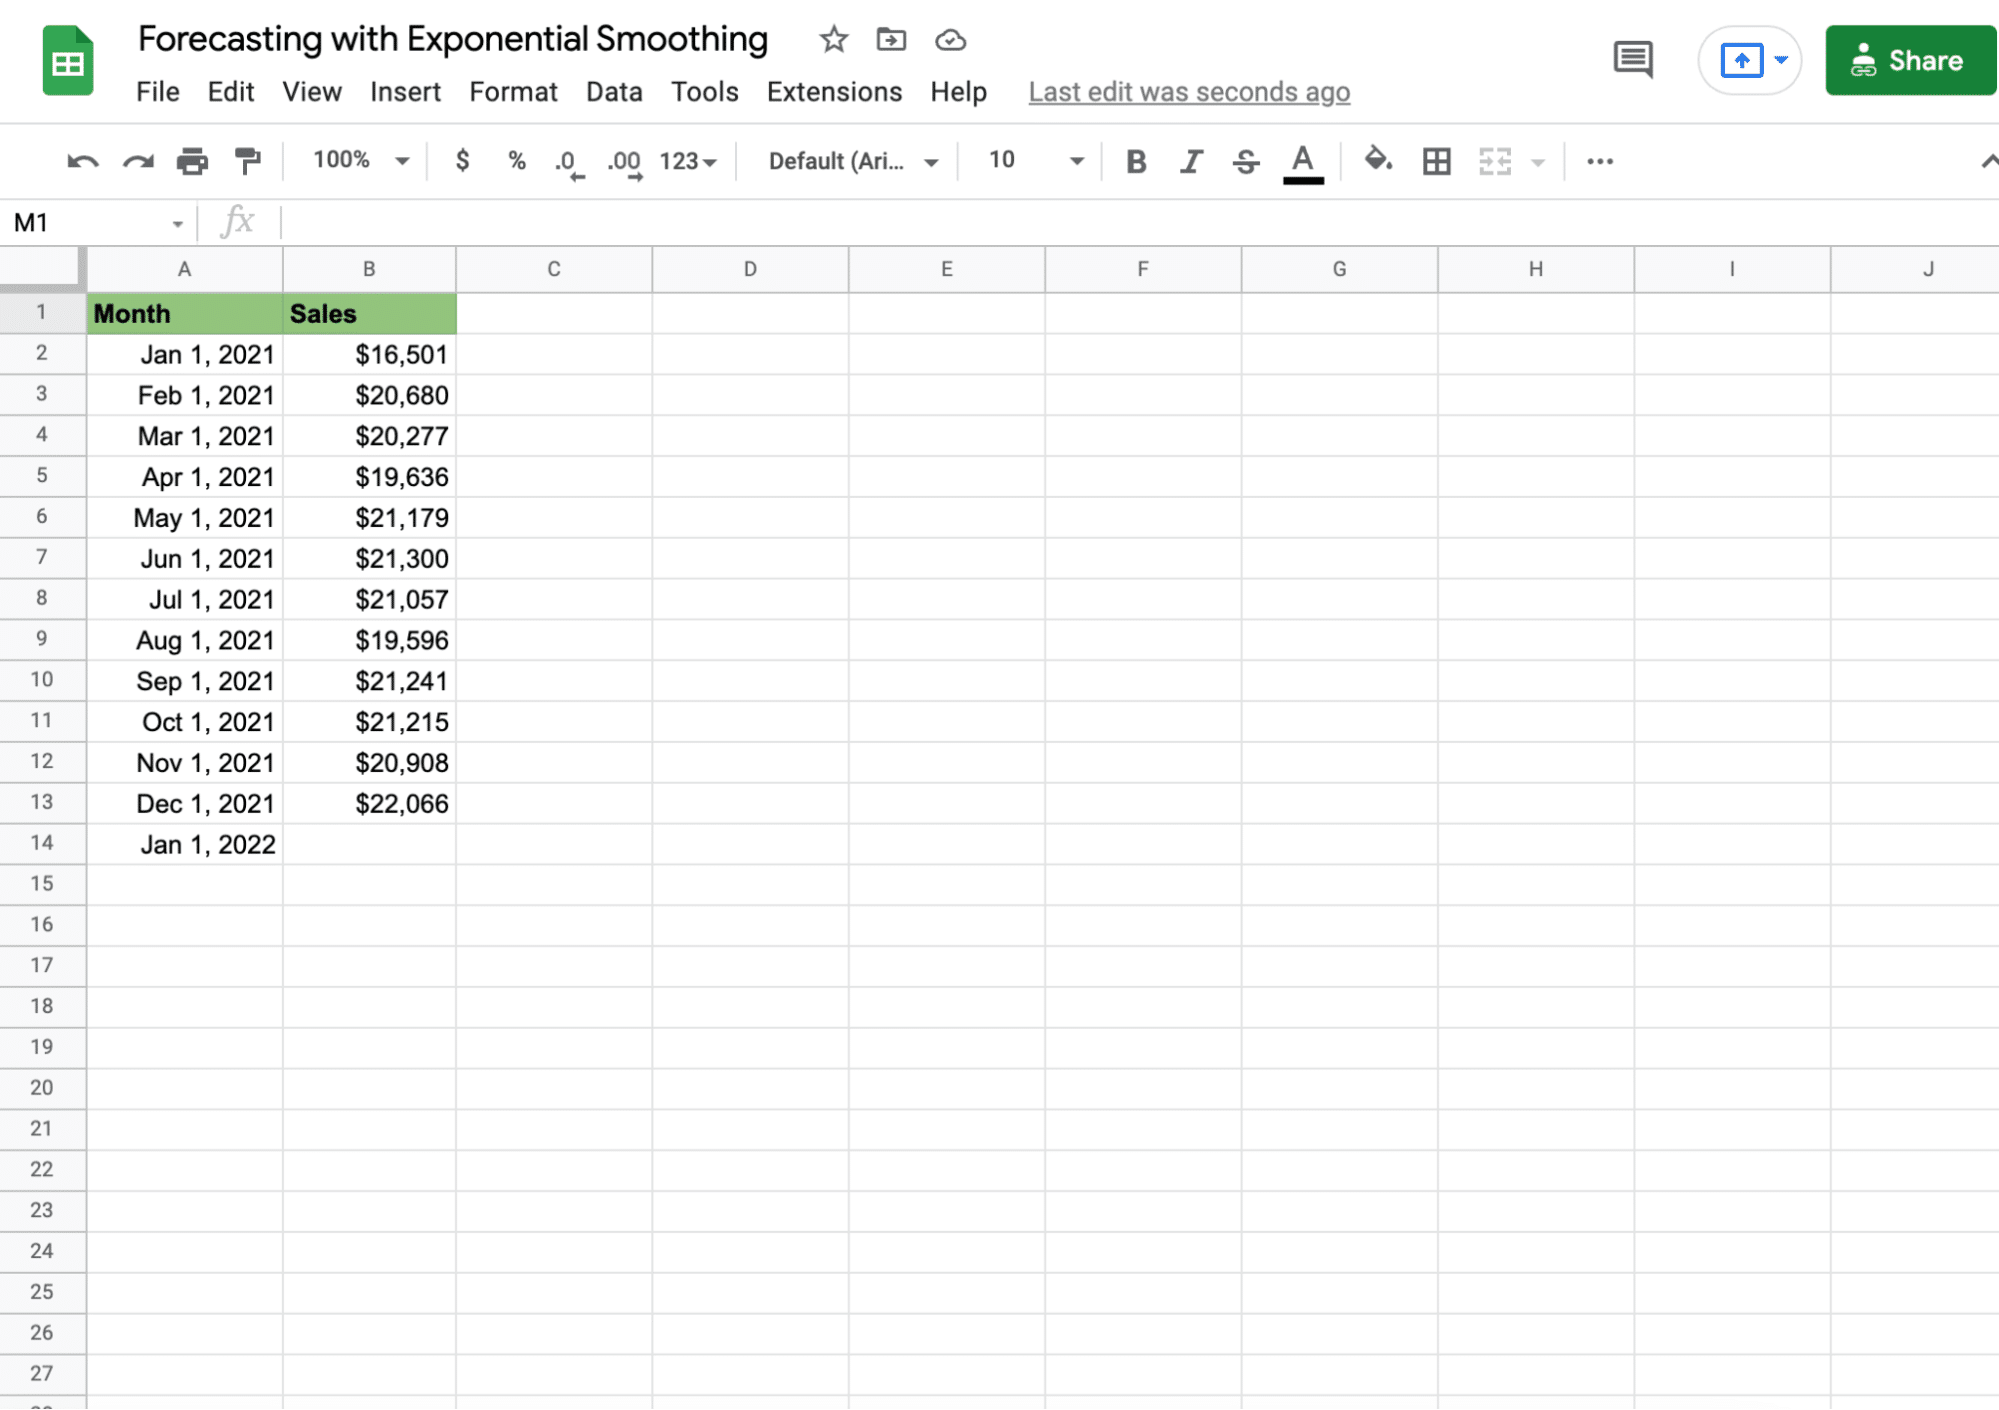
We’ll use the sales data from the past twelve months to forecast revenue for January 2022 quarter one.
Step 2: Access the XLMiner Analysis Toolpak pane
The XLMiner Analysis Toolpak is a Google Sheets add-on that includes an exponential smoothing feature.

Stop exporting data manually. Sync data from your business systems into Google Sheets or Excel with Coefficient and set it on a refresh schedule.

If you don’t have it installed, you can go to the Google web store, search for XLMiner Analysis Toolpak, click Install, and the add-on gets added to your Google Sheets account.
Once installed, go to Add-ons on the Google Sheet Menu, navigate to XLMiner from the dropdown, and click Start to display the pane.
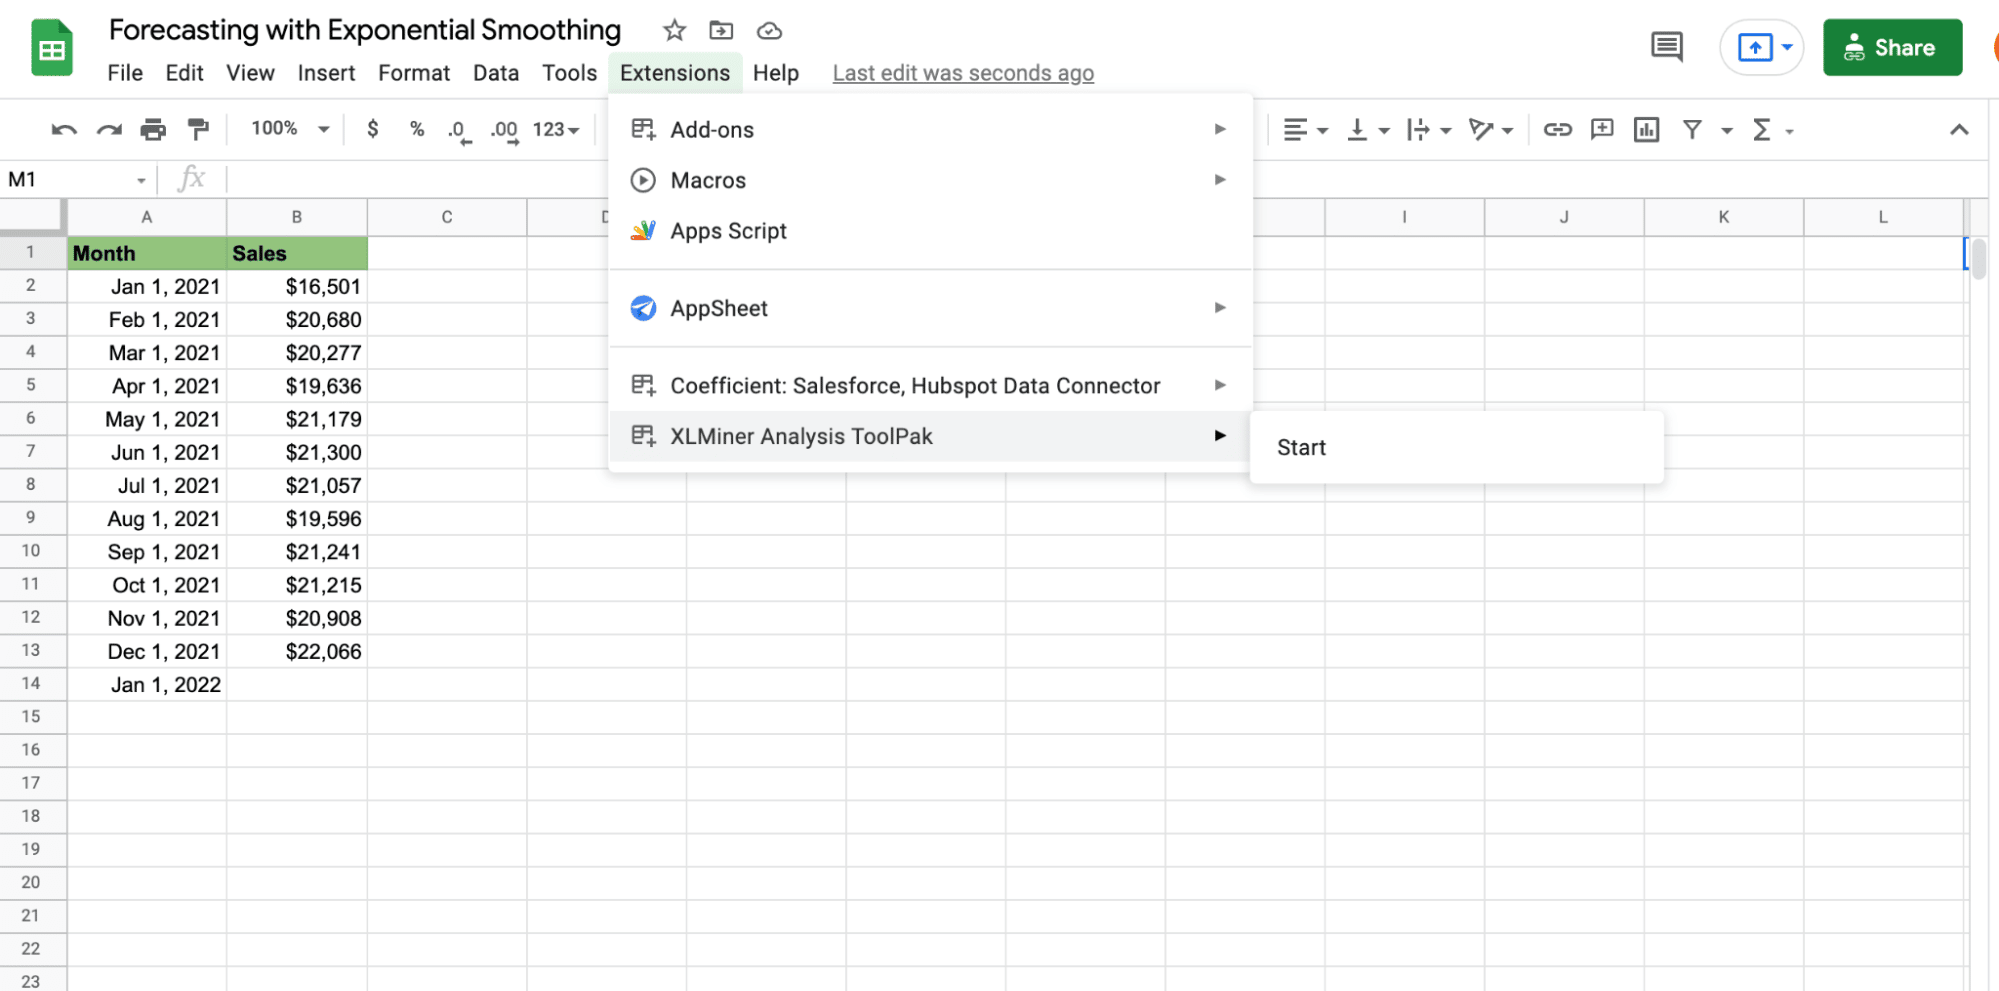
Highlight the input range field, cells B1 to B13. In the XLMiner Analysis Toolpak pane, select Exponential Smoothing, and it will auto-populate the Input Range field.
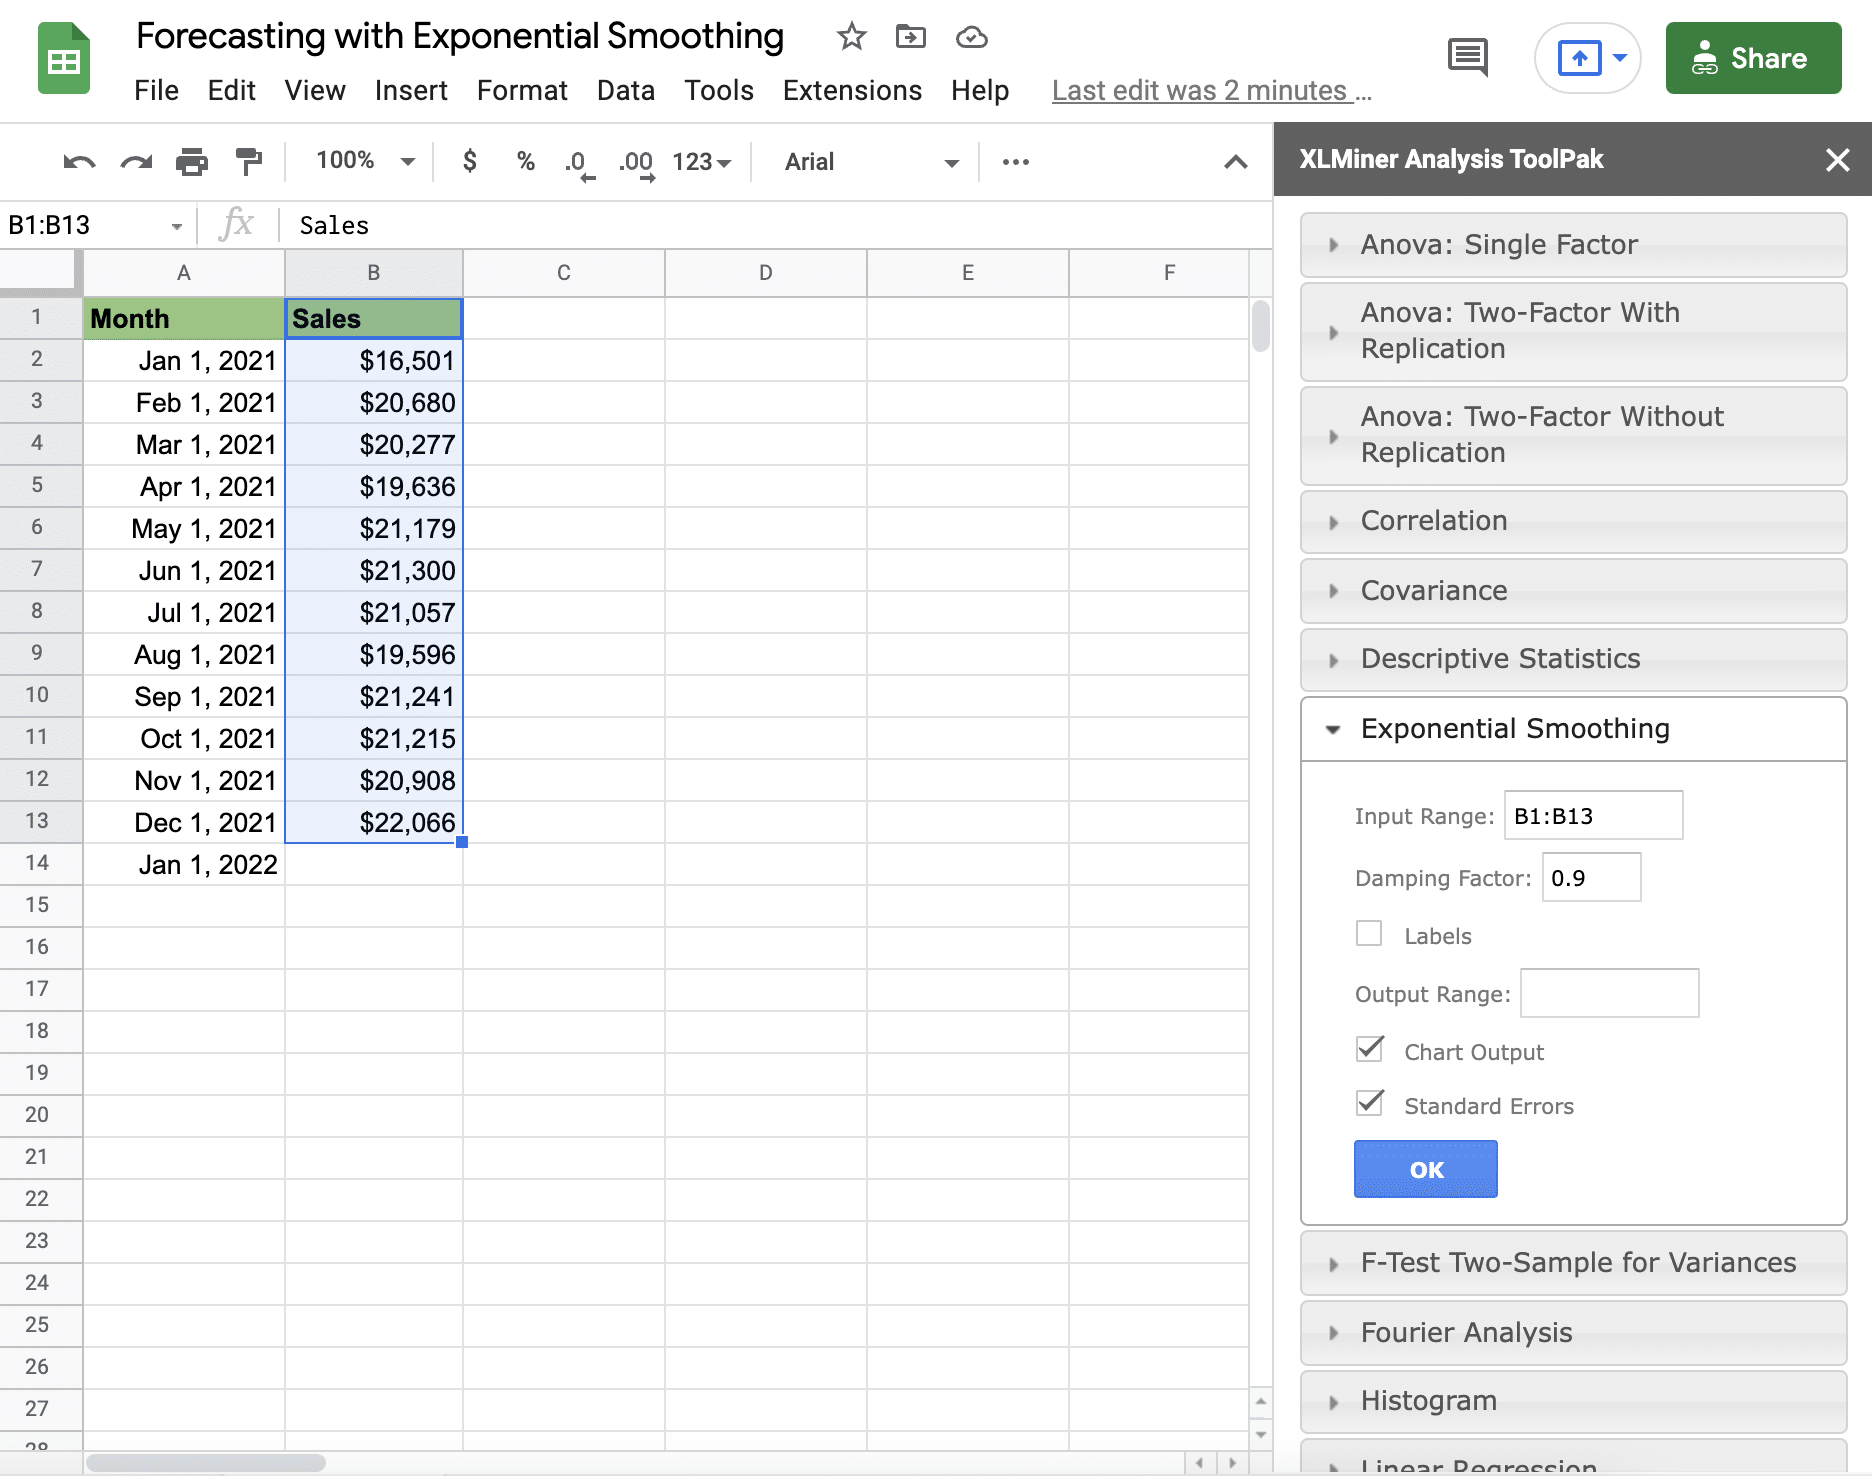
Step 3: Enter a damping factor
Add a damping factor, which is scored on a scale of 0 to 1 and is a reference to the weight placed on your latest sales results.
Companies working in industries that experience regular unpredictable sales spikes are better off using somewhere between 0 to 0.5 for steadier exponential smoothing.
Businesses in industries with unprecedented sales increases should emphasize more on the last two to three time periods and should consider going for a number between 0.6 to 1. In this example, let’s use 0.25.
Select Labels since the first row in your data range includes your column label. On the Output range, enter or select the C1 cell.
You can also keep the Standard Errors to include displaying them in your report. Click OK, and this should generate your sales forecast.
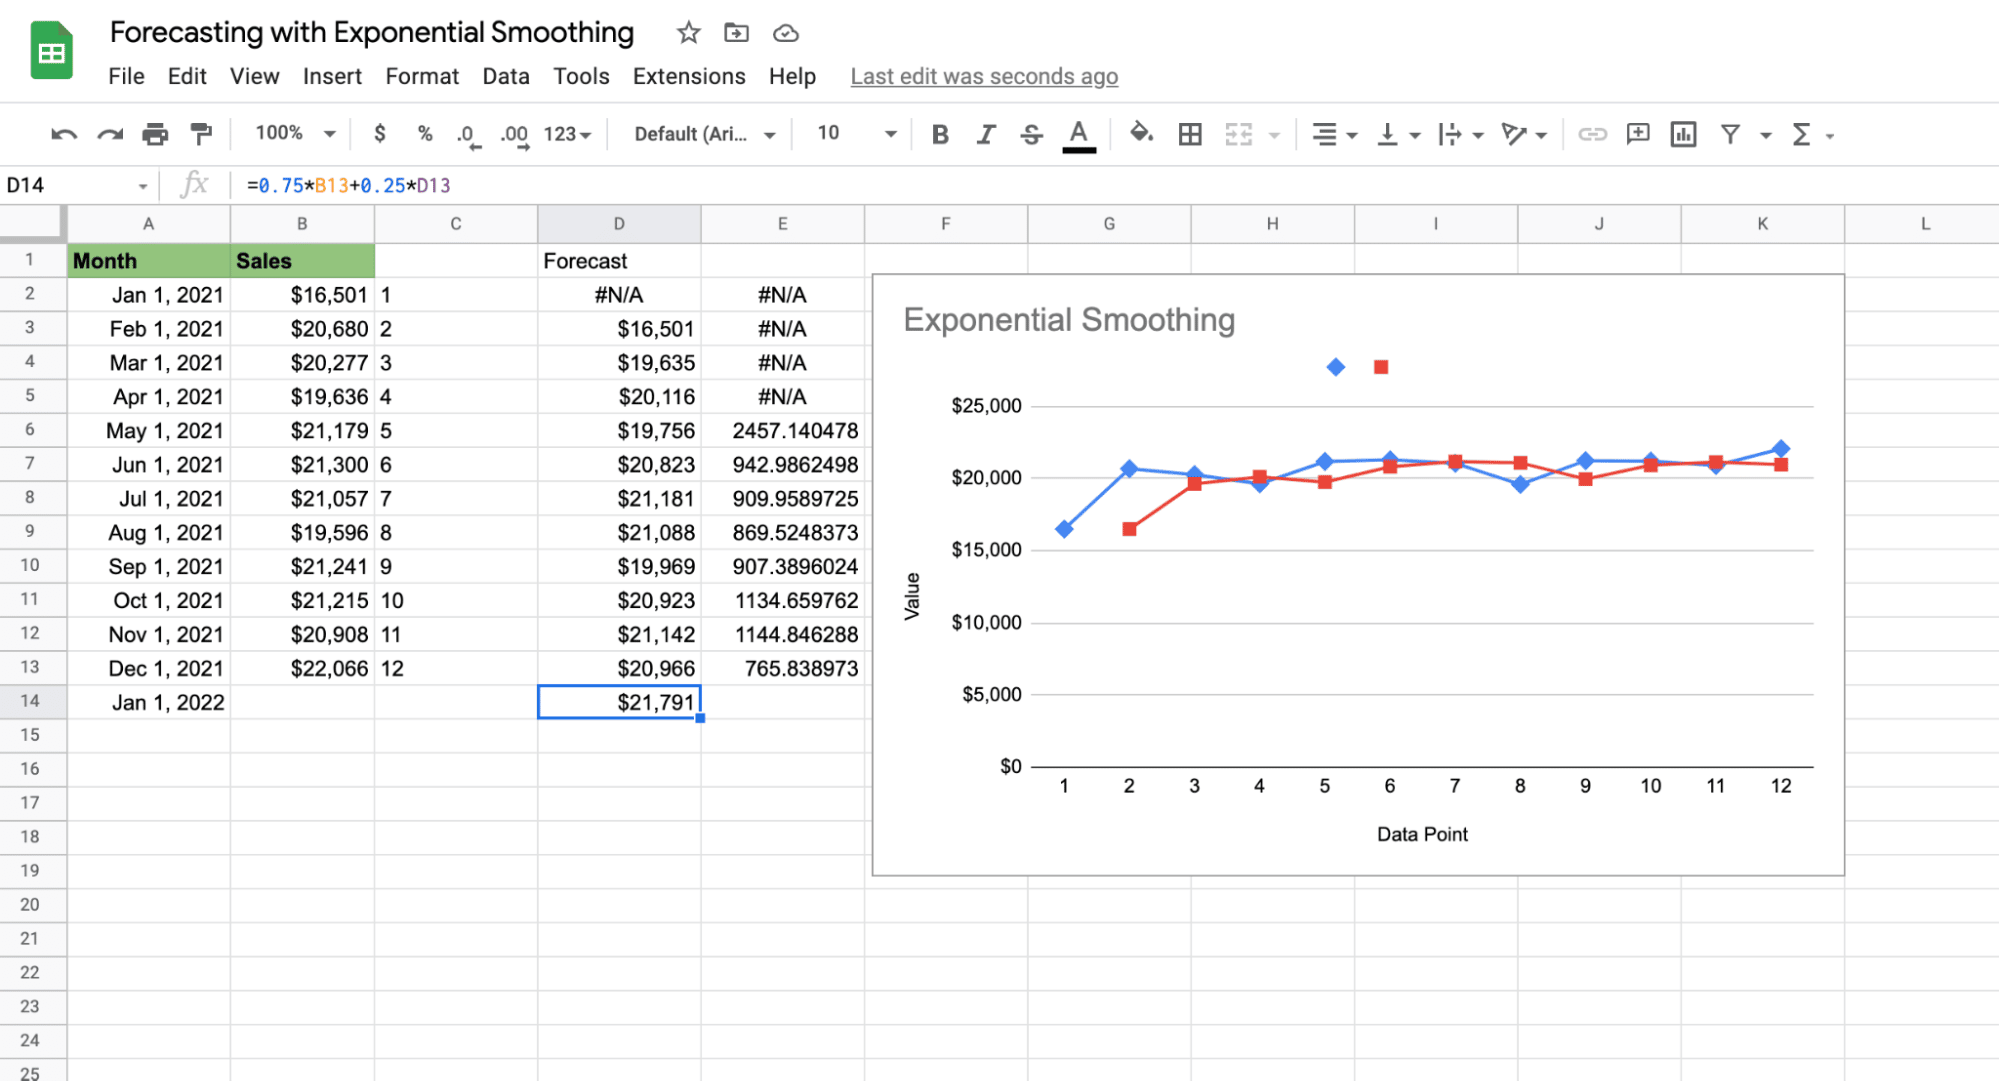
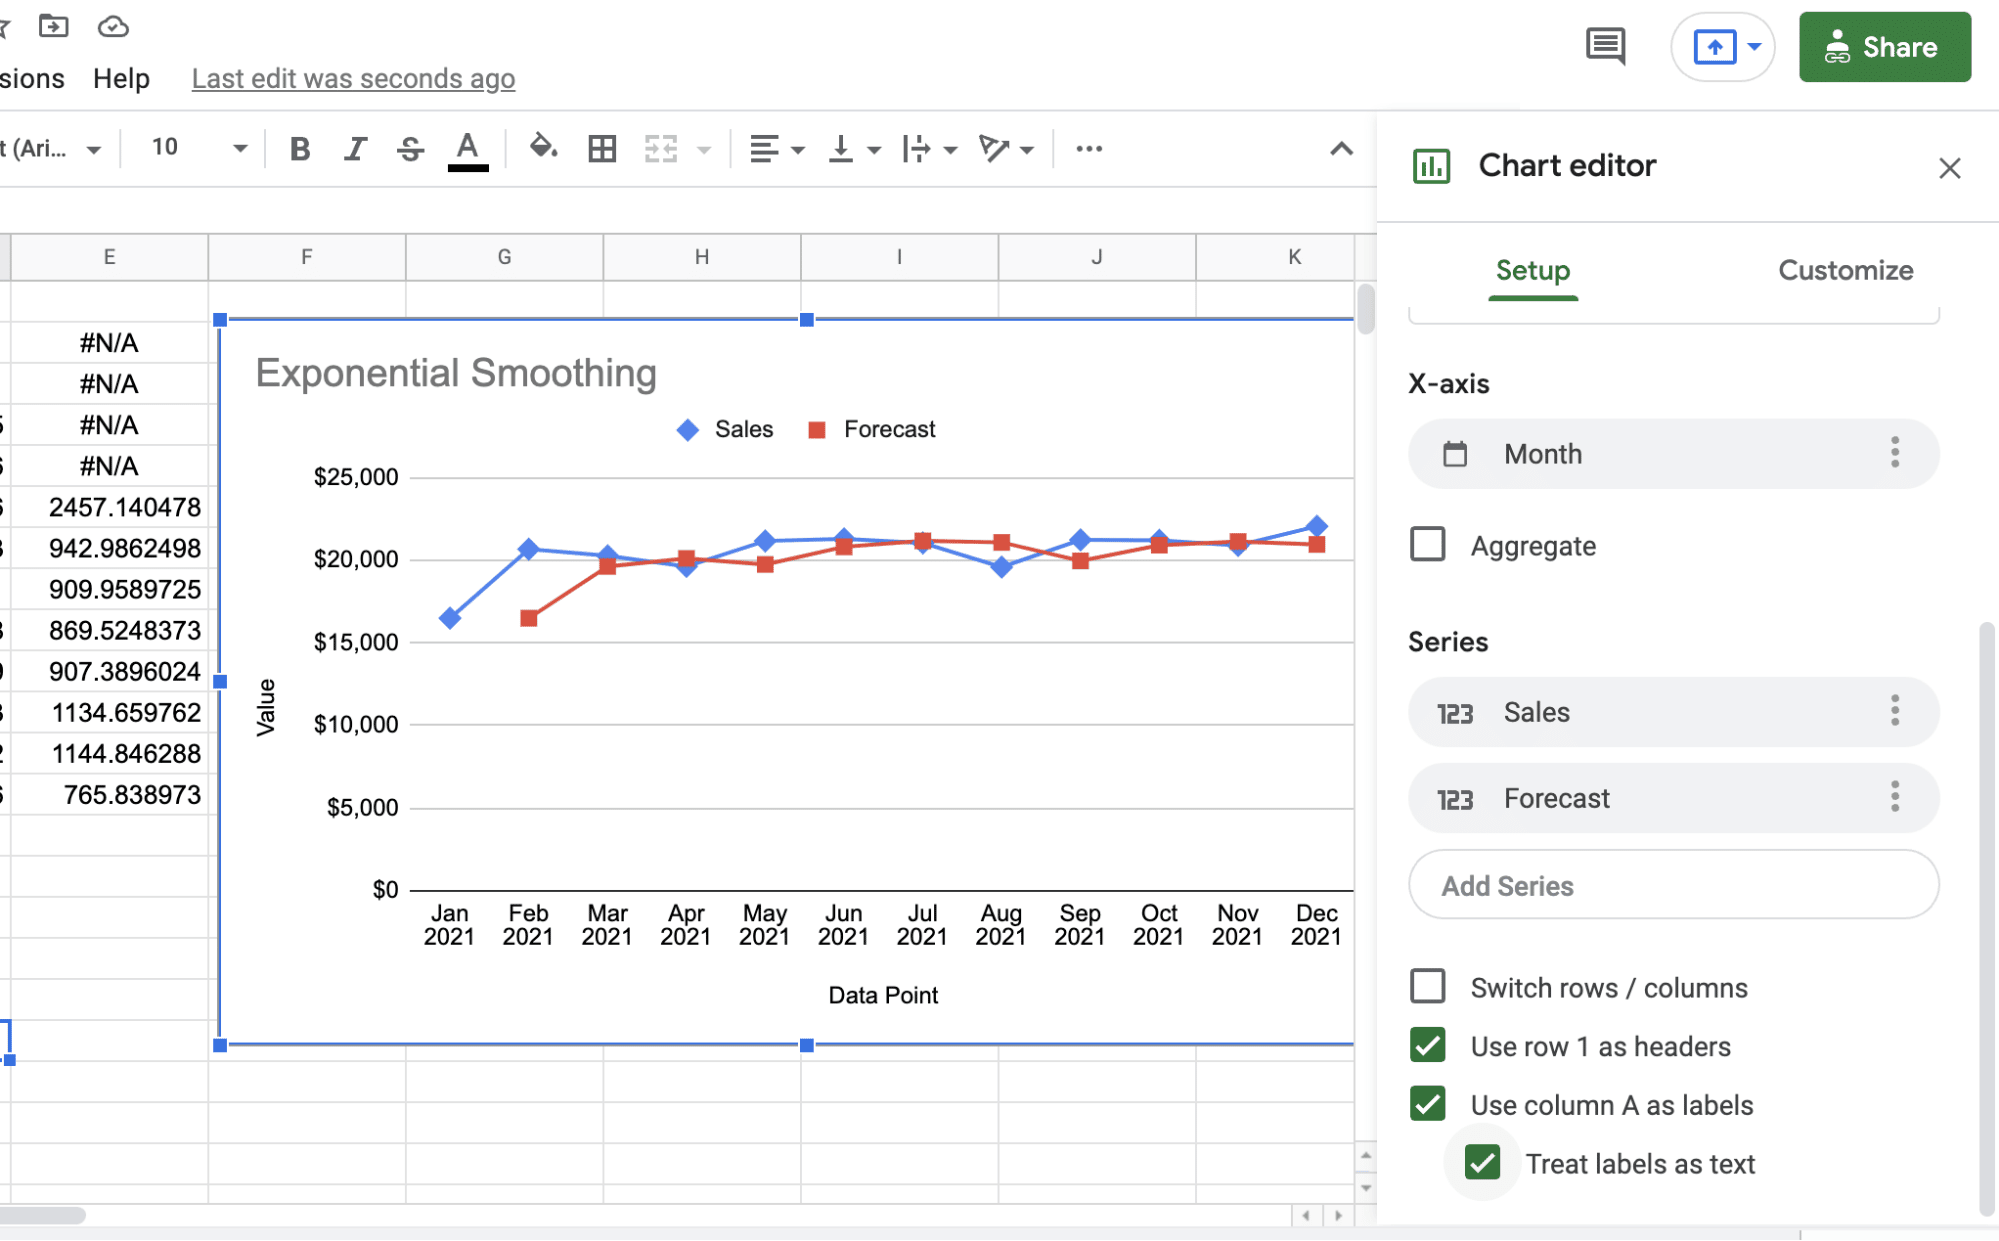
To make the chart nicer, open chart settings by clicking on the chart and opening the Setup tab. Then change the X-axis range from C1:C13 to A1:A13 so months are displayed along the bottom axis. Then, check the box “use row 1 as headers” to label the 2 lines on your chart.
The exponential smoothing forecast is a set of predicted revenue in column D and the visualization of this data is through a line graph.
To get the forecasted revenue amount for January-21, click the forecasted amount for December-20 (D12 cell), hover to the bottom right corner of the cell, and drag it down to the D13 cell to automatically fill it with the forecasted data (in this case, $21,791.08).
The N/A errors displayed in the D2 and E2 to E5 cells are caused by insufficient historical values required to calculate a standard error or project a forecast.
To make your sales forecasting process even easier, use Coefficient to sync Google Sheets to your company systems such as Salesforce, HubSpot, Google Analytics, Looker, MySQL, Redshift, Slack, and more.
You can easily import and work with your data in real-time using Coefficient without leaving your spreadsheet. You can also set slack and email notifications on changes in your forecast directly from Google Sheets.
Once you install the Coefficient add-on to your Google Sheets account, launch it from the Add-on option in the spreadsheet’s Menu.
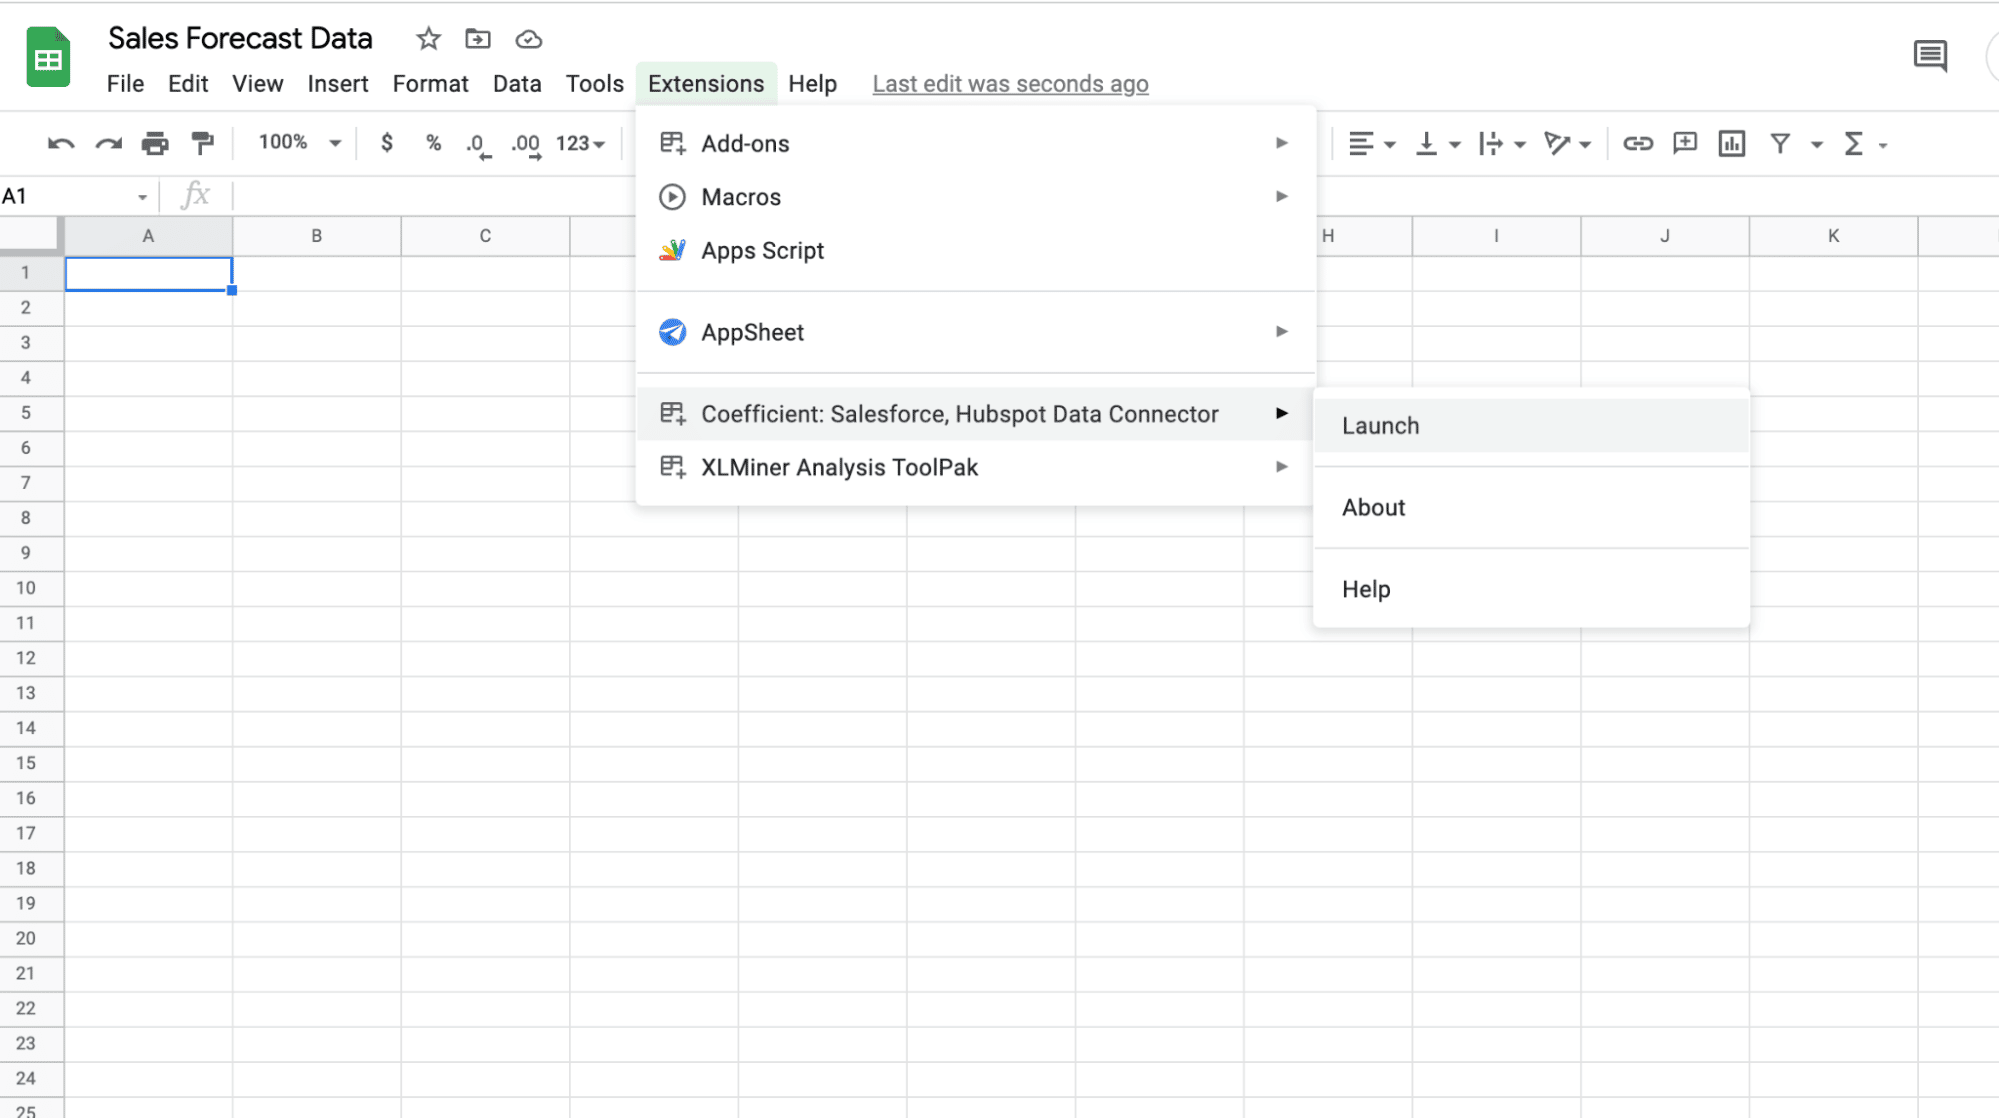
In the Coefficient UI, click Import Data and select the data source that you will use for your sales forecasting in Google Sheets.
Coefficient allows you to customize your imports, so you can work with only the data you need for your sales forecasting, saving you time and effort. Once you have automated your sales data using Coefficient, you can follow the steps discussed above to conduct your sales forecasting using the exponential smoothing and other forecasting methods you prefer in Google Sheets.
An Exponential Smoothing Forecast Should be In Your Toolkit
Sales forecasting sits at the core of every business as it can help you determine how much revenue you will generate, and how to take action if you are going to fall short. This helps you determine how many more leads, opportunities, and deals you will need to hit your number. If you can do this early enough then you can change course if necessary. When you do sales forecasting right, you’ll gain access to a treasure trove of information and insights that will help improve your sales operations and business decision-making.
Try Coefficient for free today!

