Table of Contents
![]()
-
Automate financial reporting in Excel: Tools, formulas and best practices
- Why automate financial reporting in Excel?
- What types of financial reports can you automate?
- Essential Excel formulas for automated financial reporting
- Using Power Query to automate data preparation
- Live data connections: The ultimate automation
- Step-by-step: Automating your first financial report
- Tools comparison: Manual vs. Power Query vs. live connections
- Future of automated financial reporting: AI agents
- How to overcome common finance reporting problems in Excel
- Start automating your financial reports today


Finance teams waste days each month on manual reporting. CFO Mike Lynch at Thornton Capital spent up to 10 days downloading reports, re-uploading data into Excel, and fixing broken formulas. Even Power BI and Power Query attempts failed because they were too complex and broke when data changed. According to the 2025 State of Financial Automation report, 49% of finance departments still operate with zero automation.
This guide shows you how to automate financial reporting in Excel using formulas, Power Query, and live data connections. You’ll learn practical tools and steps to build P&L statements, balance sheets, and dashboards that update automatically.
Why automate financial reporting in Excel?
Automation delivers tangible results. Here’s what finance teams gain:
- Time savings matter. Thornton Capital cut their month-end close from 10 days to 3 days, saving 20+ hours monthly. Deloitte research shows automation delivers 30-60% reduction in close cycle times.
- Errors disappear. Automated data connections eliminate 25-50% of reconciliation errors according to PwC benchmarking. No more broken formulas from manual data updates.
Decisions happen faster. Reporting cycles accelerate from 10-12 days to 4-6 days, enabling faster decision-making and meeting compliance deadlines.
Teams focus strategically. Finance professionals report saving 20-40 hours per close per FTE, freeing resources for variance analysis and forecasting instead of data gathering.
Growth scales smoothly. As business complexity grows, automated systems maintain consistent performance. Thornton Capital manages 16 separate QuickBooks files without proportional increases in workload.
Modern tools like Coefficient connect Excel directly to accounting systems including QuickBooks, NetSuite, and Xero for fully automated data flow.
What types of financial reports can you automate?
Coefficient offers free, pre-built templates that connect directly to your accounting system—QuickBooks, NetSuite, Xero, and more—so your reports update automatically without manual exports or data wrangling. Here are the core financial reports you can automate today:
P&L Statement
Pull revenue, COGS, and expense data by department or entity directly into Excel. As transactions hit your accounting system, your P&L updates automatically—no more waiting until month-end to see where you stand.
Balance Sheet
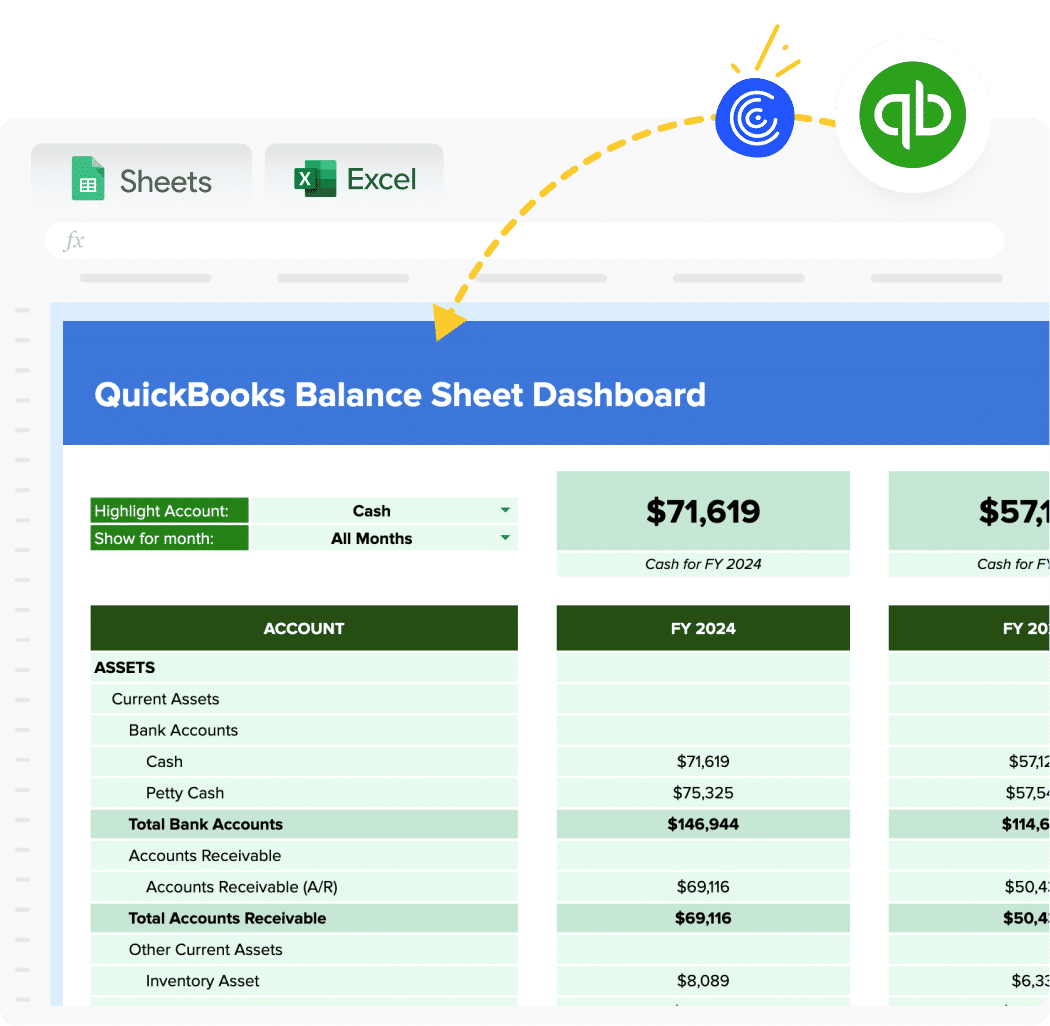
Track assets, liabilities, and equity across multiple entities with live data connections. See your current financial position at any moment, not just when someone remembers to run a report.
Get the Balance Sheet template →
Cash Flow Statement
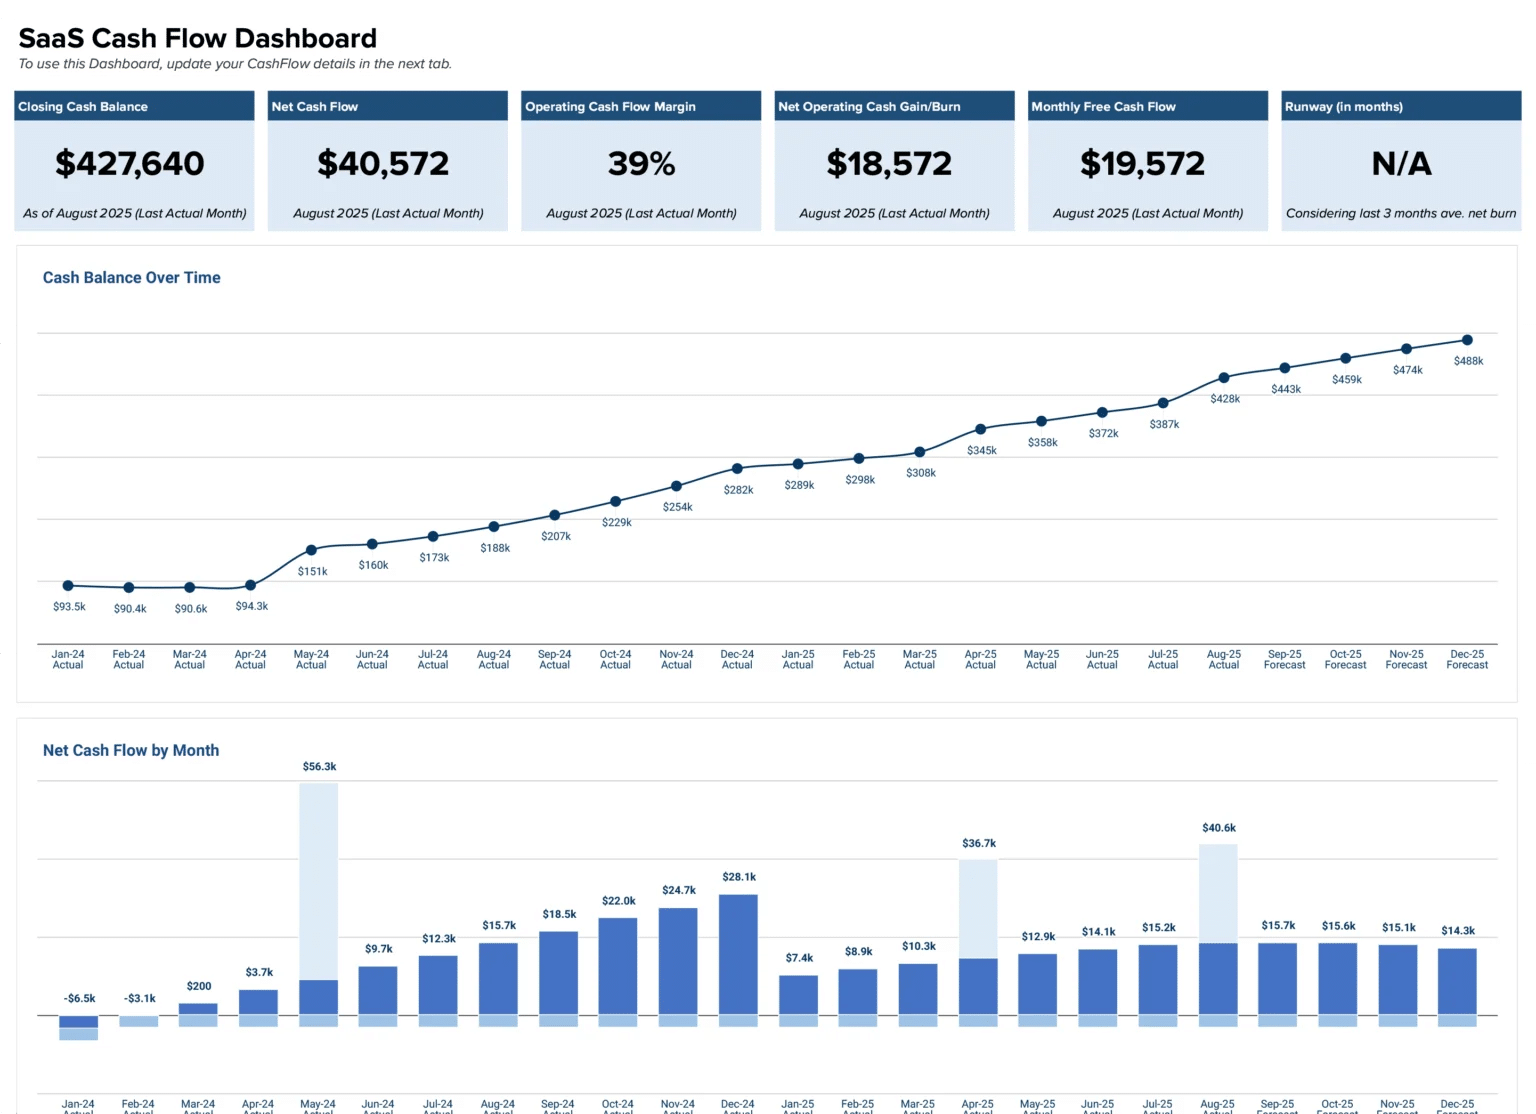
Monitor operating, investing, and financing activities with automated categorization. Understand exactly where cash is coming from and going without manual transaction sorting.
Budget vs. Actual Variance Reports
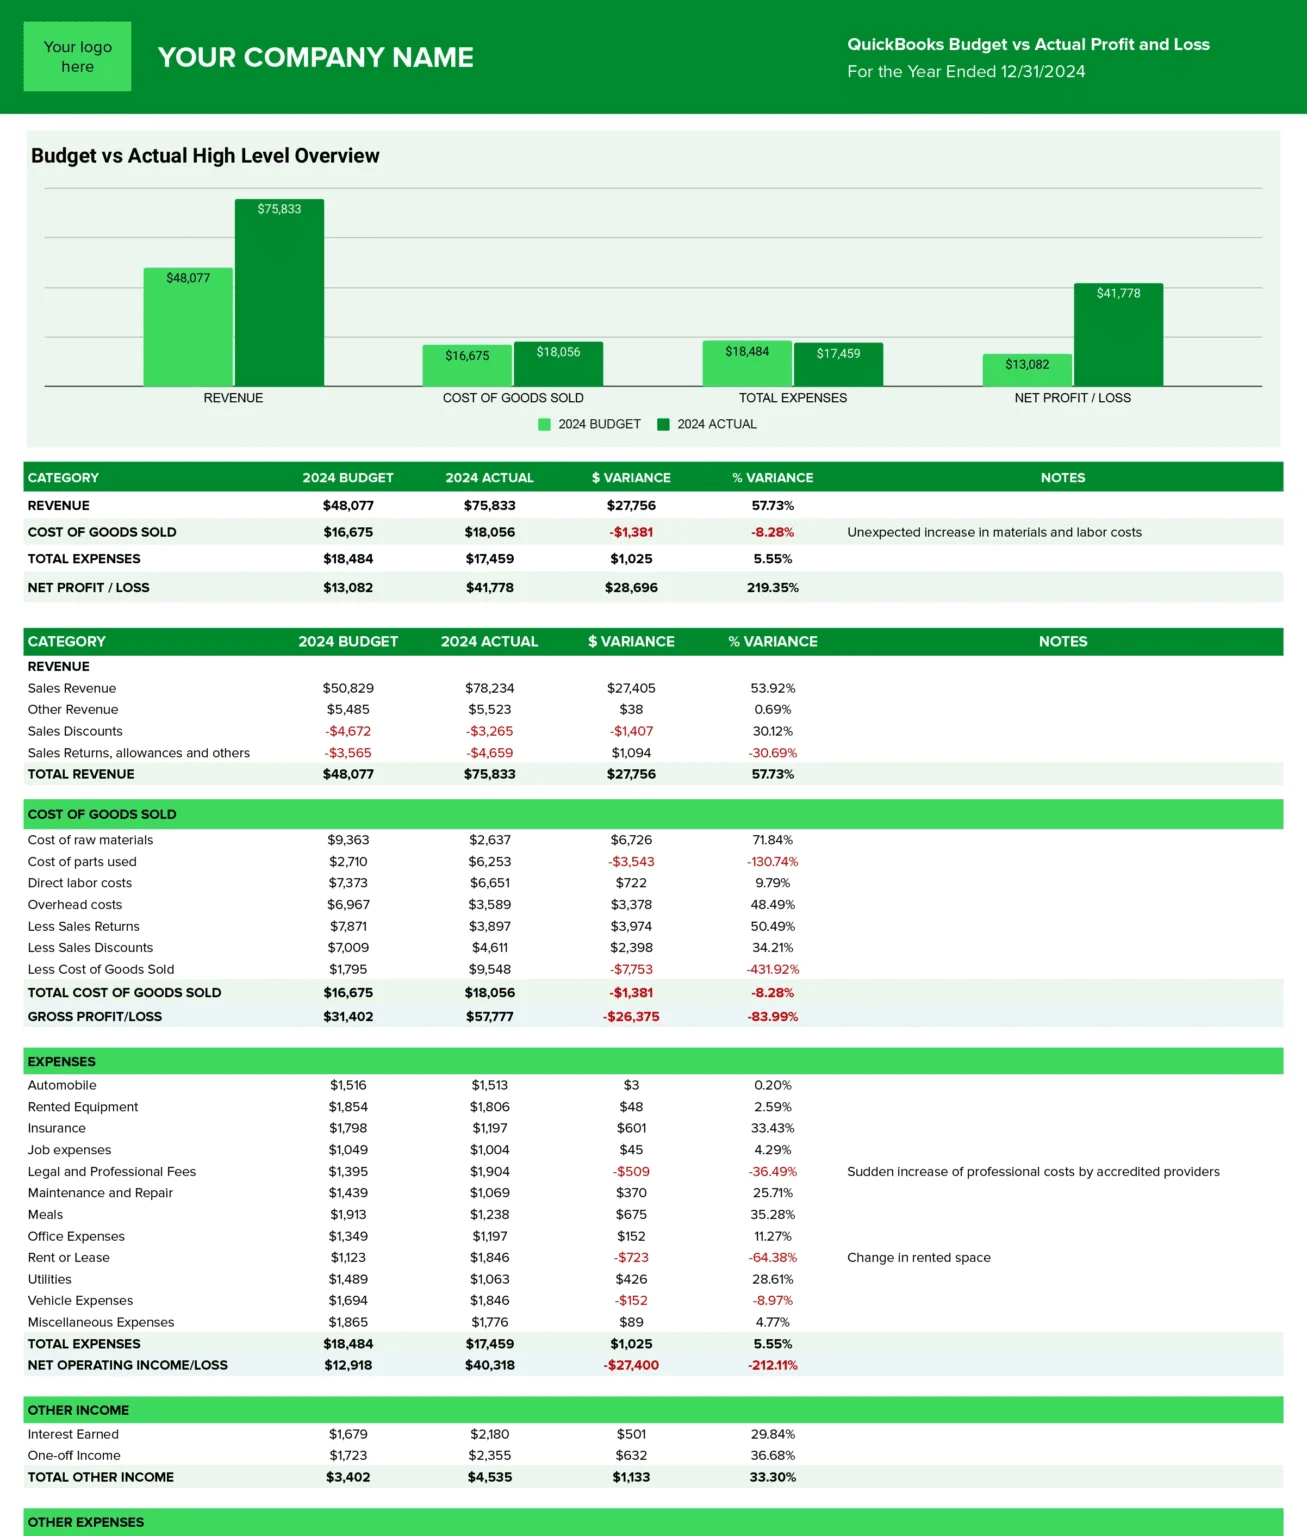
Compare planned spending against actual results with variances calculated automatically. Built-in formulas highlight areas that need attention so you can address issues before they become surprises in board meetings.
Get the Budget vs. Actual template →
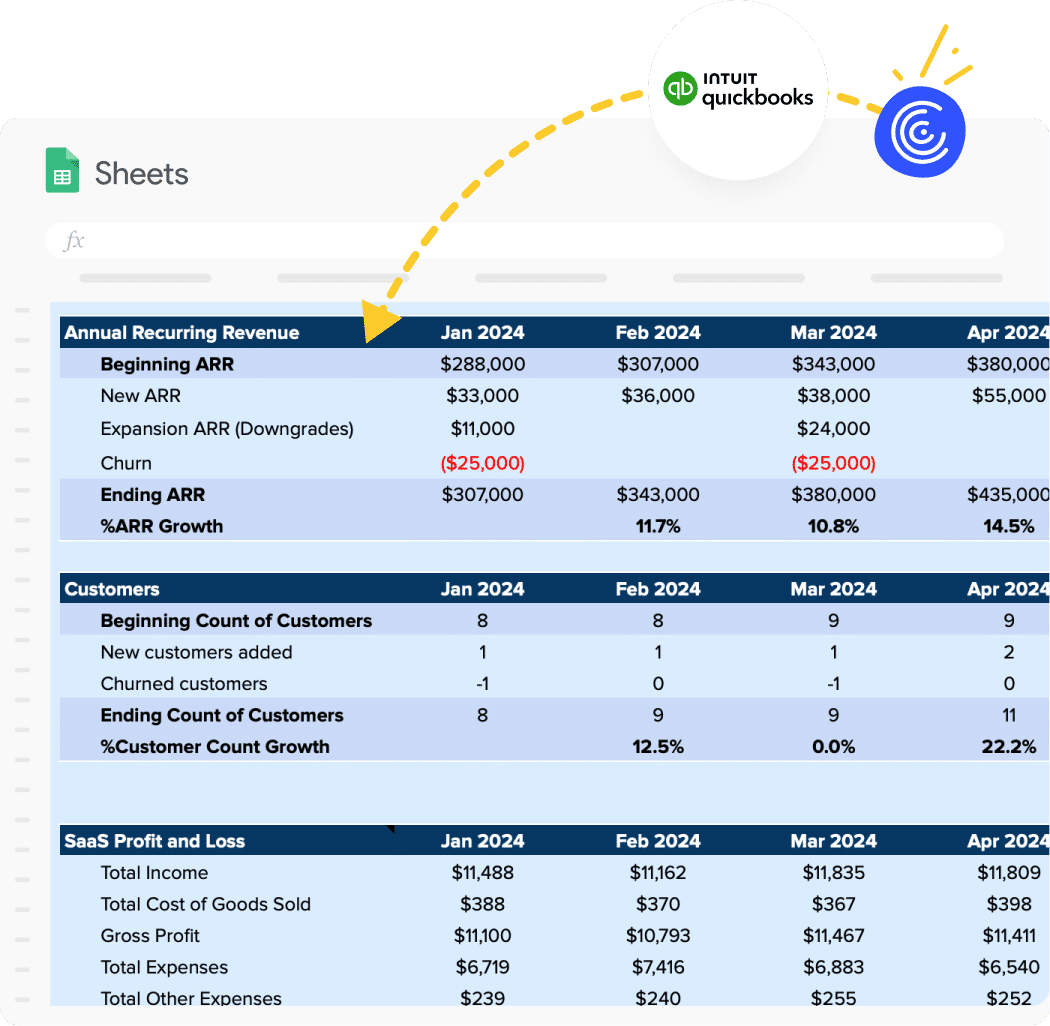
Financial KPI Dashboards
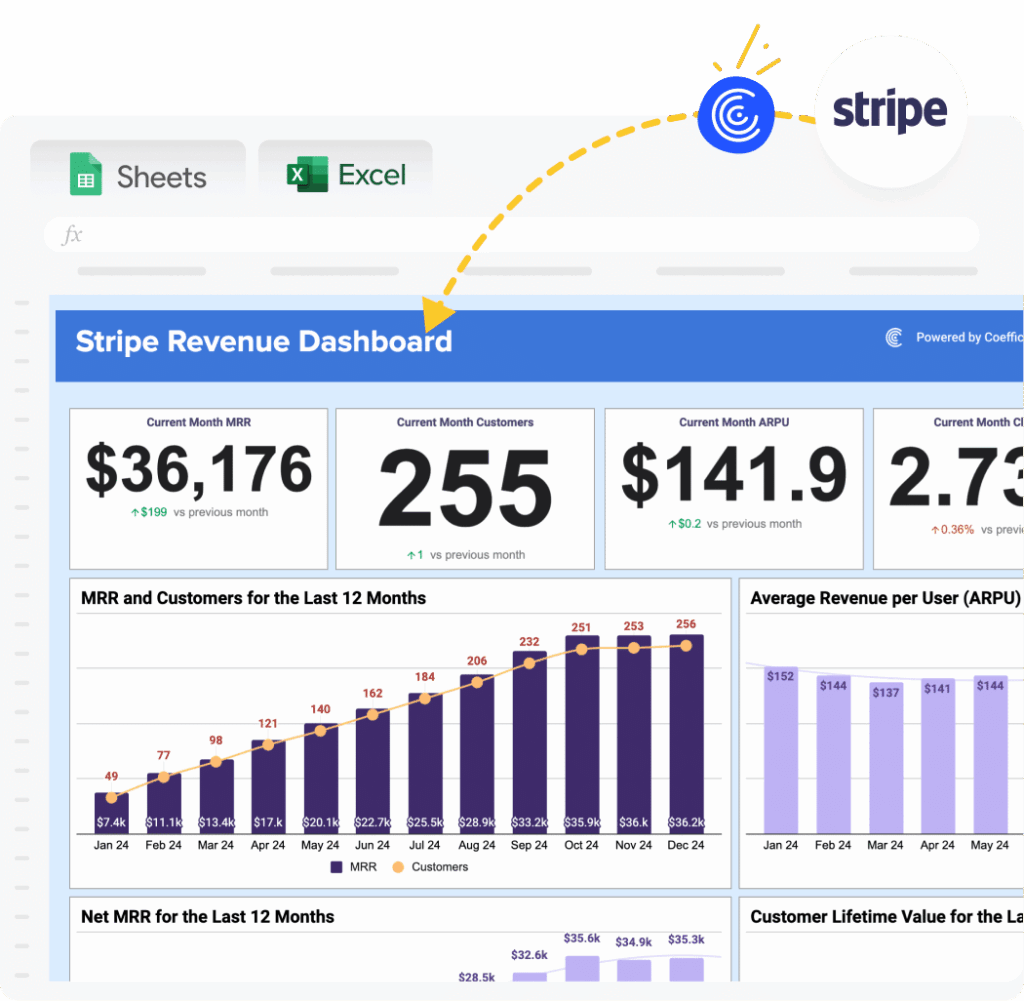
Track the metrics that matter—MRR, ARR, burn rate, runway, and custom KPIs—in one view. Live data connections mean your dashboard reflects reality, not last month’s numbers.
Get the KPI Dashboard template →
Essential Excel formulas for automated financial reporting
These formulas form the foundation for automated reporting.
SUMIFS and COUNTIFS
Purpose: Conditional aggregation based on multiple criteria.
Formula: =SUMIFS(sum_range, criteria_range1, criteria1, [criteria_range2], [criteria2]…)
Example: =SUMIFS(Amount, Department, “Sales”, Month, “January”, Type, “Expense”)
This sums all Sales department expenses for January. Use it to calculate departmental expenses by month, sum revenue by product category, or aggregate costs by project and date range.
VLOOKUP and XLOOKUP
Purpose: Find and retrieve data from reference tables.
VLOOKUP Formula: =VLOOKUP(lookup_value, table_array, col_index_num, [range_lookup])
XLOOKUP Formula (modern Excel): =XLOOKUP(lookup_value, lookup_array, return_array)
Example: =XLOOKUP(A2, AccountNumbers, AccountNames) returns the account name for a given account number.
Use these to map GL account codes to account names, retrieve budget amounts for comparison, or pull vendor details for AP reports. XLOOKUP is superior as it searches in any direction and handles errors better, but only works in Microsoft 365.
INDEX-MATCH
Purpose: More flexible than VLOOKUP. Searches in any direction and handles large datasets efficiently.
Formula: =INDEX(return_range, MATCH(lookup_value, lookup_range, 0))
Example: =INDEX(Revenue_Data, MATCH(ProductID, Product_List, 0)) returns revenue for specific product.
Use INDEX-MATCH for two-way lookups, finding data where the lookup column isn’t first, or creating dynamic references that adjust when rows or columns are added.
IF and Nested IF
Purpose: Conditional logic for categorization and flagging.
Formula: =IF(logical_test, value_if_true, value_if_false)
Nested Example: =IF(Variance>0, “Over Budget”, IF(Variance<0, “Under Budget”, “On Budget”))
Flag budget variances, categorize expenses by size, create conditional formatting triggers, or set approval workflows based on amounts.
OFFSET and Dynamic Ranges
Purpose: Create references that automatically expand as data grows.
Formula: =OFFSET(reference, rows, cols, [height], [width])
Example: =SUM(OFFSET(A1, 0, 0, COUNTA(A:A), 1)) sums column A regardless of how many rows contain data.
Build rolling period calculations like last 12 months, dynamic chart ranges that update automatically, or flexible data sources for PivotTables.
Calculated Fields in PivotTables
Purpose: Add custom calculations within PivotTables without modifying source data.
How To: Right-click PivotTable, then Fields, Items & Sets, then Calculated Field.
Example: Create “Gross Margin %” field: =(Revenue – COGS) / Revenue
Use for profit margin analysis, variance percentages, custom ratios, or period-over-period comparisons within pivots.
Using Power Query to automate data preparation
Power Query automates data cleaning and preparation. It provides a visual interface for connecting to data sources, transforming data, and loading it into Excel without writing code.
Common Power Query finance use cases
- Consolidating Multiple Files: Combine data from dozens of regional sales reports or monthly exports into a single dataset.
- Cleaning Messy Data: Automatically remove duplicates, handle null values, standardize date formats, and correct inconsistent entries.
- Creating Date Tables: Build custom calendar tables with fiscal periods, quarters, and working day calculations.
- Unpivoting Data: Transform wide-format reports (months across columns) into database-style format (one row per month) for analysis.
Basic Power Query workflow
- Connect: Data, Get Data, From File/Database/Other Sources
- Transform: Use Power Query Editor to clean, filter, and reshape data
- Load: Choose “Close & Load” to create a table in Excel or load to Data Model
- Refresh: Right-click table, then Refresh to update with latest data
Benefits of using Power Query
- Repeatability: Transformations are saved and reapply automatically on refresh.
- No Code Required: Visual interface makes complex transformations accessible.
- Handle Large Datasets: Process millions of rows more efficiently than formulas.
- Version Control: Track changes to data preparation steps, rollback if needed.
Limitations of Power Query for financial reporting
- Manual Refresh Required: Unlike live connections, Power Query requires manual refresh or scheduled refresh (Excel Desktop only).
- Desktop-Only Full Features: Excel Online has limited Power Query functionality.
- Breaks with Source Changes: If source file structure changes, queries often fail and require manual fixes.
- Learning Curve: While powerful, mastering Power Query takes time and practice.
Live data connections: The ultimate automation
Live data connections represent the most advanced automation approach. Instead of exporting and importing data, you create direct connections between Excel and your source systems.
Cyrq Energy discovered this sweet spot for financial reporting.

Their lean finance team rebuilt their entire data pipeline in days, work that previously took months with other tools. By performing 80% of data cleaning directly in NetSuite before pulling into Excel, they transformed their reporting process and saved over $50,000 annually while cutting several hours from their weekly workload.
How live connections work
- Direct API Integration: Tools like Coefficient use APIs to connect Excel directly to accounting systems, CRM platforms, databases, and other business systems.
- Automatic Refresh: Data updates on schedules you control (hourly, daily, weekly) without manual exports or imports.
- Always Current: Every time you open your workbook, you see the latest data from source systems.
- No Breaking: Unlike Power Query, live connections maintain integrity even when source data structures change.
Key benefits over traditional methods
- Zero Manual Work: No downloading files, no copy-paste, no manual imports. Data flows automatically.
- Real-Time Visibility: View current financial position without waiting for month-end close.
- Scalability: Handle unlimited data sources without performance degradation.
- Error Prevention: Eliminate transcription errors, broken formula references, and version control issues.
- Time Savings: Teams report 10-20 hours saved per month per person on data gathering alone.
How to set up live data connections with Coefficient
Step 1: Install Coefficient add-in from Microsoft AppSource or Office Store.
Step 2: Open Excel, click Coefficient in the ribbon, then “Connect to Data Source”.
Step 3: Select your accounting system (QuickBooks, NetSuite, Xero, Sage Intacct).
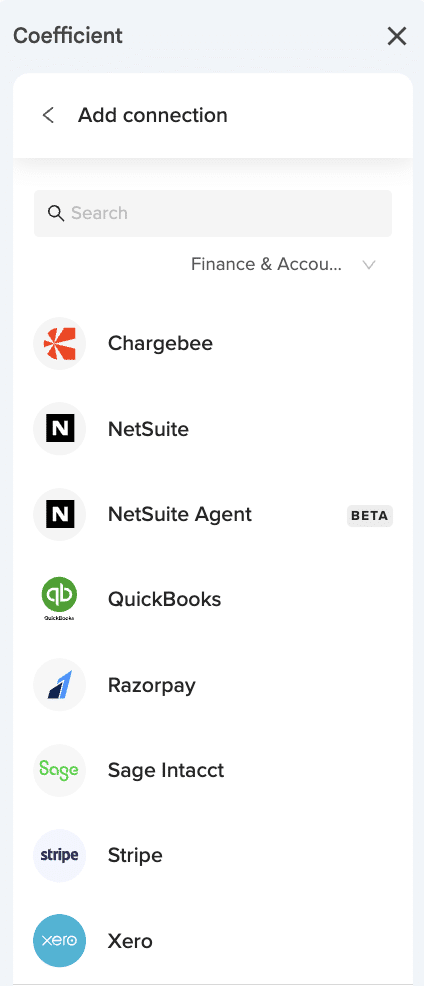
Step 4: Authenticate your credentials following OAuth security protocols.
Step 5: Choose specific reports or data you want to import (P&L, Balance Sheet, Transaction Details).
Step 6: Configure filters (date ranges, departments, accounts, entities).
Step 7: Set automatic refresh schedule (daily, weekly, monthly).
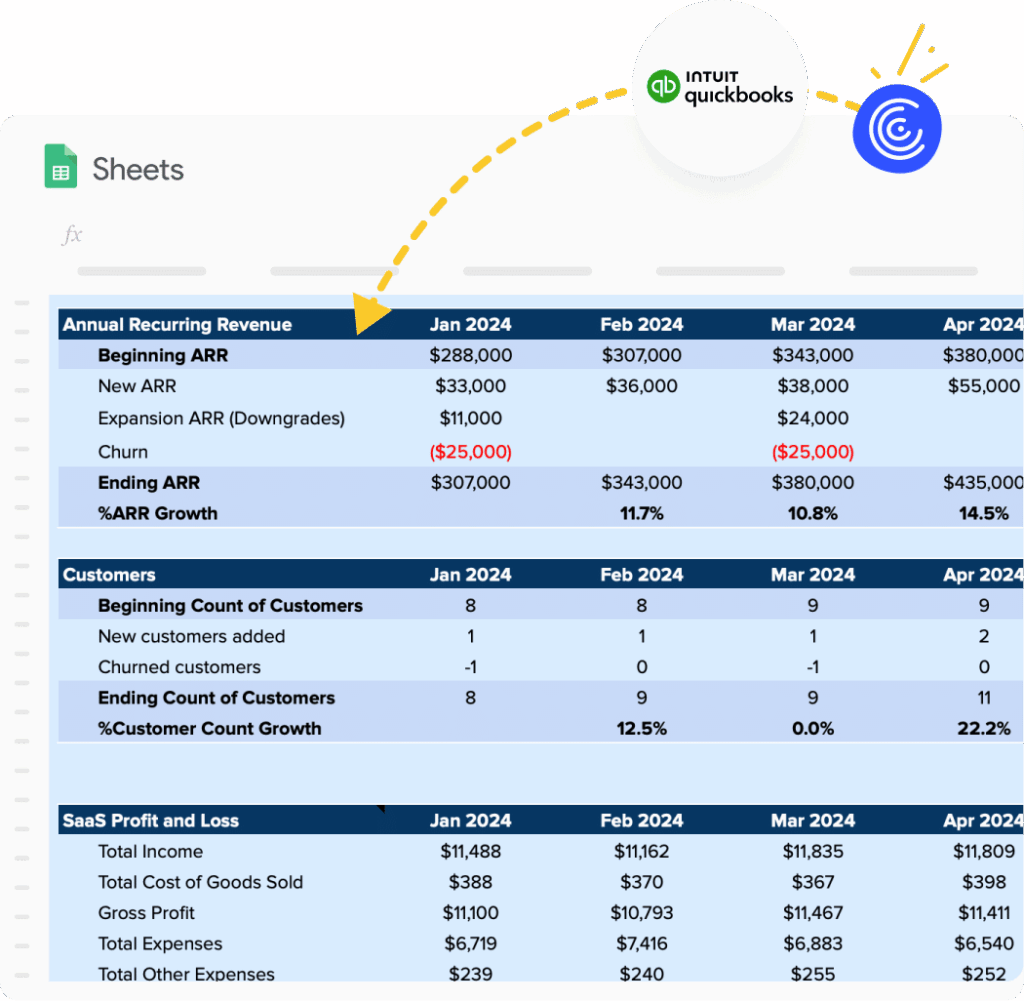
Your QuickBooks data now flows automatically into Excel without manual exports. When you open your workbook, you see current data. If data changes in QuickBooks, your Excel report updates on your schedule.
Read the full tutorial here: QuickBooks Export to Excel Guide
Explore finance templates
Note: Coefficient’s pre-built templates eliminate setup time. Browse ready-to-use dashboards for profit & loss statements, cash flow forecasts, accounts payable/receivable aging, revenue recognition tracking, and multi-entity consolidation below!
Finance & Accounting Templates Gallery
Step-by-step: Automating your first financial report
Let’s build an automated P&L statement. This practical example shows exactly how automation works in practice.
Step 1: Prepare your data source
Ensure your accounting system has:
Chart of accounts properly structured
Revenue accounts categorized by product line if relevant
Expense accounts organized by type (COGS, Sales & Marketing, G&A)
Current period transactions posted and reconciled
Step 2: Set up your Excel template
Open a new Excel workbook. Create these sheets:
“Data” sheet (where live data imports)
“P&L Report” sheet (formatted report with formulas)
“Settings” sheet (date ranges, filters, parameters)
Step 3: Connect your data source
Using Coefficient:
Select “Import from QuickBooks/NetSuite/Xero”
Authenticate your connection
Choose “Profit & Loss Report”
Configure date range (Month-to-Date), Accounting method (Accrual), Comparison period (Prior Year)
Import to “Data” sheet
Step 4: Build your report structure
In “P&L Report” sheet, create sections:
- Revenue: Use SUMIFS to total all revenue accounts
- Cost of Goods Sold: Sum all COGS accounts
- Gross Profit: = Revenue – COGS
- Operating Expenses: Categorize by department (Sales, Marketing, G&A, R&D)
- Operating Income: = Gross Profit – Operating Expenses
- Net Income: Include other income/expenses, taxes
Step 5: Add calculated metrics
Gross Margin % = Gross Profit / Revenue
Operating Margin % = Operating Income / Revenue
Month-over-Month growth
Year-over-Year comparisons
Step 6: Set automatic refresh
Configure your data connection to refresh daily at 7 AM to capture previous day’s transactions, or monthly on day 3 for formal month-end reporting.
Step 7: Add formatting and charts
Apply conditional formatting (red for negative variances, green for positive). Create visualizations for revenue trends and expense breakdown. Add data validation for date range selectors.
Your P&L now updates automatically. Open Excel in the morning to see current figures without manual work. Thornton Capital built similar automated reports that now consolidate data from 16 QuickBooks files in seconds.
Tools comparison: Manual vs. Power Query vs. live connections
Feature | Manual Process | Power Query | Live Connections |
|---|---|---|---|
Setup Time | No setup | 1-2 hours initial | 5-10 minutes |
Data Refresh | 30-60 minutes manual | 5-10 minutes manual | Automatic (scheduled) |
Frequency | Monthly | Weekly possible | Daily/hourly possible |
Error Rate | High (manual entry) | Medium (import errors) | Low (direct connection) |
Scalability | Breaks with growth | Handles growth but slower | Handles growth seamlessly |
Excel Version | Any version | Desktop only | Desktop + Web |
Learning Curve | Low | Medium | Low |
Maintenance | High | Medium | Low |
Cost | Time cost only | Included in Excel | Subscription ($49-99/mo) |
Best use cases:
- Manual: Small businesses, annual reports only, simple single-source data
- Power Query: Mid-size companies, weekly/monthly updates, team has Excel expertise
- Live Connections: Growing businesses, daily/weekly updates needed, multiple data sources, team focused on analysis not data wrangling
Future of automated financial reporting: AI agents
Artificial intelligence is transforming financial reporting from reactive to predictive. According to McKinsey’s 2025 State of AI report, 62% of organizations are now experimenting with AI agents that can process, analyze, and act on financial data without human intervention.
Rather than replacing finance professionals, AI amplifies their capabilities through autonomous accounting that processes transactions and reconciles accounts 24/7, generative AI for insights that answer questions like “Why did expenses spike last quarter?” and receive narrative explanations instantly, predictive forecasting with AI models that analyze historical patterns for more accurate projections, and anomaly detection that automatically identifies unusual transactions or potential fraud.
The future isn’t about eliminating finance professionals. It’s about automating routine work so teams can focus on strategic decision-making.
How to overcome common finance reporting problems in Excel
Problem 1: Broken formulas after data updates
Symptom: VLOOKUP #REF! errors, SUMIFS returning zero, formulas pointing to deleted columns.
Solution: Use structured references with Excel Tables instead of cell references. Convert your data range to a table using Ctrl+T. Formulas automatically adjust when columns are added or removed. Even better: Use live data connections that maintain consistent column structures.
Problem 2: Version control chaos
Symptom: Multiple files named “Q4_Report_Final_v3_FINAL_actual.xlsx”, team members working on different versions, conflicting updates.
Solution: Store master workbook in SharePoint or OneDrive with co-authoring enabled. Use Excel’s “Track Changes” feature for audit trails. Implement naming convention: “Q4_Report_2024_[Date]_[Initials].xlsx”
Problem 3: Slow performance with large datasets
Symptom: Excel freezes, calculations take minutes, file size exceeds 50MB.
Solution: Use Power Query to pre-filter data before loading. Load large datasets to Data Model instead of worksheet. Turn off automatic calculations (Formulas, Calculation Options, Manual). Replace volatile functions like INDIRECT and OFFSET with static references where possible. Consider live data connections that keep raw data in source system.
Problem 4: Manual data entry errors
Symptom: Transposed numbers, missing decimals, incorrect account classifications.
Solution: Eliminate manual entry entirely with automated imports. If manual entry is necessary, use Data Validation to restrict inputs, create dropdown lists for consistent entries, and implement cross-checks like “Total Assets = Total Liabilities + Equity”
Problem 5: Report distribution takes hours
Symptom: Generating PDFs, emailing attachments, copying data into PowerPoint, reformatting for different stakeholders.
Solution: Create one master workbook with different views using Hide/Unhide or separate sheets. Set up automated email delivery with scheduled refreshes. Use Excel’s “Publish to Web” for stakeholders who just need to view, not edit.
Start automating your financial reports today
Manual financial reporting consumes time that finance teams could spend on strategic analysis. The tools exist today to automate financial reporting in Excel using formulas, Power Query, and live data connections.
Start small. Pick one report that takes the most time each month. Build it using the formulas and techniques in this guide. As you gain confidence, expand to more reports and consider live data connections for complete automation.
Thornton Capital cut their month-end close from 10 days to 3 days. Cyrq Energy saved $50,000+ annually while cutting hours from their weekly workload. Your team can achieve similar results.
Get started with Coefficient today.