Table of Contents
![]()


Manual financial reporting eats up days every month. You’re copying data from QuickBooks into Excel, reformatting numbers, checking formulas, and hoping nothing breaks before the board meeting. Meanwhile, your clients wait for insights while you wrestle with spreadsheets.
There’s a better way to handle financial statements that saves time and reduces errors.
Where to Automate Financial Statements in Excel
Modern tools can automate four core financial statements in Excel. Each serves a different purpose, but together they give you complete financial visibility. Coefficient offers pre-built templates that connect directly to your data sources.
Income Statement
The income statement tracks revenue and expenses over time. It shows whether your business made money or lost it during a specific period.
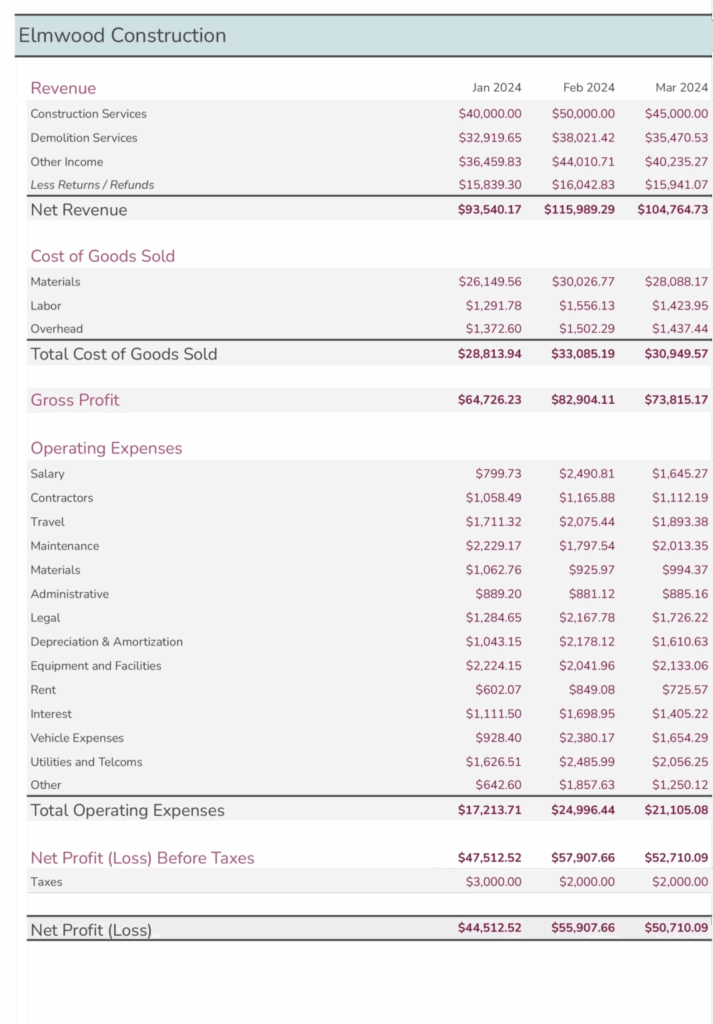
Coefficient’s template includes revenue tracking by category, expense breakdowns for operations and overhead, automatic gross margin calculations, and month-over-month comparisons. The template has built-in formulas for subtotals, percentages, and variance tracking. It handles multiple revenue streams and cost centers without extra setup.
Grab the Monthly Income Statement template here →
Balance Sheet
Your balance sheet captures assets, liabilities, and equity at a single point in time. It’s the snapshot that shows what you own versus what you owe.
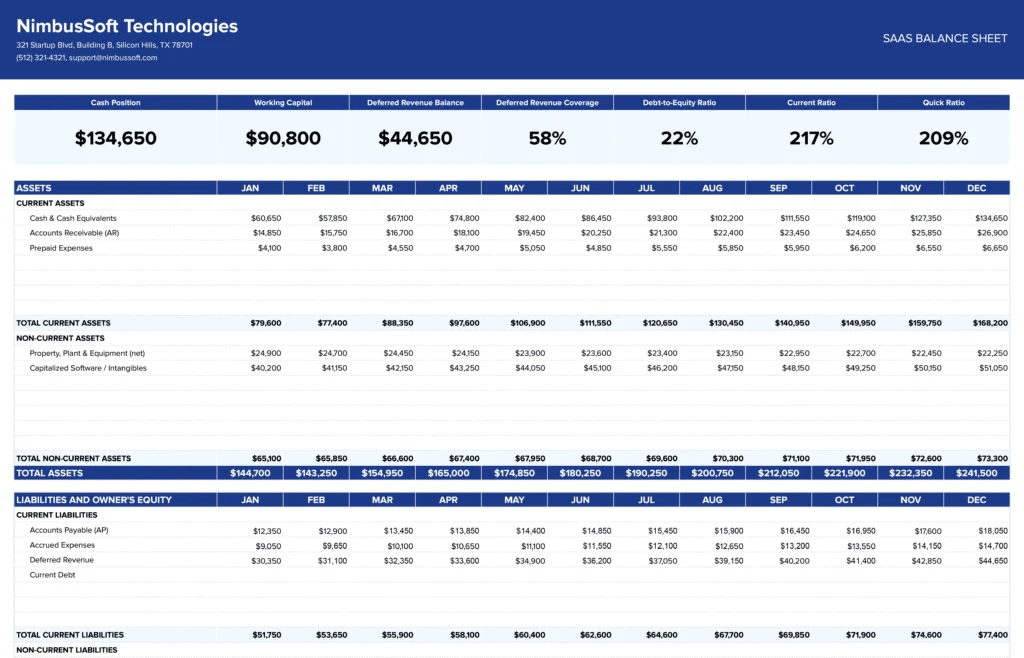
This SaaS-specific template tracks deferred revenue from annual contracts, capitalized development costs, and equity structures with multiple funding rounds. It includes sections for recurring revenue obligations, employee stock options, and 409A valuations. The format follows what VCs expect to see during due diligence.
Grab the SaaS Balance Sheet template here →
Cash Flow Statement
Cash flow statements show money moving in and out of your business. They reveal whether you can pay bills, even when the P&L looks profitable.
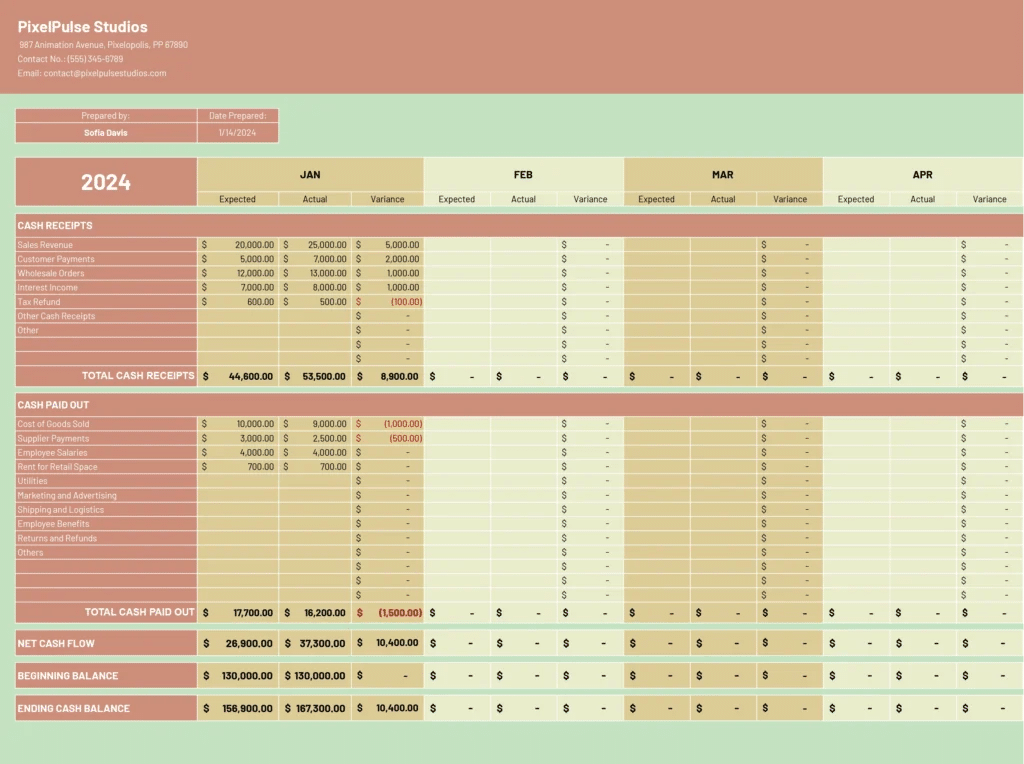
The 12-month template breaks down cash by operating activities, investing activities, and financing activities. It includes automatic calculations for working capital changes and free cash flow.
Monthly forecasting columns help you spot cash crunches before they happen.
Grab the 12-Month Cash Flow template here →
Variance Analysis
Variance analysis compares budget to actual performance. It highlights where you’re overspending or underperforming against plan.
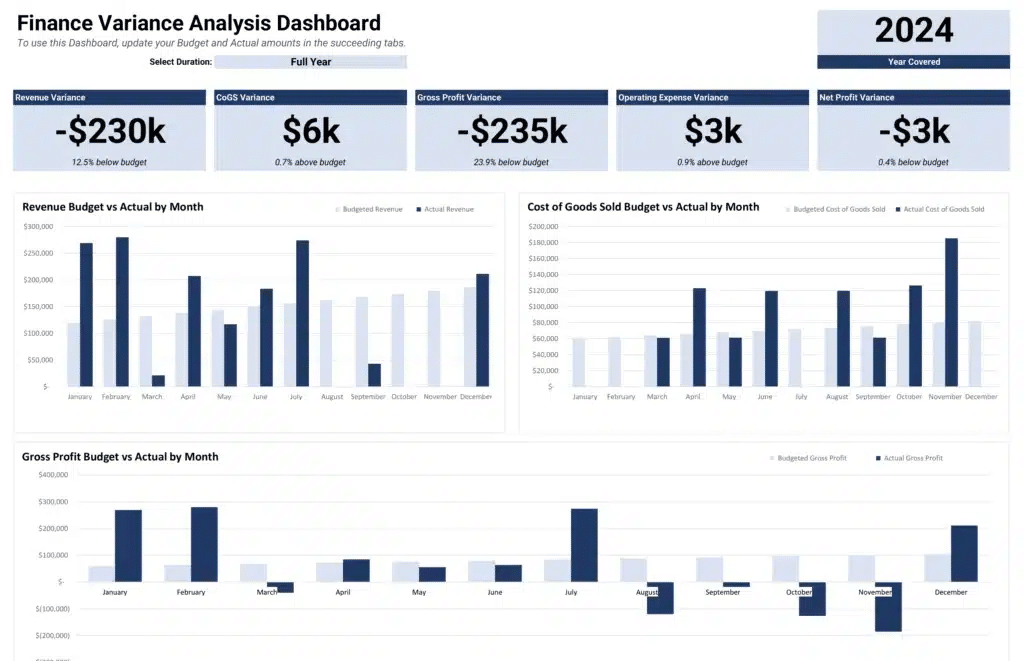
The template calculates revenue variance, cost variance, and gross profit variance automatically. Color-coded indicators show favorable versus unfavorable variances at a glance. Pre-built formulas handle percentage and dollar variance calculations across all metrics.
Grab the Variance Analysis template here →
Disadvantages of Manual Updates
- Time drain kills productivity. Finance teams spend 10-15 hours per month copying data between systems. That’s two full days of strategic work lost to copy-paste tasks that add zero value.
- Errors compound with each update. Manual data entry has a 1% error rate on average. Across thousands of cells, that means dozens of mistakes hiding in your statements. One wrong formula reference can cascade through entire reports.
- Stale data misleads decisions. By the time you finish formatting last month’s numbers, they’re already outdated. Management makes choices based on week-old snapshots instead of real-time insights.
- Version control becomes chaos. Multiple team members updating different Excel files creates conflicting versions. You end up with “Final_v3_ACTUALLY_FINAL_revised.xlsx” nightmares where nobody knows which numbers are right.
4 Ways to Automate Finance Statements in Excel
1. Connect Excel to Your Source Systems Using Coefficient
Set up Coefficient once and connect QuickBooks, Xero, NetSuite, or Stripe directly to Excel. Pull trial balances, P&L details, and AR/AP data straight into structured tabs. No more CSV exports or manual imports. Your data stays live and synced inside your workbook. Changes in your accounting system appear in Excel automatically.
2. Build Formula-Powered Statements That Auto-Update
Use SUMIFS to aggregate accounts by category from your Coefficient data tabs. INDEX-MATCH pulls specific account balances into statement line items. XLOOKUP grabs comparative periods for year-over-year analysis. Once built, these formulas update whenever Coefficient refreshes your data. Your statements rebuild themselves without manual intervention.
3. Schedule Monthly Refreshes to Match Close Calendar
Coefficient lets you schedule data refreshes for specific days and times. Set pulls for day 5 of each month after your books close. Your statements update automatically while you sleep. Morning reports are ready when you arrive, formatted and calculated correctly every time.
4. Layer In Variance Tracking
Connect your variance analysis template to both budget and actual data sources. Coefficient pulls actuals from your accounting system and budget from planning sheets.
Variance calculations happen automatically. You see performance gaps instantly without manual comparison work.
Transform Your Financial Reporting Today
Manual financial statements waste time you don’t have. Automation through Coefficient turns days of work into minutes of review. Your data stays accurate, your reports stay current, and you focus on analysis instead of data entry.
Ready to automate your financial reporting? Get started with Coefficient free and connect your systems to Excel in under 5 minutes.
FAQs
How to create a financial statement in Excel?
Start with a structured template that includes proper account categories and formulas. List revenue accounts at the top, followed by expense categories, then calculate net income. Use SUMIF formulas to aggregate account balances by category. Coefficient simplifies this by providing pre-built templates that connect directly to your accounting data, eliminating manual setup.
How to pull financial statements into Excel?
Most accounting systems offer CSV exports that you can import into Excel. The better approach uses API connections through tools like Coefficient, which pulls data automatically from QuickBooks, NetSuite, or Xero. This eliminates manual exports and keeps your Excel statements synced with source data in real-time.
Can financial reporting be automated?
Yes, financial reporting automation is standard practice for modern finance teams. Automated systems pull data from accounting software, apply formatting and calculations, then generate statements on schedule. Coefficient automates the entire flow from data connection to formatted reports, updating your Excel statements automatically as source data changes.
How to make an automatic balance sheet in Excel?
Build your balance sheet structure with assets, liabilities, and equity sections. Use formulas to pull account balances from a data tab. Set up SUMIFS to aggregate accounts into proper categories. The easiest path to automate financial statements in Excel is with Coefficient’s balance sheet templates, which connect to your accounting system and update balances automatically without formula maintenance.