Executive assistants and operations teams know the drill: board meeting next week means scrambling to pull data from five different platforms, update countless spreadsheets, and pray nothing changes at the last minute to nail your executive reporting workflows.
But what if you could reduce that 10-hour marathon to a 15-minute sprint?
That’s exactly what Dania Maduro, Senior Executive Assistant at Viva, achieved using Coefficient. Here’s her step-by-step playbook for building an automated reporting workflow that serves weekly go-to-market meetings, quarterly board presentations, and everything in between.
The Use Case: Multi-Source Executive Reporting
Viva, a company providing remote executive assistants to fast-growing VC-backed companies , needed consolidated reporting from:
- HubSpot (sales metrics, deal flow, pipeline data)
- Notion (OKR tracking, team metrics)
- Various other sources for operational metrics
The challenge? Creating weekly dashboards, quarterly board decks, and responding to ad-hoc executive requests without spending entire days in spreadsheet hell.

Step-by-Step Guide: Automating Executive Reporting
Step 1: Map Your Data Sources and Destinations
Before diving into Coefficient, Dania recommends getting crystal clear on your data flow:
- Identify all data sources (CRMs, databases, project management tools)
- Define your reporting cadence (daily, weekly, monthly, quarterly)
- Determine your output format (spreadsheets, slides, dashboards)
Pro tip from Dania: “Don’t try to overcomplicate things or reinvent the wheel. Ask yourself: What specifically am I trying to get as an output?”
Step 2: Set Up Your Core Integrations
Start with your most critical data source. For Viva, this was HubSpot:
- Install Coefficient in Google Sheets
- Connect to HubSpot using Coefficient’s one-click integration
- Select the specific properties and metrics you need
- Create your initial data import
Step 3: Build Your Executive Reporting Infrastructure
Create dedicated reports for each meeting type:
- Monday GTM meetings: Closed won/lost breakdown, churn notices
- Weekly metrics: Leading indicators for OKR tracking
- Quarterly board prep: Comprehensive performance metrics
- Ad-hoc requests: Quick-access reports for mid-meeting questions
The key is having everything pre-built and ready to refresh on demand.
Step 4: Master the Notion-to-Sheets Workflow
Notion’s native charting capabilities weren’t sufficient for Viva’s executive reporting & OKR tracking needs. As Dania discovered, “With the setup of our current tracker in Notion, unfortunately, we couldn’t set up the charts that seamlessly.”
Her solution? Use Google Sheets as a powerful charting engine:
- Fill your Notion OKR tracker with weekly data (Thursdays for Dania)
- Use Coefficient to sync Notion database → Google Sheets
- Build your charts in Google Sheets with the organized data
- Send formatted charts back to a separate Notion page for display
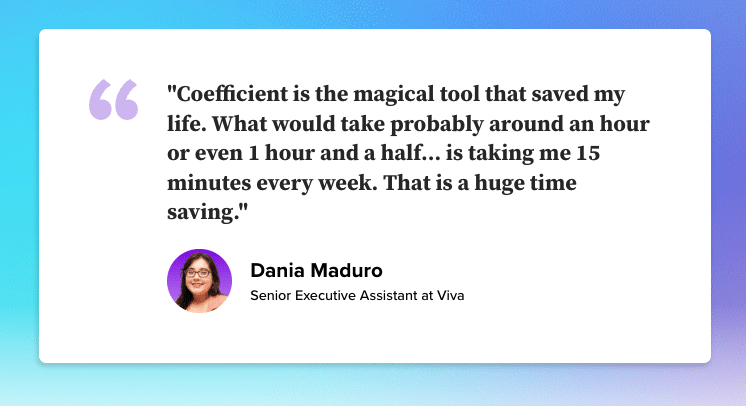
“It seems like a lot of steps, but what would take an hour to an hour and a half is taking me 15 minutes every week,” Dania explains.

Stop exporting data manually. Sync data from your business systems into Google Sheets or Excel with Coefficient and set it on a refresh schedule.
Get Started
Step 5: Enable One-Click Updates
Transform hours of work into seconds:
- Use Coefficient’s manual refresh for control over timing
- Set up scheduled refreshes for regular meetings if needed
- Keep data fresh without constant manual exports
“I’m in a quick meeting with my co-founder and they’re asking about closed wons or the breakdown of our churn notices. I can just click update and it’s there, ready to go.”
The Bottom Line
Building an automated executive reporting workflow isn’t about complex technical implementations. It’s about clarity, smart tool selection, and consistent processes.
As Dania puts it: “Coefficient is the magical tool that saved my life.” You can read the full case study here.
✅ 85% time reduction: 1-1.5 hours → 15 minutes for weekly reporting
✅ Zero scrambling: Board meeting prep becomes routine, not crisis
✅ Strategic focus: Leadership has visibility when they need it
Ready to transform your executive reporting? Get started with Coefficient for free today!


