Ad-hoc reporting is revolutionizing how data teams make information accessible and actionable across their organizations. By enabling colleagues to create custom reports on demand, ad-hoc reporting empowers businesses to move faster and make data-driven decisions without constant reliance on the data team.
This guide will show you how to implement effective ad-hoc reporting solutions using familiar tools, helping you streamline data access and foster a culture where insights are always at your team’s fingertips.
What is Ad-hoc Reporting?
Ad-hoc reporting is the ability to create custom reports on demand, answering specific business questions as they arise. With the rise of self-serve analytics, ad-hoc reporting has become more accessible than ever. Platforms like Coefficient now allow users to:
- Sync live data directly into familiar tools like Excel and Google Sheets
- Build and refresh reports using the most current data
- Maintain data integrity and security with enterprise-grade controls
Static Reporting vs. Ad-hoc Reporting
Static reports are pre-defined, regularly scheduled reports that provide a consistent view of key metrics. While useful for tracking ongoing KPIs, they lack flexibility.
Ad-hoc reports, on the other hand, are created on-demand to answer specific questions or explore particular data points. They offer the flexibility to drill down into data and uncover insights that might be missed in static reports.
Here’s a comparison table to illustrate the key differences:
| Aspect | Static Reporting | Ad-hoc Reporting |
| Frequency | Regular, scheduled | On-demand |
| Flexibility | Limited, pre-defined format | Highly flexible, customizable |
| User Control | Typically IT or data team-driven | End-user driven |
| Data Freshness | May use older data | Usually uses the most current data |
| Complexity | Can handle complex, large-scale reporting | Better for focused, specific inquiries |
| Time to Insight | Longer lead time for new reports | Quick turnaround for specific questions |
| Use Case | Ongoing KPI tracking, compliance reporting | Investigating trends, answering specific business questions |
Advantages of Using Ad-hoc Reporting
Improved Data Analysis
Ad-hoc reporting transforms the way organizations approach data analysis. It empowers users to explore data from multiple angles, uncovering insights that might be missed in standard reports. This flexibility allows analysts and business users to combine data from various sources, creating a more comprehensive view of the business landscape.
With ad-hoc reporting, teams can:
- Test hypotheses quickly by creating custom queries on the fly
- Adapt to changing business questions without waiting for report modifications
- Discover unexpected patterns and correlations in data
Enhanced Collaboration
By democratizing data access, ad-hoc reporting fosters a culture of collaboration within organizations. It breaks down data silos, allowing teams from different departments to work with the same information. This shared access to data promotes alignment across the organization and enables more informed discussions.
Ad-hoc reporting enhances collaboration by:
- Facilitating cross-functional teamwork through easily shareable custom reports
- Enabling real-time collaboration on data analysis, speeding up problem-solving
- Ensuring decision-makers across the organization have access to consistent, up-to-date information
Increased Efficiency
The self-service nature of ad-hoc reporting significantly boosts operational efficiency. It reduces the burden on data teams by allowing business users to create their own reports. This shift not only speeds up the reporting process but also frees up technical resources for more strategic initiatives.
Efficiency gains from ad-hoc reporting include:
- Reduced time between identifying a question and obtaining the answer
- Elimination of bottlenecks in the reporting process
- Ability to quickly iterate and refine reports based on immediate feedback
Faster Decision Making
Ad-hoc reporting puts timely, relevant data at decision-makers’ fingertips, enabling them to act swiftly and confidently. It allows leaders to quickly test different scenarios and understand their potential outcomes, supporting more agile and responsive business strategies.
Ad-hoc reporting accelerates decision-making by:
- Providing real-time or near-real-time data for immediate insights
- Enabling rapid response to market changes or emerging trends
- Supporting data-driven decisions at all levels of the organization, not just the top
Examples of Ad-hoc Reporting in Various Business Functions
Ad-hoc reporting gives people easy-to-use tools to look at company data when they need it. This means teams can quickly find answers to important business questions o their own terms.
Revenue Operations
Revenue Operations teams can leverage ad-hoc reporting to gain a holistic view of the entire revenue cycle, from lead generation to customer retention. This comprehensive approach allows for more effective strategy development and execution.
Win Rate Calculations by SDR: Ad-hoc reporting enables RevOps teams to create detailed analyses of win rates for each Sales Development Representative (SDR). By quickly generating these reports, managers can identify top performers and understand the factors contributing to their success. This insight allows for targeted coaching and the refinement of sales strategies to improve overall team performance.
Churn Rate in Different Cohorts: With self-serve analytics, RevOps can dive deep into churn rates across various customer cohorts. This analysis can reveal patterns in customer behavior, helping to identify at-risk groups and factors influencing customer retention. By having this information readily available, teams can develop proactive retention strategies and improve overall customer lifetime value.
Pipeline Velocity Analysis: Ad-hoc reporting also allows RevOps to examine how quickly deals move through the sales pipeline. By creating custom reports that track deal progression over time, teams can identify bottlenecks in the sales process and implement targeted improvements to accelerate revenue generation.
Finance
Finance teams can use ad-hoc reporting to gain deeper insights into the company’s financial health and make data-driven decisions about resource allocation and investment strategies.
CAC Payback in Different Customer Segments: Self-serve analytics tools enable finance teams to generate custom reports on Customer Acquisition Cost (CAC) payback periods across various customer segments. This granular view helps identify the most profitable customer groups, allowing for more informed decisions about resource allocation and growth strategies.
Profitability Analysis by Product Line: Ad-hoc reporting allows finance teams to quickly assess the profitability of different product lines or services. By combining revenue data with cost information, teams can create detailed reports that highlight which offerings contribute most to the bottom line, informing product development and marketing strategies.
Cash Flow Projections: Finance teams can use ad-hoc reporting to create dynamic cash flow projections based on current sales pipelines and historical data. This ability to quickly generate and update projections enables more agile financial planning and helps maintain healthy cash reserves.
Marketing
Marketing teams can leverage ad-hoc reporting to gain real-time insights into campaign performance and customer behavior, allowing for more effective and efficient marketing strategies.
Ads Spend by Campaigns: With self-serve analytics, marketing teams can create detailed breakdowns of advertising spend across different campaigns. By comparing spend with key performance metrics like conversions and ROI, marketers can quickly identify which campaigns are most effective. This real-time insight allows for agile budget reallocation and strategy adjustments to maximize marketing impact.
MQL to SQL Analysis: Ad-hoc reporting facilitates a deep dive into the conversion rate from Marketing Qualified Leads (MQLs) to Sales Qualified Leads (SQLs). This analysis helps marketing teams understand which lead sources and nurturing tactics are most effective. The ability to quickly generate these reports enables marketing teams to continuously refine their lead scoring models and improve alignment with sales teams.
Customer Journey Analysis: Marketing teams can use ad-hoc reporting to track and analyze the customer journey across various touchpoints. By creating custom reports that combine data from different marketing channels, teams can gain a comprehensive view of how customers interact with the brand, enabling more targeted and effective marketing strategies.
How to Build an Ad-hoc Report in Google Sheets or Excel
Let’s walk through the process of creating an ad-hoc report to understand Win-Rate.
Step 1. Connect Your Data Source:
- Open the Coefficient sidebar in your spreadsheet.
- Select “Import from” and choose your CRM or sales data platform (e.g. Salesforce).

- Follow the prompts to authorize and connect your account.
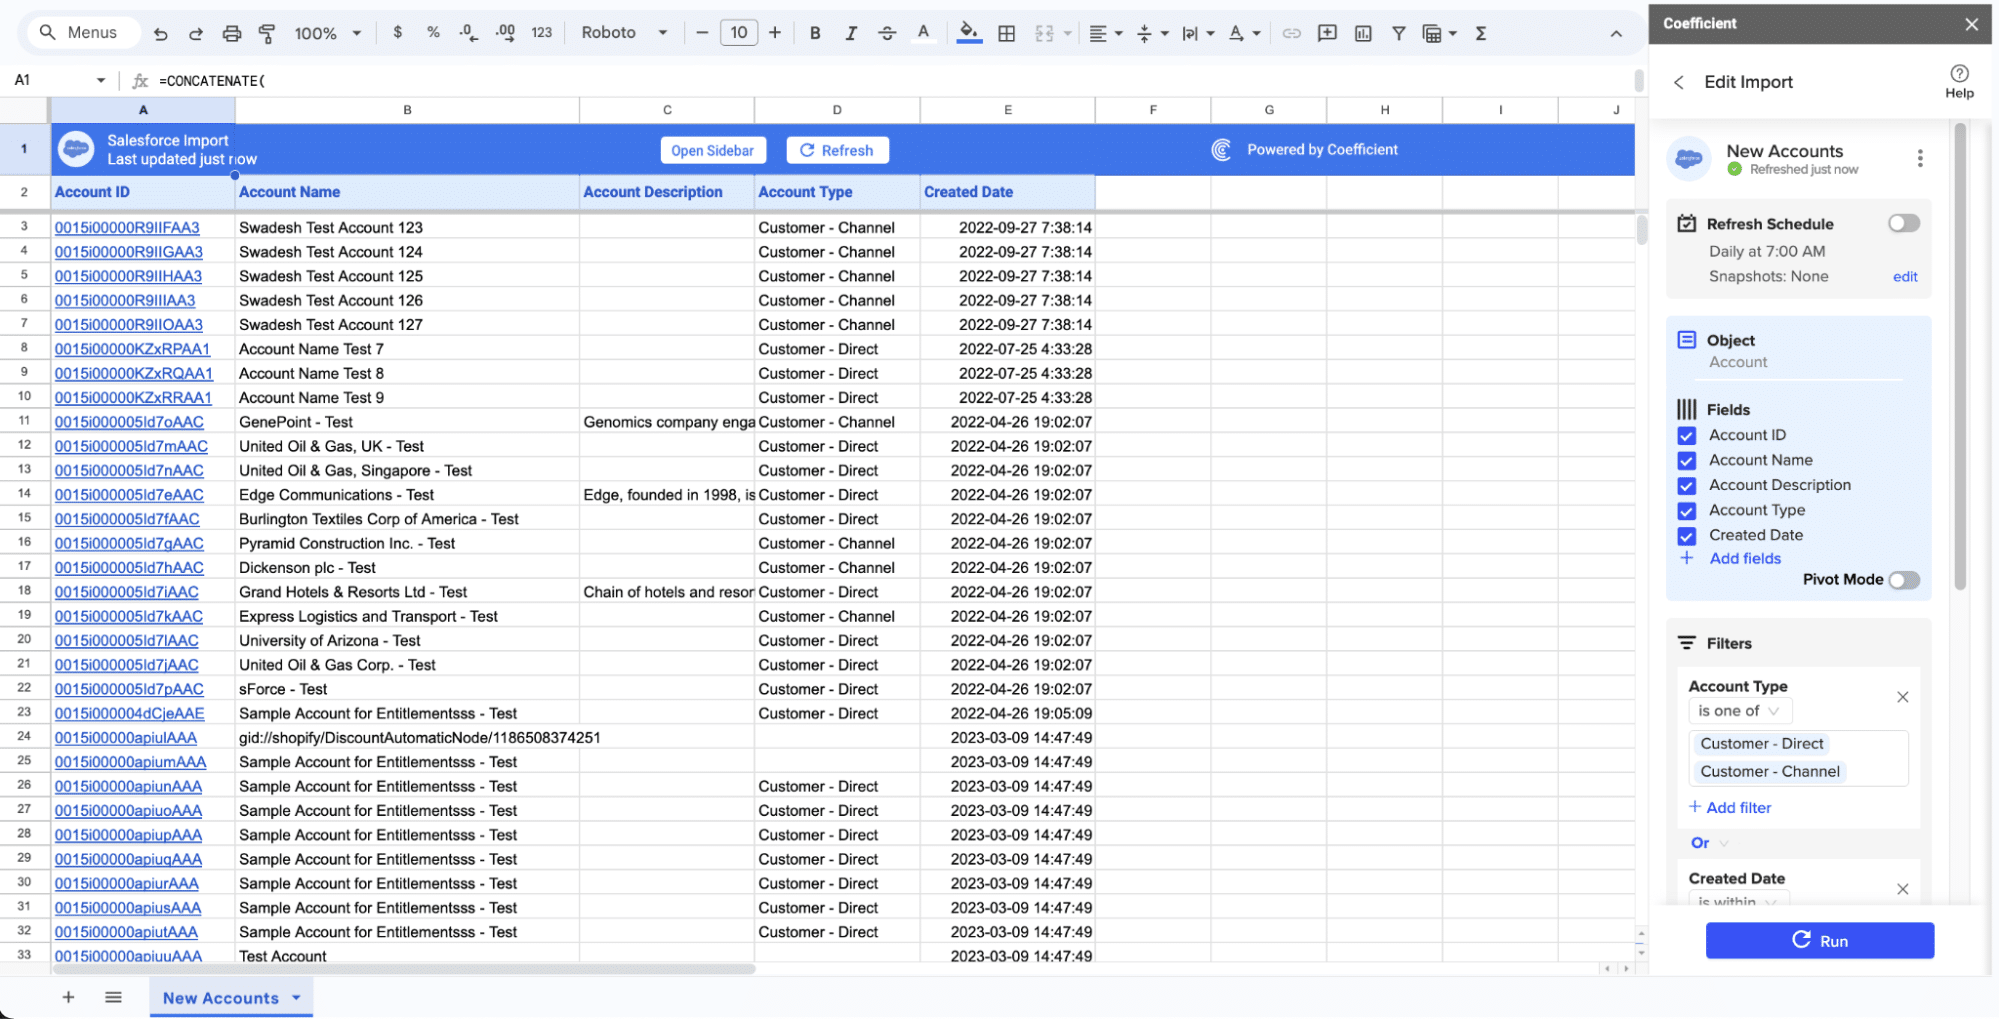
Step 2. Import Data:
- Once connected, “From Objects & Fields”
- Select relevant fields such as deal status, deal value, and close dates.
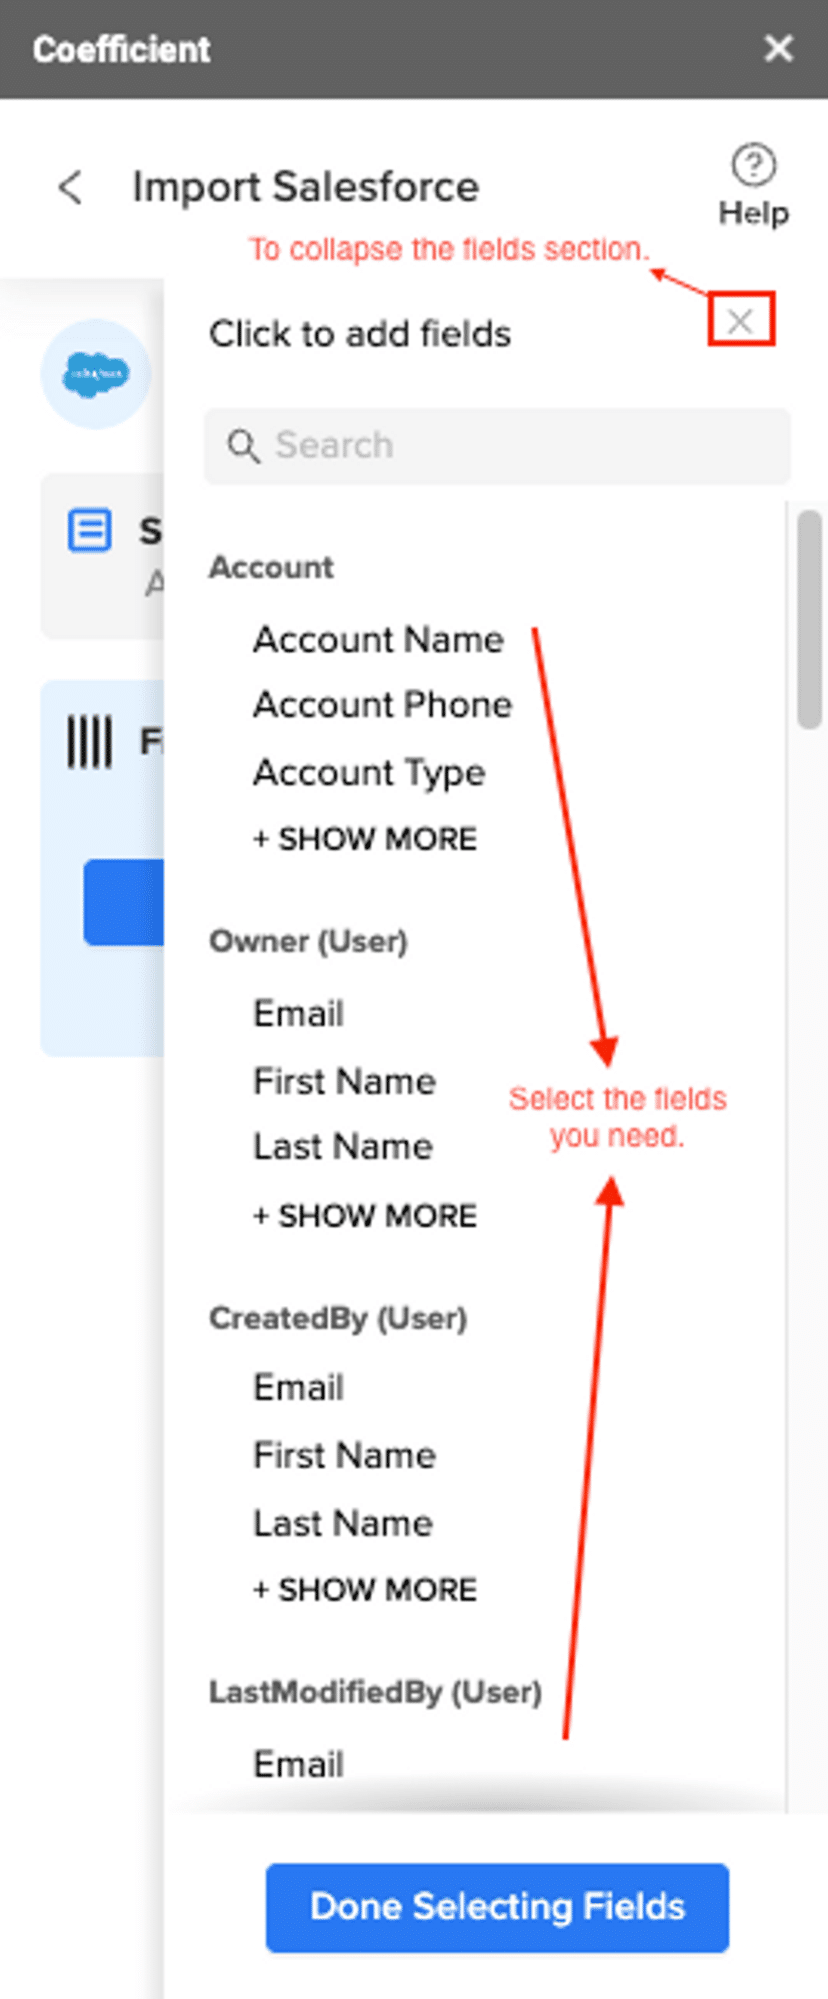
- Customize your import by choosing specific reports or creating a custom query.
Step 3. Create the Report:
- With data imported, calculate the win rate by dividing won deals by total deals.
- Use spreadsheet functions to summarize and visualize the data.
- Create pivot tables to group deals by status and calculate win rates for different time periods or sales reps.
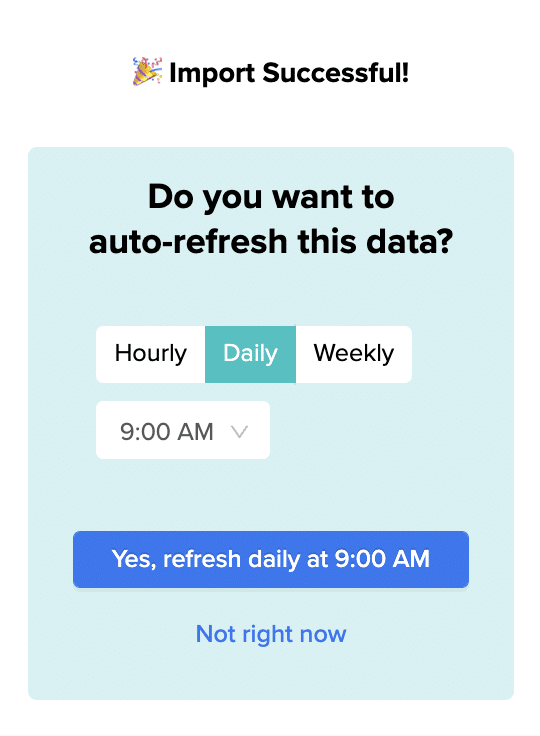
Step 4. Automate and Refresh:
- Set up automated data refreshes to keep your report current.
Step 5. Analyze and Share:
- Examine the data to identify trends and insights in win rates.
- Share the report with your team by granting access to the spreadsheet.
- Set up alerts via Slack or email to notify team members when new data is available.
Top Ad-hoc Reporting Tools
Coefficient

Coefficient is a powerful data integration and reporting tool designed to bridge the gap between complex data sources and familiar spreadsheet interfaces. It allows users to pull live data from various business systems directly into Excel and Google Sheets, enabling quick and easy ad-hoc report creation.
Features and capabilities:
- Live data sync from 50+ business systems, including CRM, marketing, and financial platforms
- Easy report building and refreshing in Excel and Google Sheets, with no-code formulas and functions
- Data writeback to source systems, enabling two-way data flow
- Automated report scheduling and alerts, with integrations to tools like Slack and email
Pros:
- Seamless integration with familiar spreadsheet tools, reducing the learning curve
- Real-time data updates ensure reports are always current
- Enterprise-grade security and access controls, including role-based permissions and audit logs
- Flexible customization options for reports and dashboards
Cons:
- Requires basic spreadsheet skills, which may be a barrier for some users
- May not be suitable for users who prefer drag-and-drop interfaces or more visual-based reporting tools
Best use cases:
- Cross-functional reporting, allowing different departments to access and analyze relevant data
- Financial analysis, including budgeting, forecasting, and variance analysis
- Sales and marketing performance tracking, with the ability to combine data from multiple sources
ThoughtSpot

ThoughtSpot is an AI-powered analytics platform that aims to make complex data analysis accessible to everyone through its intuitive search-based interface. It’s designed to help users quickly uncover insights from large datasets without requiring extensive technical knowledge.

Stop exporting data manually. Sync data from your business systems into Google Sheets or Excel with Coefficient and set it on a refresh schedule.
Get Started
Features and capabilities:
- Self-service analytics with natural language search, allowing users to ask questions in plain English
- AI-driven insights and anomaly detection, automatically surfacing important trends and outliers
- Embedded analytics options for integrating insights into existing applications and workflows
- SpotIQ AI Engine for automated analysis and insight generation
Pros:
- User-friendly interface suitable for non-technical users, promoting widespread adoption
- Quick insights from complex data, reducing time-to-insight
- Strong data visualization capabilities with automatic chart selection
- Scalable architecture capable of handling large datasets
Cons:
- Can be pricey for smaller organizations, potentially limiting accessibility
- Limited customization options compared to traditional BI tools, which may not suit all use cases
- Requires careful data preparation and modeling for optimal performance
Best use cases:
- Ad-hoc querying for non-technical users across various departments
- Exploratory data analysis in fast-paced business environments
- Organizations with large, complex datasets needing quick, AI-driven insights
Looker

Looker, now part of Google Cloud, is a powerful business intelligence and big data analytics platform. It’s known for its unique approach to data modeling and exploration, allowing organizations to create a single source of truth for their data.
Features and capabilities:
- Robust data modeling with LookML, a flexible and version-controlled modeling language
- Extensive data exploration and visualization options, including custom visualizations
- Embedded analytics capabilities for integrating insights into applications and workflows
- Powerful data governance and access control features
Pros:
- Powerful data modeling capabilities, enabling complex analysis and ensuring data consistency
- Flexible embedding options for custom applications, allowing for white-labeled analytics
- Strong collaboration features, including data actions and scheduling
- Integration with Google Cloud Platform for enhanced scalability and performance
Cons:
- Steep learning curve for LookML, requiring dedicated resources for implementation and maintenance
- Can be complex for casual users, potentially limiting widespread adoption
- Higher cost compared to some other BI solutions
Best use cases:
- Enterprise-wide data modeling and analysis, especially for organizations with complex data structures
- Organizations needing a centralized data platform to ensure consistency across departments
- Companies looking to embed analytics in their products or services
Power BI

Microsoft Power BI is a suite of business analytics tools that delivers insights throughout your organization. It offers a user-friendly interface for creating interactive visualizations and dashboards, along with robust data modeling capabilities.
Features and capabilities:
- Interactive dashboards and reports with a wide range of visualization options
- AI-powered insights and natural language Q&A for easy data exploration
- Integrations with other Microsoft products and third-party applications
- Power Query for advanced data transformation and preparation
Pros:
- Strong integration with Microsoft ecosystem, benefiting organizations already using Microsoft tools
- Robust visualization options with frequent updates and new features
- Regular updates and new features, ensuring the platform stays current with industry trends
- Scalable from individual users to enterprise-wide deployments
Cons:
- Can be overwhelming for new users due to the wide range of features and capabilities
- Limited free version, with more advanced features requiring paid licenses
- Some advanced features require coding knowledge (e.g., DAX for complex calculations)
Best use cases:
- Microsoft-centric organizations looking for seamless integration with existing tools
- Complex data visualizations and dashboards for data-driven decision making
- Organizations needing both self-service and enterprise BI capabilities within a single platform
Limitations and Challenges of Ad-hoc Reporting
While ad-hoc reporting offers numerous benefits, it’s important to be aware of potential pitfalls:
Data Quality and Completeness
Ensuring data accuracy is crucial, as ad-hoc reports are only as good as the data they’re based on. Inaccurate data can lead to flawed decisions and erode trust in the reporting system. Implement automated data quality checks and establish a data stewardship program to maintain data integrity.
Dealing with data silos can lead to incomplete or misleading insights. Tools like Coefficient help by connecting multiple data sources seamlessly, providing a unified view of data across the organization and enabling more comprehensive analyses.
User Expertise
Non-technical users may struggle with complex data analysis tools, leading to underutilization of the ad-hoc reporting system. Provide tiered training programs tailored to different user skill levels and consider implementing a mentorship program where advanced users guide beginners.
Without proper training, users might draw incorrect conclusions from the data, potentially leading to poor decision-making. Develop clear guidelines for data interpretation and analysis, and encourage a culture of data-driven decision making coupled with critical thinking.
Data Governance and Integrity
Maintaining data integrity is essential for reliable ad-hoc reporting. Implement a robust data governance framework that includes:
- Data quality management processes
- Clear data ownership and stewardship roles
- Consistent data definitions and metadata management
- Regular data audits and reconciliation procedures
Balancing data accessibility with governance requirements can be challenging. Implement role-based access control (RBAC) and regularly audit user permissions to ensure users have appropriate access to data while maintaining integrity.
Scalability
Some tools struggle with very large data volumes, leading to slow performance. Choose tools designed to handle big data or implement data summarization techniques. Consider implementing data caching or in-memory processing for frequently accessed data.
Complex queries can strain system resources, potentially impacting other users. Implement query optimization techniques and consider using query scheduling during off-peak hours. Educate users on efficient query design and provide guidelines for complex analyses.
Unlock the Potential of Ad-Hoc Reporting with Coefficient
Ad-hoc reporting is a powerful tool in the modern data professional’s arsenal, enabling agile decision-making and deeper insights. By understanding its capabilities, limitations, and best practices, you can harness the full potential of ad-hoc reporting to drive your organization forward.
Ready to transform your ad-hoc reporting capabilities? Try Coefficient today and experience the power of real-time data integration in your spreadsheets. Your journey to faster, more informed decision-making starts here.


