
As an early-stage startup, tracking the right metrics is crucial for making informed decisions and ensuring the success of your business. These early-stage startup metrics are your roadmap to growth, highlighting what works and guiding your strategy towards better results.
Coefficient’s dashboard templates simplify tracking these pivotal metrics, ensuring you’re equipped with the insights to navigate the startup landscape confidently.
In this blog post, we’ll explore the top 10 early-stage startup metrics you should be tracking in 2024 and how Coefficient’s templates can help you stay on top of your startup’s performance.
Top 10 Early-stage Startup Metrics for 2024
#1 Customer Lifetime Value (CLV)
Customer Lifetime Value (CLV) represents the total amount of revenue a customer is expected to generate throughout their relationship with your company. Tracking CLV helps you:
- Identify high-value customer segments: Focus on acquiring and retaining customers with the highest lifetime value.
- Optimize customer acquisition costs: Ensure that your customer acquisition costs are in line with the expected lifetime value of your customers.
- Make data-driven decisions: Use CLV data to inform product development, pricing strategies, and marketing initiatives.
How to Calculate: CLV = Average Revenue per Customer × Average Customer Lifespan
How Coefficient’s Customer Lifetime Value Template Can Help
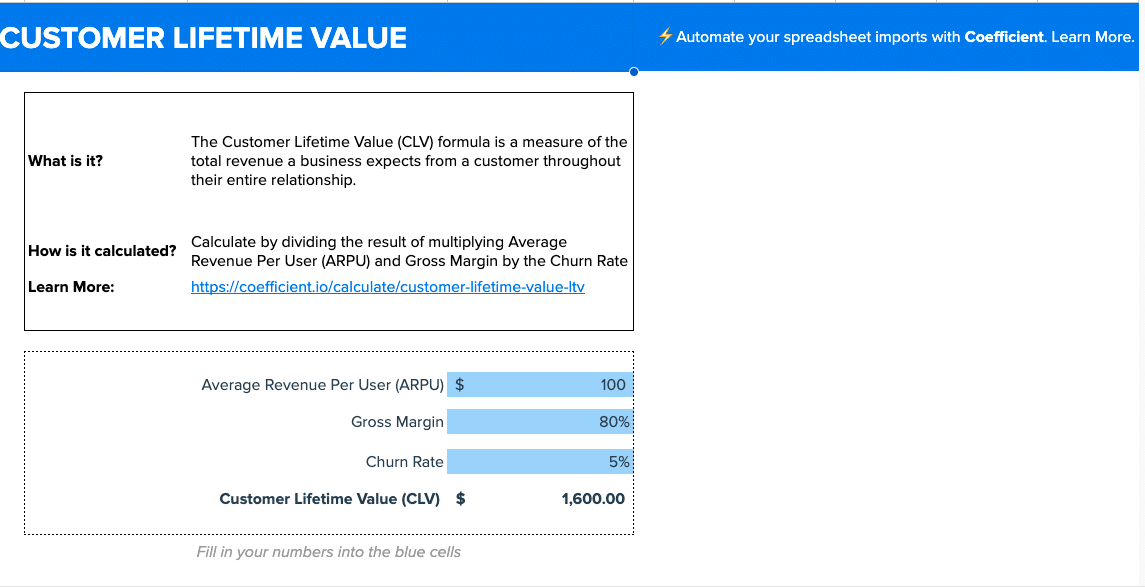
Coefficient templates offer a streamlined approach to monitoring CLV by integrating real-time data, enabling you to make informed adjustments promptly.
- See What Works: Quickly identify high-value customer segments and focus your efforts on them.
- Make Better Decisions: Use CLV data to guide product development, pricing, and marketing strategies.
- Customize Your Views: Create reports that make sense to you, so you can make smart decisions about your customers.
#2 Lead Conversion Rate
Lead Conversion Rate measures the percentage of leads that convert into paying customers. Monitoring this metric helps you:
- Assess the effectiveness of your lead generation efforts: Identify which channels and tactics are driving the most qualified leads.
- Optimize your sales funnel: Pinpoint areas where leads are dropping off and take corrective action.
- Forecast revenue: Use lead conversion data to predict future revenue and make informed business decisions.
How to Calculate: Lead Conversion Rate = (Number of Converted Customers / Total Number of Leads) × 100
How Coefficient’s Lead Conversion Rate Template Can Help
Coefficient facilitates easy analysis of lead conversion data, allowing for swift comparison and strategic enhancements based on live performance insights.
- Know What Converts: See clearly which lead generation efforts result in the most paying customers.
- Keep Getting Better: Use real data to optimize your sales funnel and improve lead conversion over time.
- See What’s Working: Identify the top-performing lead generation channels and tactics to focus your efforts.
#3 CAC:LTV Ratio
The CAC:LTV Ratio compares the cost of acquiring a customer (CAC) to their lifetime value (LTV). This metric helps you:
- Assess the sustainability of your business model: Ensure that the cost of acquiring customers is justified by their lifetime value.
- Optimize customer acquisition strategies: Identify and focus on the most cost-effective channels and tactics.
- Make informed investment decisions: Use CAC:LTV data to guide decisions on scaling your business and attracting investors.
How to Calculate: CAC:LTV Ratio = Customer Acquisition Cost / Customer Lifetime Value
How Coefficient’s CAC:LTV Ratio Template Can Help
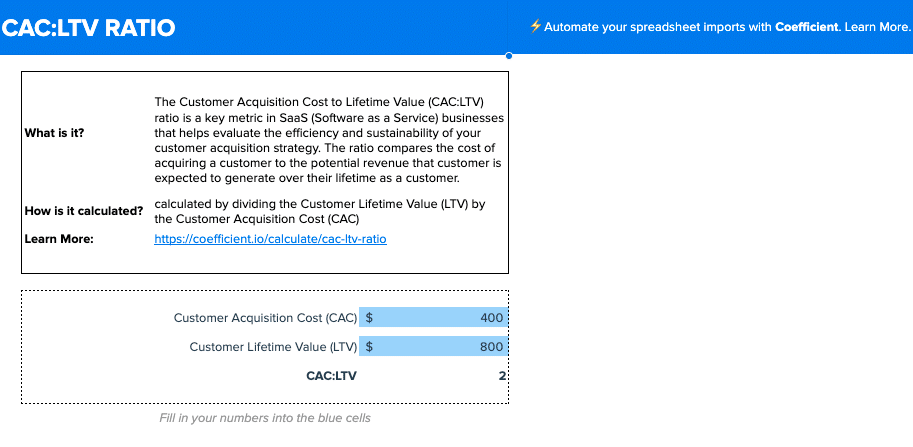
Using Coefficient, you can seamlessly bring CAC:LTV data into focus, offering actionable insights to refine your strategies in real time.
- Boost Profitability: Identify the most cost-effective customer acquisition channels and tactics.
- Smart Comparisons: See how different acquisition strategies stack up against each other in terms of CAC:LTV.
- Zoom In On What Works: Focus on making data-driven decisions that improve your CAC:LTV ratio over time.
Optimize your customer acquisition strategies with Coefficient’s CAC:LTV Ratio template!
#4 Customer Satisfaction Score (CSAT)
The Customer Satisfaction Score (CSAT) measures how satisfied your customers are with your product or service. Tracking CSAT helps you:
- Identify areas for improvement: Pinpoint aspects of your product or service that need attention.
- Reduce churn: Address customer concerns proactively and prevent them from leaving.
- Boost customer loyalty: Improve customer satisfaction to drive loyalty and positive word-of-mouth.
How to Calculate: CSAT is typically measured using a survey that asks customers to rate their satisfaction on a scale.
How Coefficient’s Customer Satisfaction Score Template Can Help
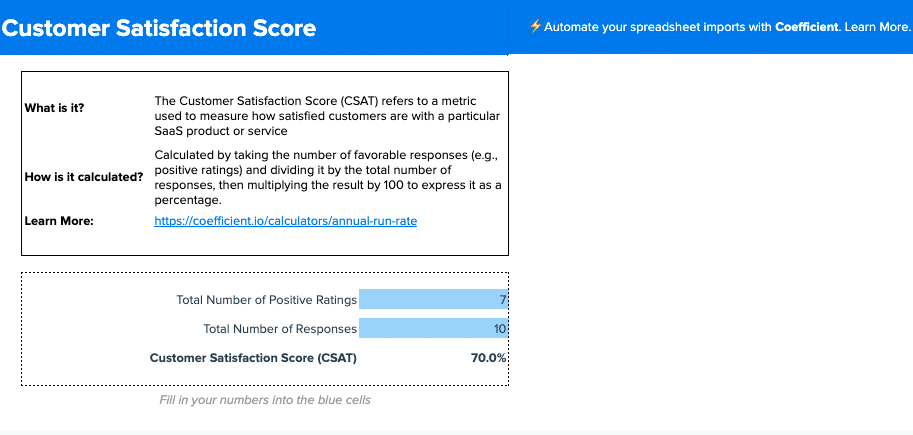
Coefficient simplifies the tracking and analysis of CSAT data, empowering your team with the necessary insights to refine and elevate customer experience strategies dynamically.
- Understand Customer Satisfaction: Get a clear picture of how satisfied your customers are with your product or service.
- Identify Areas for Improvement: Use CSAT feedback to pinpoint customer concerns and take action to address them.
- Track Progress Over Time: Monitor how your CSAT changes over time and measure the impact of your customer experience improvements.
Start measuring and improving customer satisfaction with Coefficient’s CSAT template!
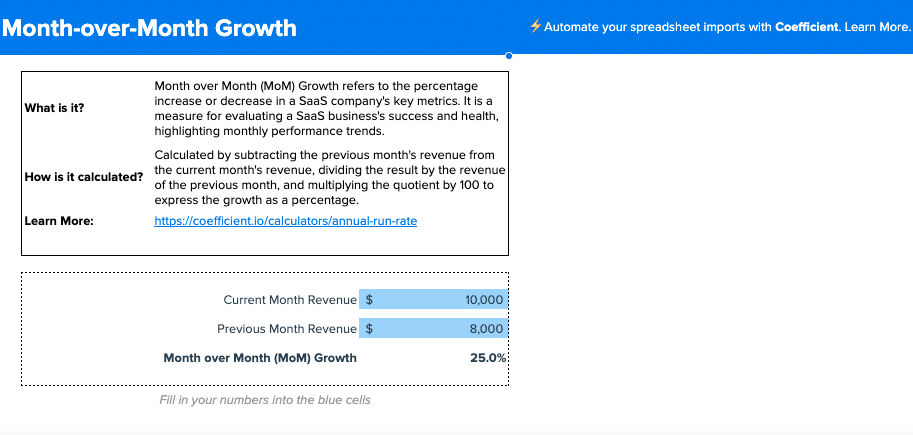
#5 Month Over Month Growth
Month-over-Month (MOM) Growth measures the percentage change in a key metric, such as revenue or user base, from one month to the next. Monitoring MOM Growth helps you:
- Assess the pace of your startup’s growth: Identify trends and patterns in your growth trajectory.
- Set realistic goals: Use MOM Growth data to establish achievable targets and milestones.
- Make data-driven decisions: Adjust your strategies based on the insights gained from MOM Growth analysis.
How to Calculate: Compare the value of a metric in the current month to its value in the previous month.
How Coefficient’s MOM Growth Template Can Help
Coefficient’s MOM Growth template makes it easy to track and analyze this essential metric, providing a clear view of your startup’s growth.
- Monitor Growth Trends: Quickly assess the pace and consistency of your startup’s growth over time.
- Set Realistic Goals: Use historical MOM Growth data to establish achievable targets and milestones.
- Identify Growth Drivers: Analyze MOM Growth data to identify the key drivers of your startup’s growth and focus your efforts accordingly.
Track your startup’s growth with Coefficient’s Month-over-Month Growth template.
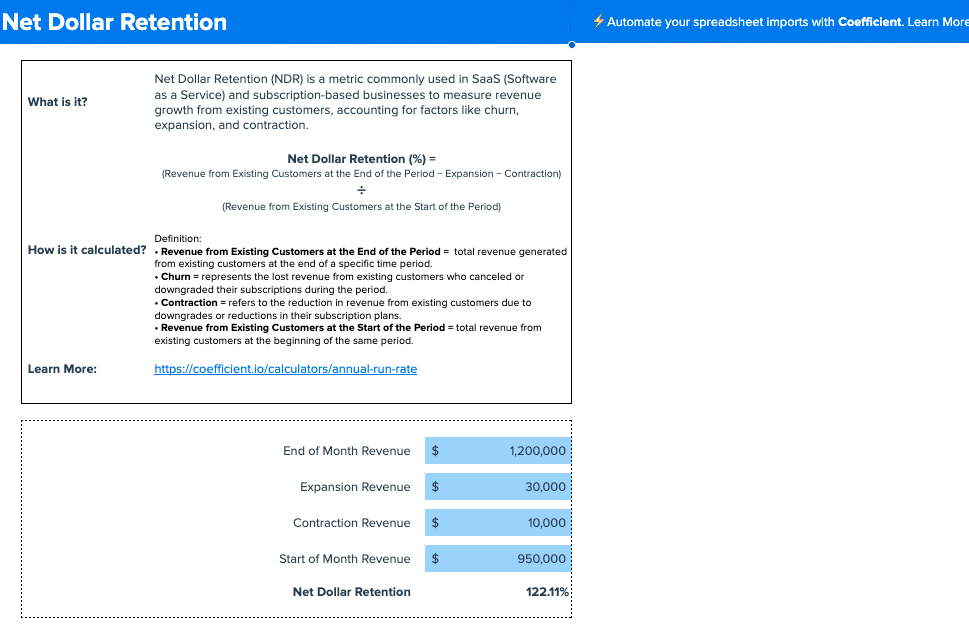
#6 Net Dollar Retention
Net Dollar Retention measures the percentage of revenue retained from existing customers over a given period, taking into account upgrades, downgrades, and churn. Tracking this metric helps you:
- Assess customer loyalty: Understand how well you are retaining and expanding revenue from existing customers.
- Identify churn risks: Pinpoint customer segments or product areas that are at risk of churn.
- Inform growth strategies: Use Net Dollar Retention data to guide decisions on customer success, upselling, and cross-selling.
How to Calculate: Net Dollar Retention = (Monthly Recurring Revenue + Upgrades – Downgrades – Churn) / Monthly Recurring Revenue at the Beginning of the Period
How Coefficient’s Net Dollar Retention Template Can Help
Coefficient’s Net Dollar Retention template makes it easy to track and analyze this essential metric, providing a clear view of customer loyalty and revenue retention.
- Monitor Customer Loyalty: Quickly assess how well you are retaining and expanding revenue from existing customers.
- Identify Churn Risks: Use Net Dollar Retention data to pinpoint customer segments or product areas at risk of churn.
- Inform Growth Strategies: Leverage Net Dollar Retention insights to guide decisions on customer success, upselling, and cross-selling.
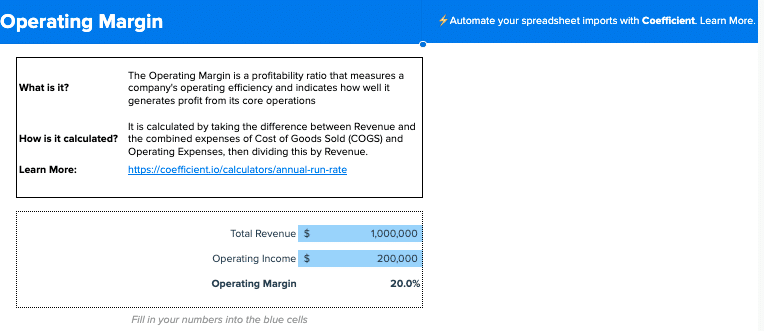
#7 Operating Margin
Operating Margin measures the percentage of revenue that remains after deducting operating expenses, indicating a startup’s operational efficiency and profitability. Tracking this metric helps you:
- Assess profitability: Understand how much of your revenue is being converted into profits.
- Identify cost reduction opportunities: Pinpoint areas where you can reduce operating expenses and improve profitability.
- Inform pricing and budgeting: Use Operating Margin data to guide decisions on pricing strategies and resource allocation.
How to Calculate: Operating Margin = (Operating Income / Revenue) × 100
How Coefficient’s Operating Margin Template Can Help
Coefficient’s Operating Margin template simplifies the process of tracking and analyzing this critical financial metric, providing real-time insights into your startup’s profitability.
- Monitor Profitability: Quickly assess how much of your revenue is being converted into profits.
- Identify Cost Reduction Opportunities: Use Operating Margin data to pinpoint areas where you can reduce operating expenses and improve profitability.
- Inform Pricing and Budgeting: Leverage Operating Margin insights to guide decisions on pricing strategies and resource allocation.
Start monitoring your startup’s profitability with Coefficient’s Operating Margin template.
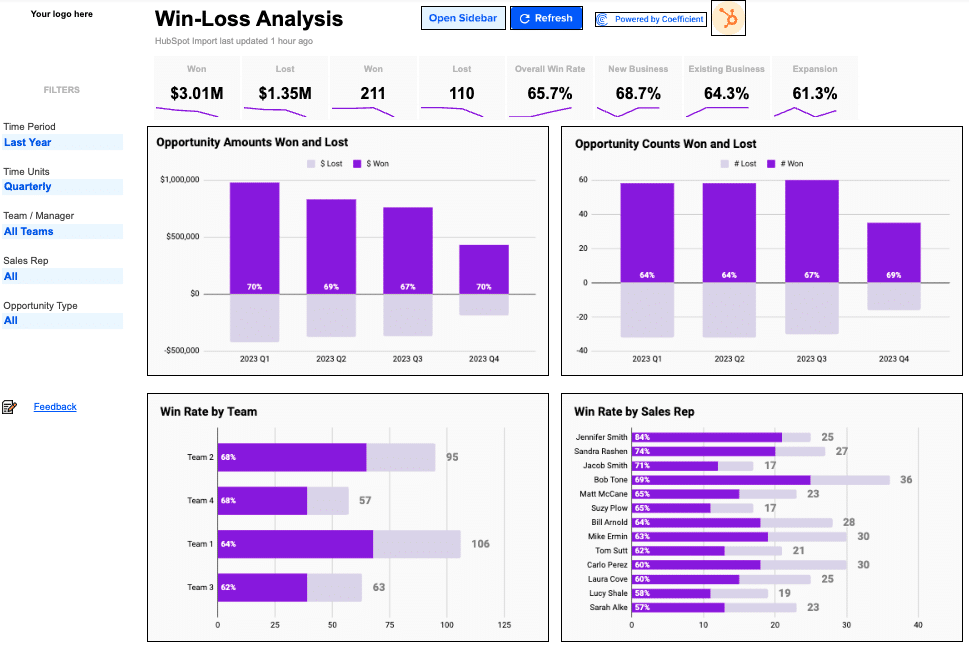
#8 Win / Loss Analysis
Win / Loss Analysis helps you understand the factors that influence your sales outcomes and identify areas for improvement. This metric offers several benefits:
- Identify success factors: Pinpoint the strategies, tactics, and behaviors that lead to closed-won deals.
- Address weaknesses: Identify and address the factors contributing to lost opportunities.
- Improve sales processes: Use insights from win/loss analysis to optimize your sales approach and increase win rates.
How to Calculate: Analyze closed-won and closed-lost opportunities, and identify the key factors that influenced each outcome.

Stop exporting data manually. Sync data from your business systems into Google Sheets or Excel with Coefficient and set it on a refresh schedule.
Get Started
How Coefficient’s Win / Loss Analysis Template Can Help
Coefficient’s Win / Loss Analysis template makes it easy to conduct this critical analysis, with live data integration and customizable reports.
- Identify Key Factors: Quickly identify the factors that contribute to won and lost deals.
- Spot Trends: Use historical data to identify patterns and trends in your win/loss outcomes.
- Customize Analysis: Create reports tailored to your specific needs, so you can focus on the most relevant factors.
Gain valuable insights into your sales outcomes with Coefficient’s Win / Loss Analysis template.
#9 Website Performance
Website Performance metrics help you understand how your website is contributing to your startup’s growth. Tracking these metrics helps you:
- Assess user engagement: Measure how users interact with your website and identify areas for improvement.
- Optimize conversion rates: Identify opportunities to improve your website’s conversion rates and drive more leads or sales.
- Make data-driven decisions: Use website performance data to inform decisions on website design, content, and user experience.
How to Calculate: Use tools like Google Analytics to track metrics such as bounce rate, time on site, and conversion rates.
How Coefficient’s Website Performance Template Can Help
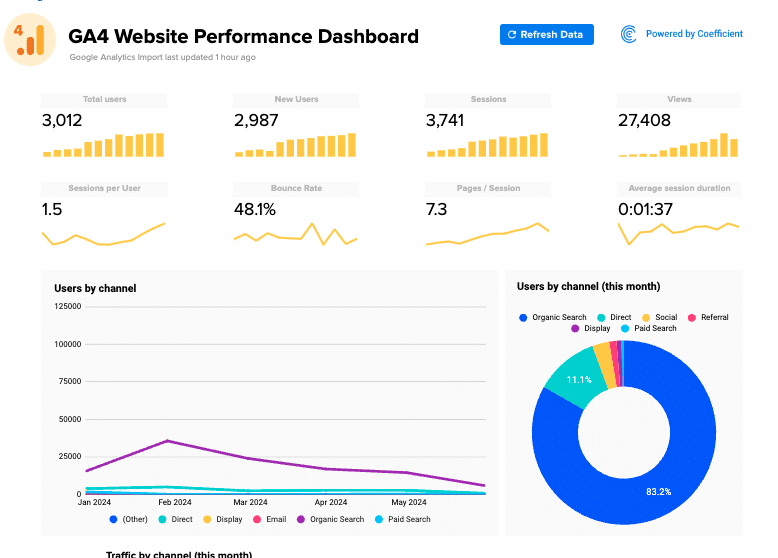
Coefficient’s Website Performance template simplifies the process of tracking and analyzing these critical metrics, providing real-time insights into your website’s performance.
- Monitor User Engagement: Quickly assess how users are interacting with your website and identify areas for improvement.
- Optimize Conversion Rates: Use website performance data to identify opportunities to improve your website’s conversion rates and drive more leads or sales.
- Make Data-Driven Decisions: Leverage website performance insights to guide decisions on website design, content, and user experience.
Gain insights into your website’s performance with Coefficient’s Website Performance template.
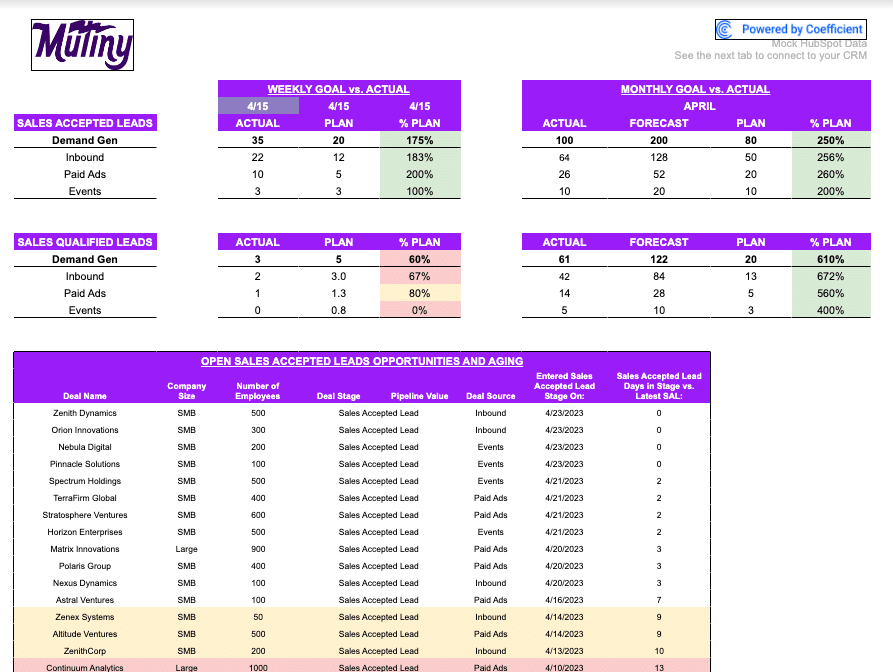
#10 Opportunity History
Tracking the progression of opportunities through the sales funnel is essential for understanding the health of your pipeline. By monitoring opportunity history, you can:
- Identify bottlenecks: Pinpoint stages where opportunities stall and take corrective action.
- Forecast accurately: Use historical data to predict future sales performance.
- Optimize sales processes: Continuously improve your sales approach based on data-driven insights.
How to Calculate: Measure the number of opportunities that move from one stage to another over a given period.
How Coefficient’s Opportunity History Template Can Help
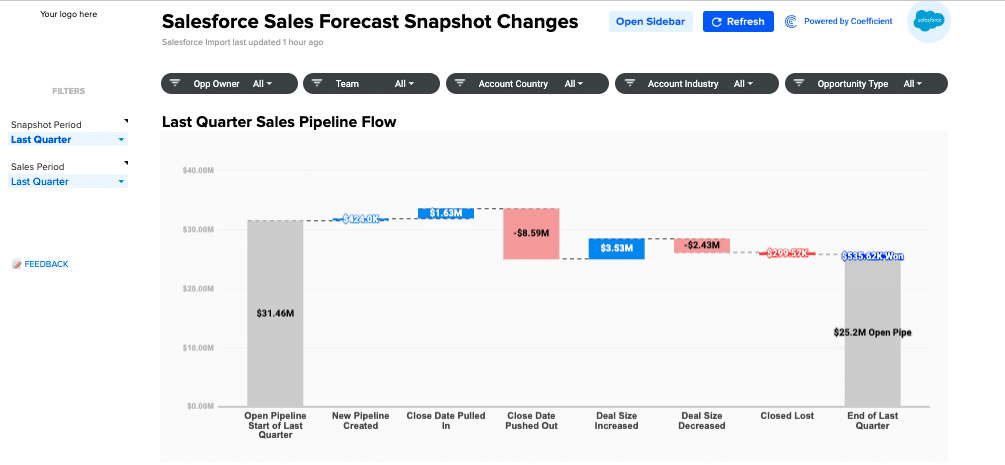
Coefficient templates offer a streamlined approach to monitoring opportunity history by integrating real-time data, enabling you to make informed adjustments promptly.
- See What Works: Quickly identify stages where opportunities are progressing smoothly or getting stuck.
- Make Better Decisions: Use opportunity history data to guide process improvements and resource allocation.
- Customize Your Views: Create reports that make sense to you, so you can make smart decisions about your sales funnel.
Download the Opportunity History template and start optimizing your sales funnel today.
Advantages of Using Coefficient’s Templates for Early-stage Startup Metrics
Coefficient’s pre-built templates offer several advantages for early-stage startups looking to track and analyze key metrics:
Time-saving: Spend less time setting up and maintaining spreadsheets, and more time focusing on growing your business.
Customizable: Tailor the templates to your startup’s unique needs and preferences.
Real-time data: Integrate live data from various sources to ensure you’re always working with up-to-date information.
Collaborative: Share templates with your team and stakeholders for seamless collaboration and transparency.
Success Story: How Miro’s RevOps Team Redefined Data Empowerment While Navigating Hyper-Growth
Miro, a product-led SaaS company that helps distributed teams to build, iterate and design faster via a shared workspace for innovation, faced challenges with managing data workflows amidst rapid growth and constant change. The RevOps team needed to build a robust data infrastructure and standardized reporting in parallel.
By adopting Coefficient, Miro’s RevOps team was able to work autonomously, no longer dependent on other departments for data or tools. Coefficient enabled quick testing and refining of methodologies before committing them to more permanent SaaS solutions, empowering the team to construct applications directly within spreadsheets, tailoring the duration and effort based on the intricacy of the project.
“With Coefficient, our spreadsheets became true powerhouses of functionality. Not only could I design and optimize solutions, but I also could manage analytics, data modeling, hygiene reporting, and error checks with more scalability than ever before in Salesforce,” says Alexander Bugajski, Miro’s Head of Go-to-Market (GTM) Strategy.
Read the full story to learn how Miro’s RevOps team leveraged Coefficient to navigate hyper-growth.
Conclusion
Tracking the right metrics is essential for the success of any early-stage startup. By focusing on the top 10 metrics outlined in this blog post and leveraging Coefficient’s pre-built templates, you can gain valuable insights into your startup’s performance, make data-driven decisions, and optimize your strategies for growth.
Coefficient’s customizable templates make it easy to track and analyze critical early-stage startup metrics, from Customer Lifetime Value and Lead Conversion Rate to Customer Satisfaction Score and Month-over-Month Growth. With real-time data integration and collaborative features, Coefficient empowers startups to work more efficiently and effectively.
Streamline your early-stage startup’s metric tracking with Coefficient. Get started today for free!


