


Table of Contents
![]()
- 1. How to Access the HubSpot Deal API with No Dev Help
- 2. Track & Export Property History from HubSpot in Your Spreadsheet
- 3. 15 Essential HubSpot Dashboards for RevOps & GTM Teams
- 4. How to Merge Contacts in Hubspot: Step-by-Step Guide [2025]
- 5. How to Change Lead Status in HubSpot (2025 Guide)
- 6. How to add Custom Fields in HubSpot?
- 7. How to Export HubSpot Data to Google Sheets in 2026
- 8. How to Connect HubSpot to Excel in 2025?
- 9. HubSpot Writebacks: How to Upload Data to HubSpot
- 10. How to Get Around HubSpot’s API Limits: Over 10,000 Objects Error
- 11. How to Embed Google Sheets Charts into a HubSpot Dashboard
- 12. Salesforce to HubSpot Migration: Top Tools and Tutorials
- 13. Migrating from Pipedrive to HubSpot: Best Practices and Guide

Harnessing the power of Google Sheets within HubSpot dashboards brings a new level of efficiency and clarity to your data analysis and reporting.
Whether it’s tracking sales performance, monitoring marketing campaigns, or managing customer data, this integration offers a seamless solution for your data-driven tasks.
In this guide, you’ll learn the step-by-step process to embed Google Sheets charts into a HubSpot dashboard.
Let’s dive in!
Why Embed Google Sheets into a HubSpot Dashboard?
Embedding Google Sheets into HubSpot enables you to view live, interactive charts alongside your HubSpot reports.
This integration is a boon for professionals using HubSpot’s various hubs like Marketing, Sales, Service, Operations, and CMS.
Note: In this guide, we are using a pre-existing chart created in Google Sheets. This approach assumes you have already set up your chart with the relevant data for your project.
Want to see how it works in a quick video instead?
Step-by-Step Guide to Embedding Google Sheets into HubSpot
Prepare Your Google Chart
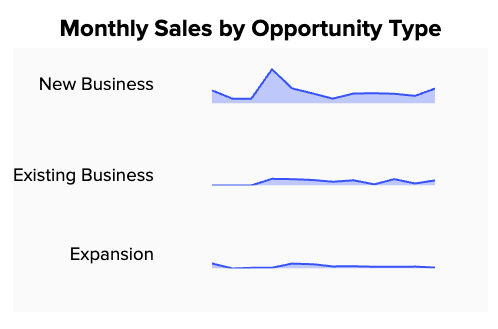
Create a chart in Google Sheets.
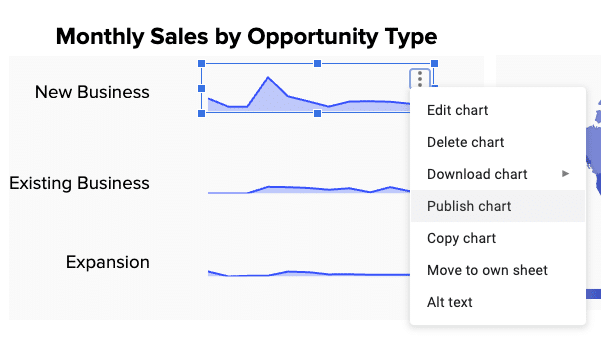
Click the ‘…’ icon on the chart corner and select ‘Publish chart’.
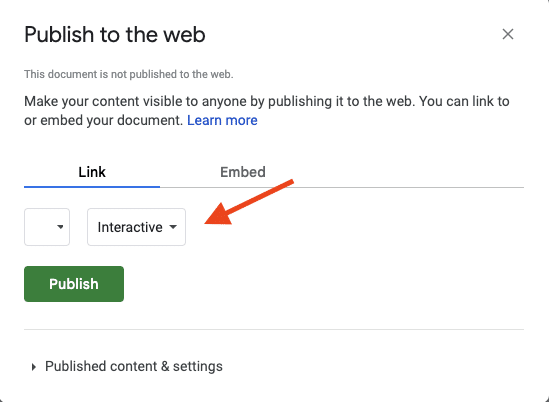
Ensure ‘Interactive’ is selected under the ‘Link’ tab.
Tick ‘Automatically republish when changes are made’.
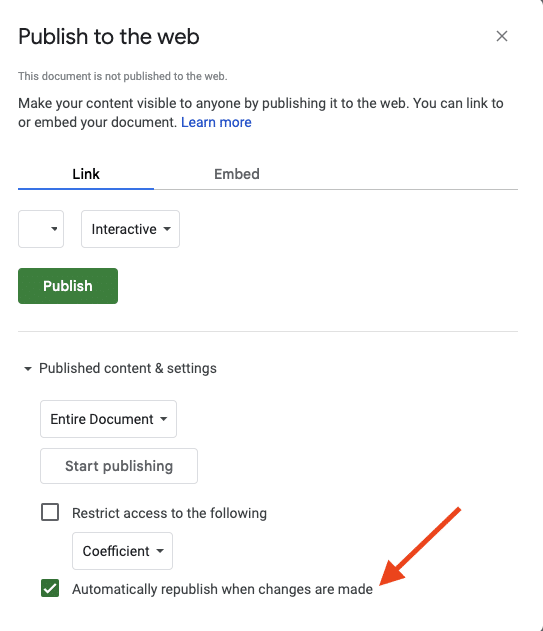
Click ‘Publish’.
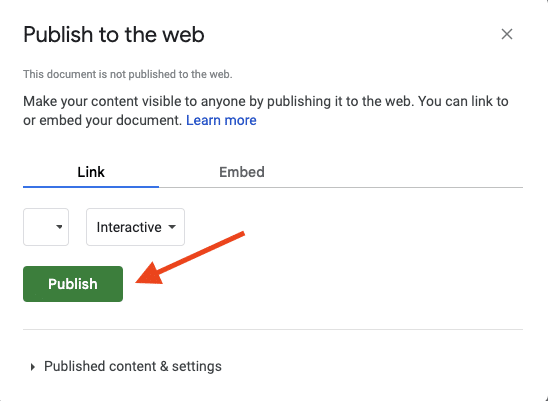
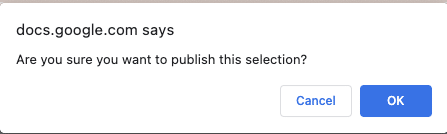
Select ‘OK’ from the dialogue box.
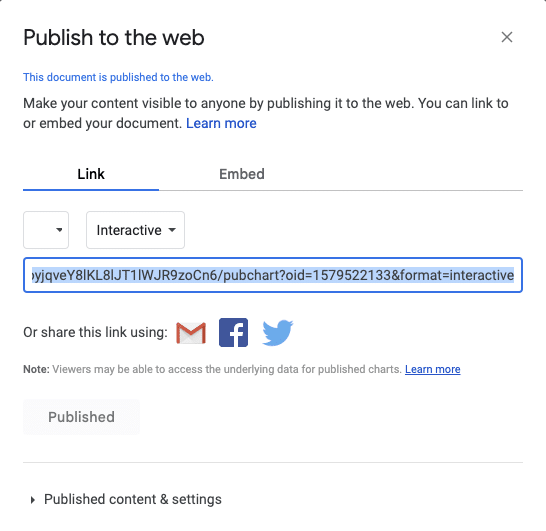
Copy the embed link.
Embed in HubSpot Dashboard
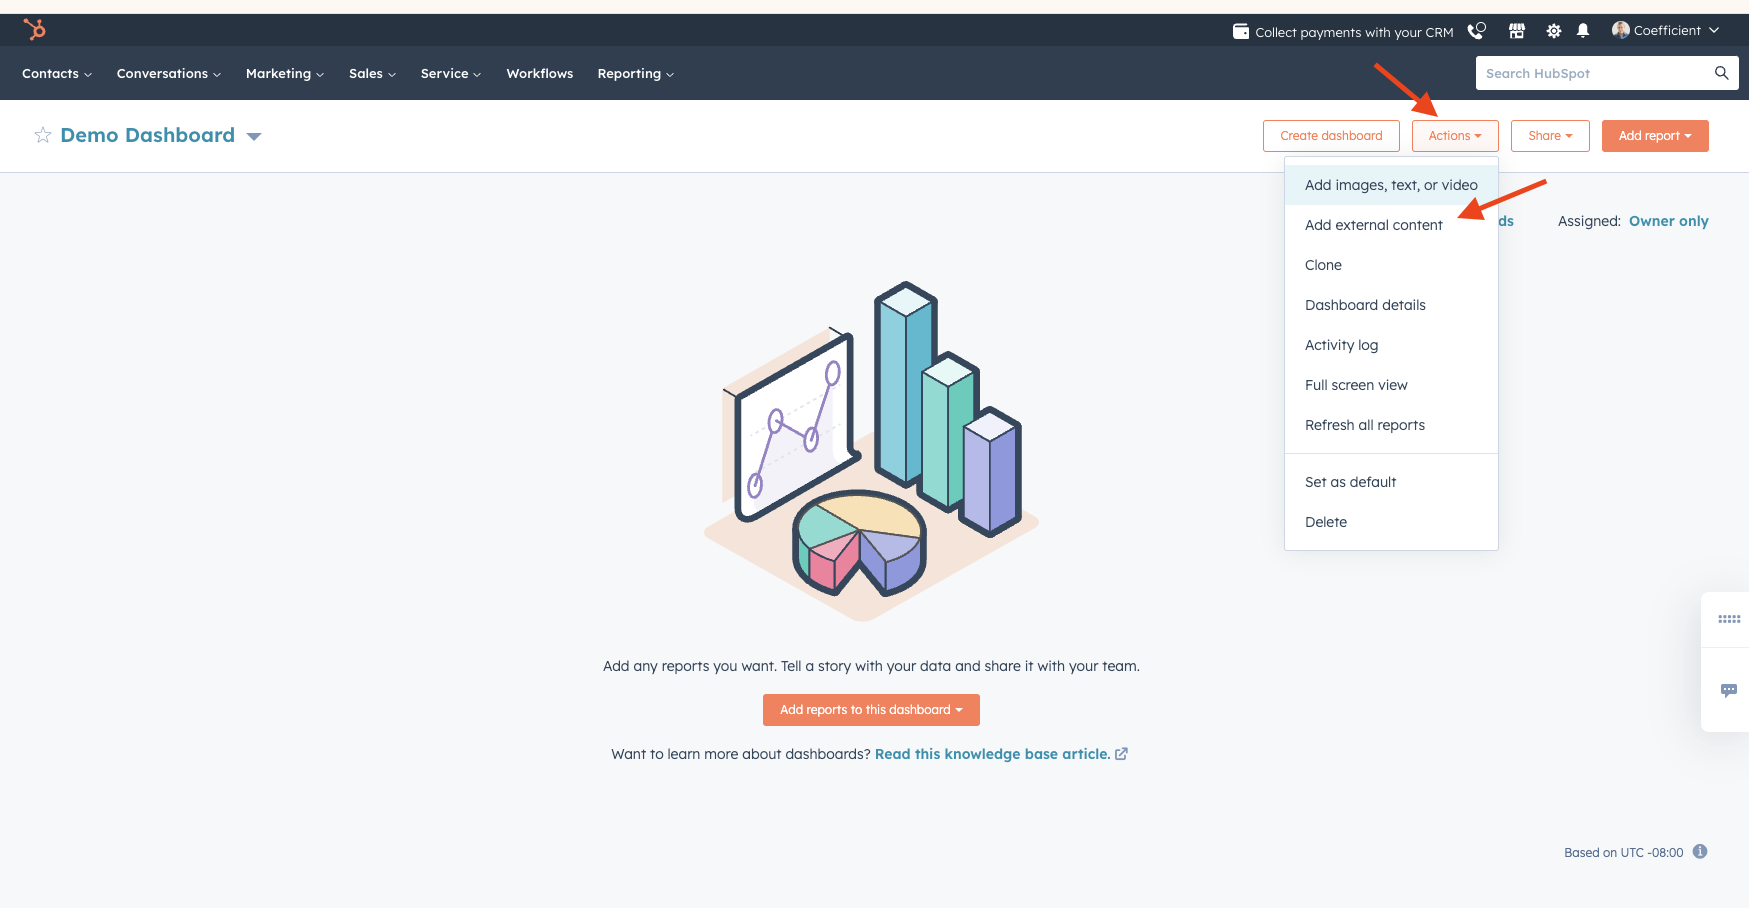
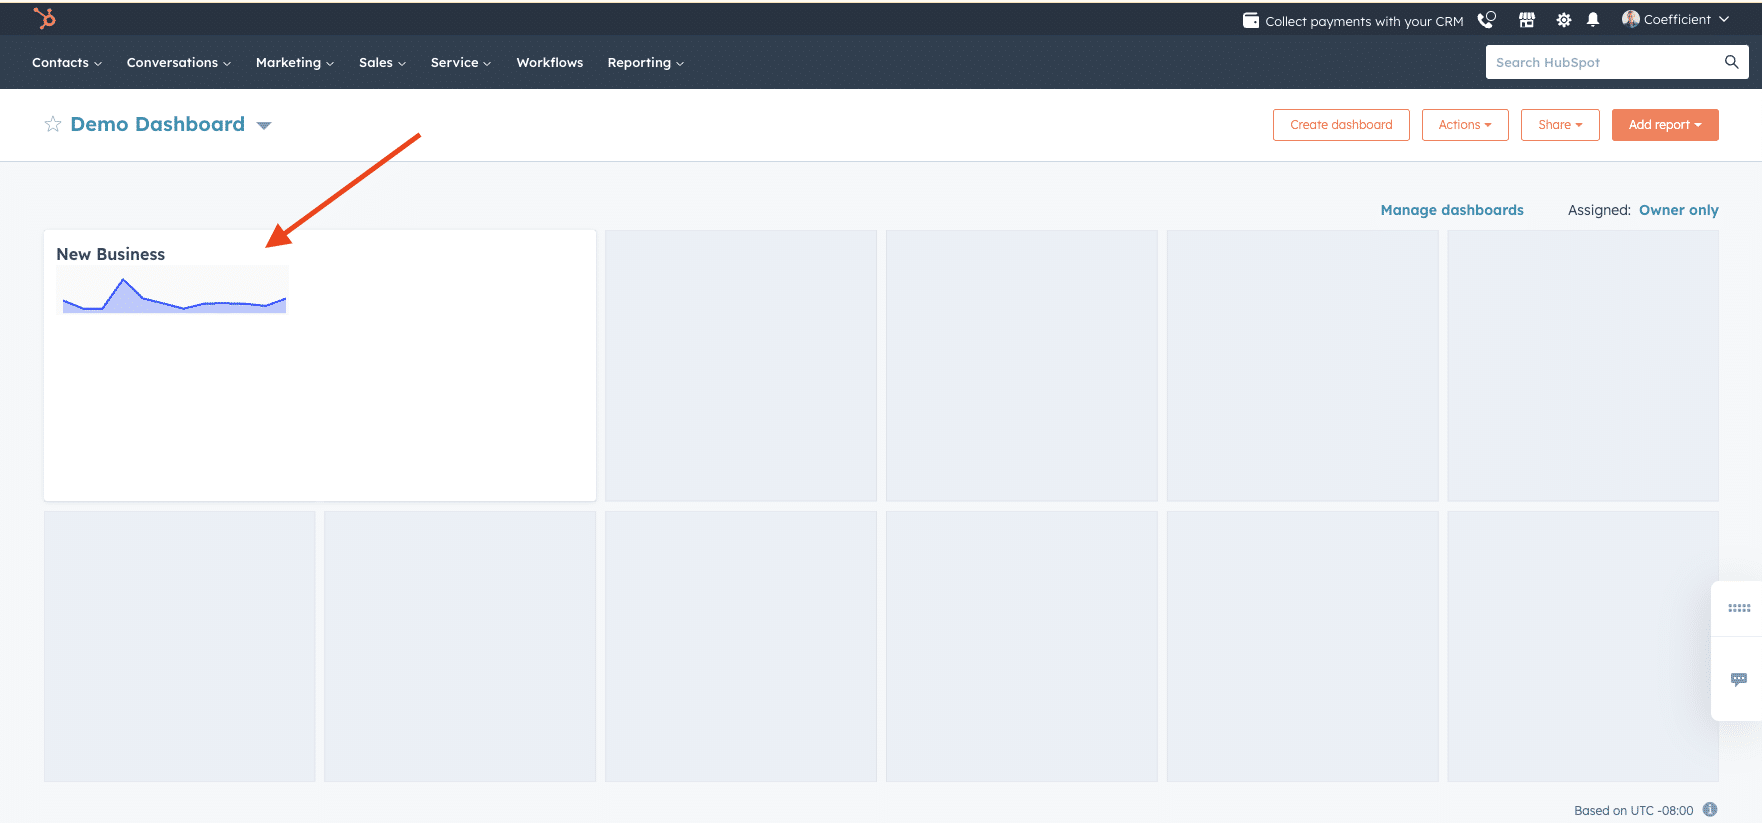
Log into your HubSpot account and navigate to Reporting > Dashboards.Select the dashboard where you wish to add the chart.
Click Actions in the upper right, then choose ‘Add external content’.
Insert the copied Google Sheets link and click ‘Add’.
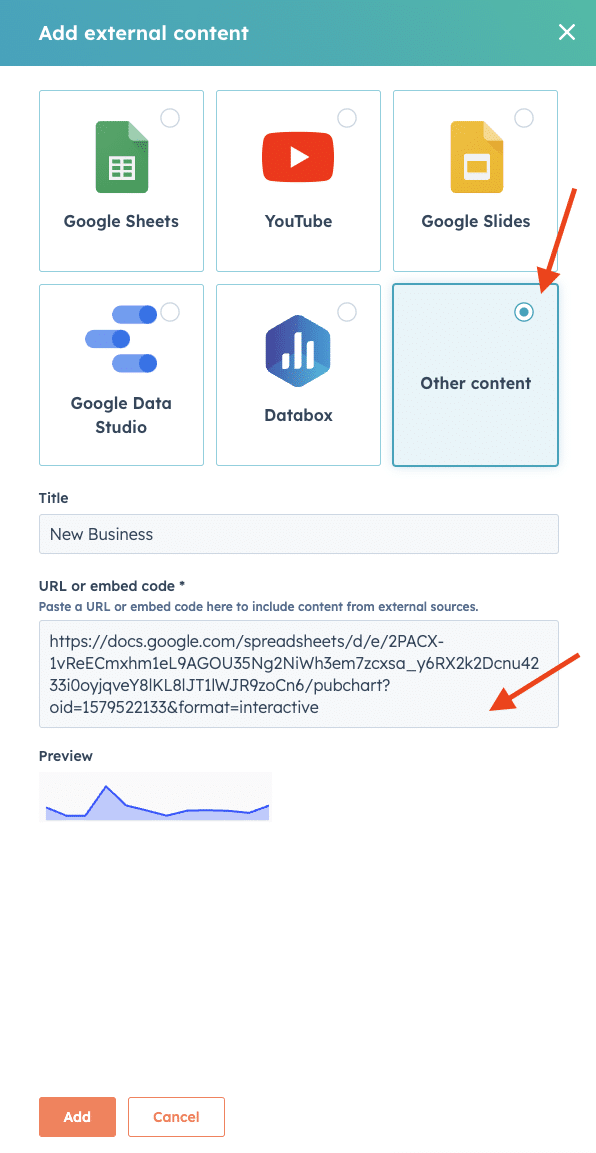
View the chart on your dashboard, which is now live and interactive.
Conclusion
Integrating live, interactive Google Sheets charts into HubSpot dashboards is a business game-changer. It brings data visibility to the forefront, aiding in more strategic and informed decision-making across various departments.
