

Most BI tool roundups are written for enterprise buyers. They assume a data engineering team, a six-figure software budget and analysts who will spend weeks onboarding a new platform. The tools that top those lists, Tableau, Looker, Qlik, reflect that assumption. This guide is for a different buyer.
37% of small businesses now use AI for data analysis and business intelligence, up from near zero three years ago. But the tools built for enterprise BI remain out of reach: only 32% of business leaders believe they can actually generate value from enterprise data, and the gap is widest for smaller teams that lack dedicated analytics resources. The challenge is not access to data. It is access to tools that fit the budget, the team size and the level of technical expertise actually available.
This guide covers the BI tools that work for businesses under 200 people. Pricing transparency matters more than custom enterprise quotes. Ease of use matters more than feature depth. And the total cost when you include viewers, not just builders, matters more than the entry-level price.
What Small Business BI Actually Needs
Before evaluating any tool, it is worth being specific about what makes BI work for a small team. Four requirements separate tools that fit from ones that look right on a feature page but break down in practice.
Transparent pricing you can calculate without a sales call
Many BI vendors do not publish pricing. That is a red flag for a small business with a predictable budget. If you cannot calculate your actual bill, including per-viewer costs, connector fees and overage charges, before speaking to a sales team, the tool was not designed with your team in mind. Every tool on this list has pricing you can verify independently.
Self-serve for the people who consume reports, not just the people who build them
The goal of BI in a small business is to reduce the number of data requests that route back to one person. If end users need help every time they want a new filter or a different date range, the tool has not solved the bottleneck. True self-serve means the people consuming reports can explore their own data without filing a request.
Setup time measured in days, not months
Enterprise BI tools typically take weeks or months to configure before delivering any value. For a small business without a dedicated implementation team, time-to-first-insight is the most important metric in the evaluation. Tools that require a data model to be built before anyone can see a dashboard are enterprise tools regardless of what their pricing page says.
Total cost per viewer that does not punish growth
A tool priced at $14 per user per month sounds affordable until you add the 15 people in leadership who need read-only access. Calculate the cost for every person who will consume reports, not just the one person who builds them. Per-seat pricing at scale can turn a $50 per month tool into a $500 per month problem within a year.
Free and Low-Cost Options
These tools have genuine free tiers or entry points under $50 per month. They are worth evaluating before committing to a paid platform, particularly if your data lives primarily in Google’s ecosystem or a single source system.
Looker Studio

Looker Studio is completely free, with no user limit and no feature tiers on the core product. It connects to 800+ data sources through native Google connectors and community connectors, and produces shareable dashboards that update automatically. For teams already using Google Analytics, Google Ads, Google Sheets or BigQuery, Looker Studio is the obvious starting point because the native connectors are free and setup takes hours, not weeks. The limitations are worth knowing before you commit: no native alerting when a KPI drops, unreliable data blending across more than three or four sources, no row-level security to show different users only their own data, and community connectors for non-Google sources like Salesforce or HubSpot typically cost $20 to $500 per month on top of the free tool. For teams whose data lives outside Google’s ecosystem, those connector costs add up quickly. Looker Studio Pro adds team asset management at $9 per user per month, but most small teams do not need it.
Zoho Analytics
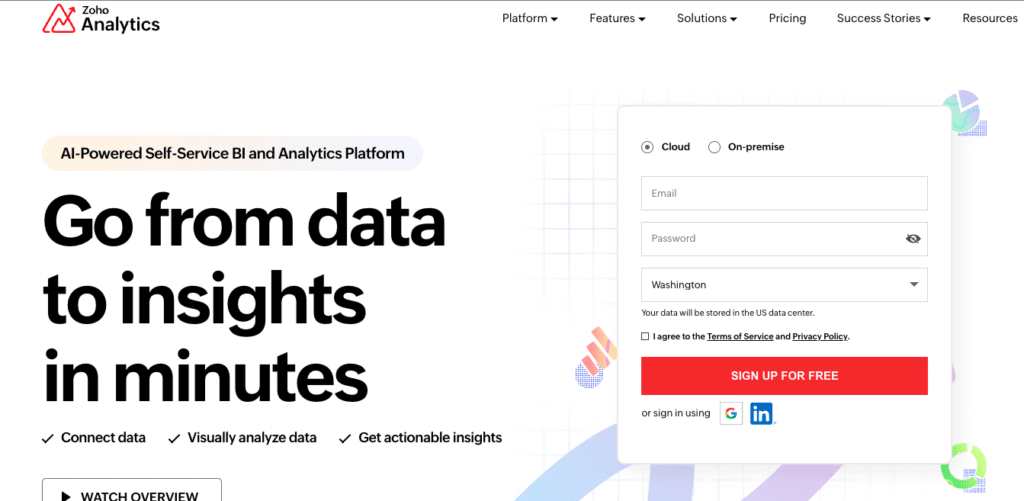
Zoho Analytics is the most accessible full-featured BI platform for small teams. It connects to CRMs, accounting tools, databases and 500+ other sources, and the Zia AI assistant answers natural language questions and flags anomalies without requiring a data model to be built first. Pricing starts at $30 per month for the Basic plan, with Standard at $60, Premium at $145 and Enterprise at $575 per month. The Basic and Standard plans cover most small business reporting needs and the per-month pricing is genuinely transparent. If your business already uses other Zoho products like Zoho CRM or Zoho Books, the integration is strong and the value compounds. The main constraint is depth: as reporting requirements grow more complex, teams regularly outgrow it past 50 to 100 people.
Power BI
Power BI is the default BI choice for Microsoft-heavy organizations. The free Power BI Desktop app is capable for individual report authoring. Check your existing Microsoft 365 license before evaluating anything else. A version of Power BI may already be included, which changes the cost calculation entirely. Sharing reports with others requires Power BI Pro at $14 per user per month, and every viewer needs a seat. The Copilot add-on costs $30 per user per month on top of that. For a 20-person business where 15 people need to view reports, the monthly cost reaches $210 before Copilot. That is manageable, but worth calculating before you start. Power BI connects deeply with Excel, Teams and Azure, and for organizations already paying for Microsoft 365 it is genuinely the best-value starting point. The setup requires more configuration than Zoho Analytics or Looker Studio, and getting value from the AI features requires clean, well-structured data models that take time to build correctly.
Live Connected Data with AI Dashboards
This category is the most relevant for small businesses whose data lives across multiple systems: a CRM, an accounting tool and a marketing platform. The tools here eliminate the manual data-pull step that consumes hours every reporting cycle and add AI dashboarding on top of live connected data.
Coefficient
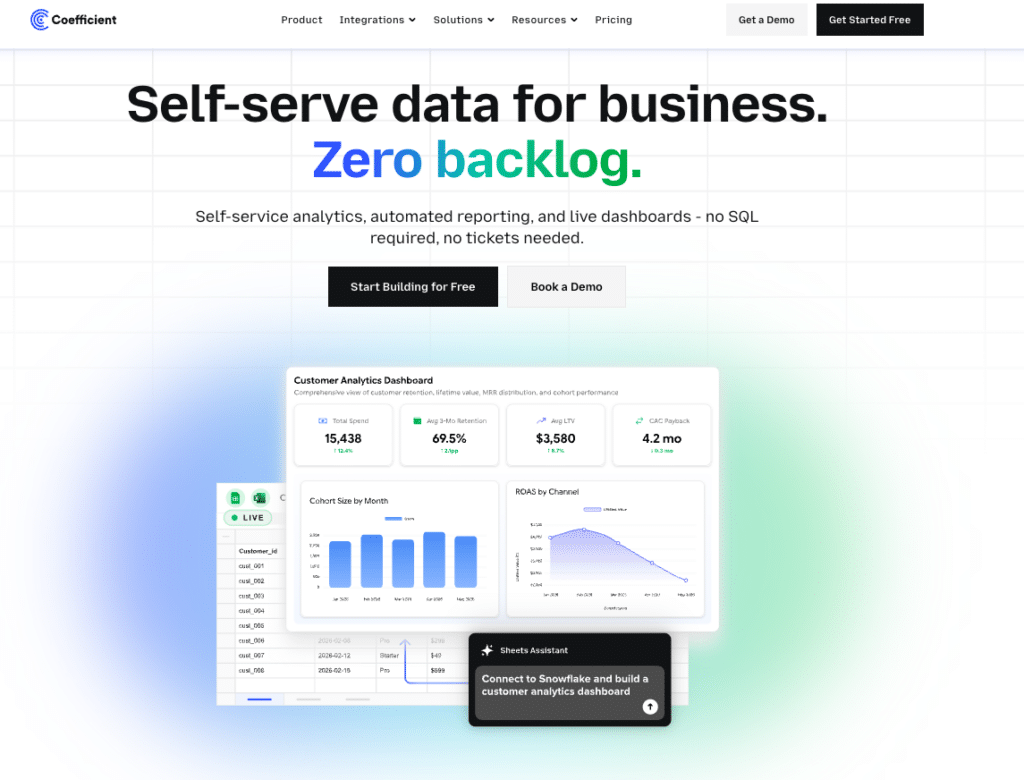
Coefficient connects 150+ data sources directly to Google Sheets or Excel, including Salesforce, HubSpot, QuickBooks, NetSuite and Snowflake, and keeps the data live with a scheduled server-side refresh. No CSV exports, no copy-paste, no stale numbers by the time the report is done.
For small businesses, the pricing model is a particular advantage. The free plan covers the basics. Paid plans start at $49 per month with no per-user fees. A business with 20 people who need to view dashboards pays the same $49 per month as one with two viewers. That structure is rare in BI and it removes one of the most common hidden costs for growing teams.
The AI features work at two levels. Sheets Assistant builds formulas, pivot tables, charts and dashboards directly inside Google Sheets from plain-English descriptions, understanding the actual columns and context of your spreadsheet. On the distribution side, describing a dashboard in plain English produces a shareable web dashboard backed by SQL queries, with every number traceable to its source. Viewers get a live URL and an Ask-AI sidebar to keep exploring the data without needing spreadsheet access. Server-side refresh means the dashboard is current every morning without anyone touching it.
“Coefficient automated everything. Instead of manually exporting or importing into Google Sheets every day, and making sure none of the formulas broke, I can just sit back and watch the data update automatically.” Christian Budnik, FP&A Analyst, Solv
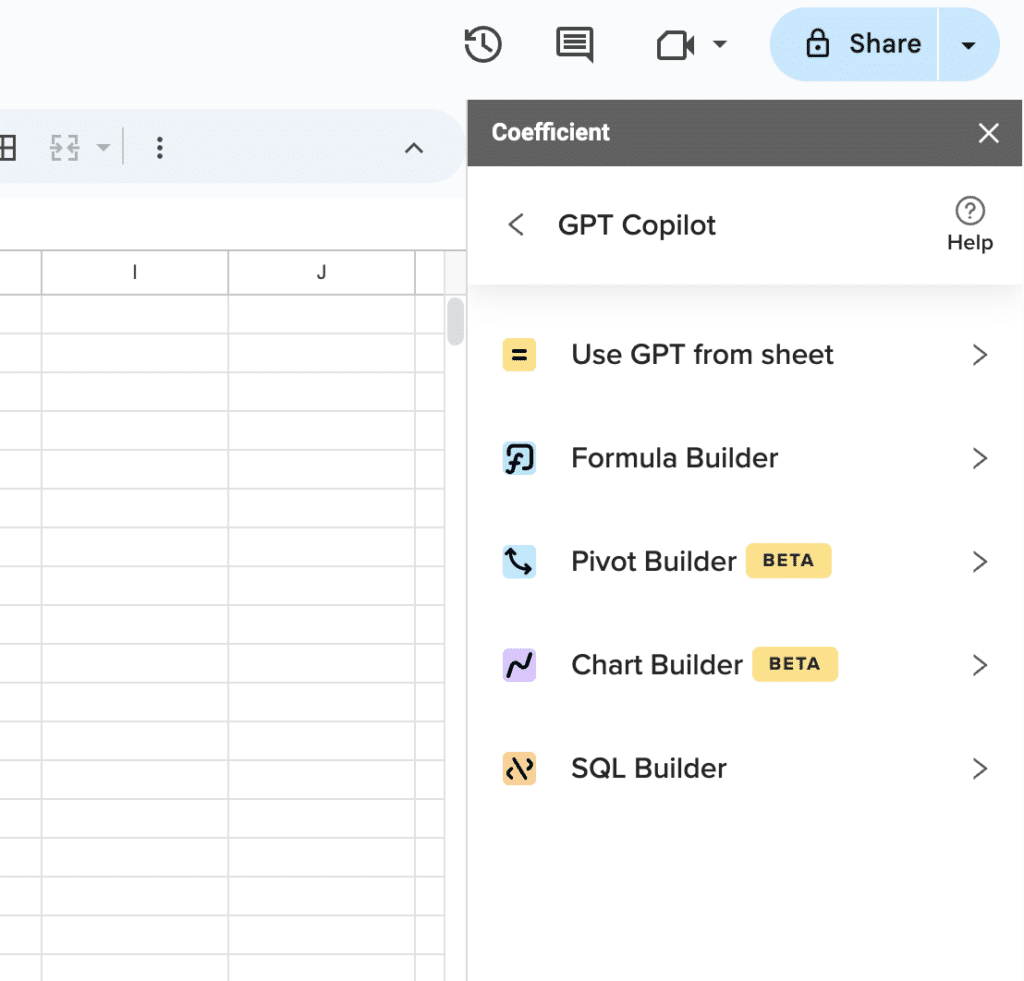
Supercharge your spreadsheets with GPT-powered AI tools for building formulas, charts, pivots, SQL and more. Simple prompts for automatic generation.

Limitation: requires Google Sheets or Excel as the data layer. Not a standalone BI platform. For small businesses already working in spreadsheets, that constraint is rarely a problem. For teams that want a fully standalone dashboard tool with no spreadsheet dependency, one of the other options in this list is a better fit.
Open Source and Self-Hosted Options
If you have someone on the team who can handle deployment and basic maintenance, open source BI tools offer enterprise-grade capability at zero licensing cost. The trade-off is setup time and ongoing maintenance, which requires at least one person with technical comfort.
Metabase
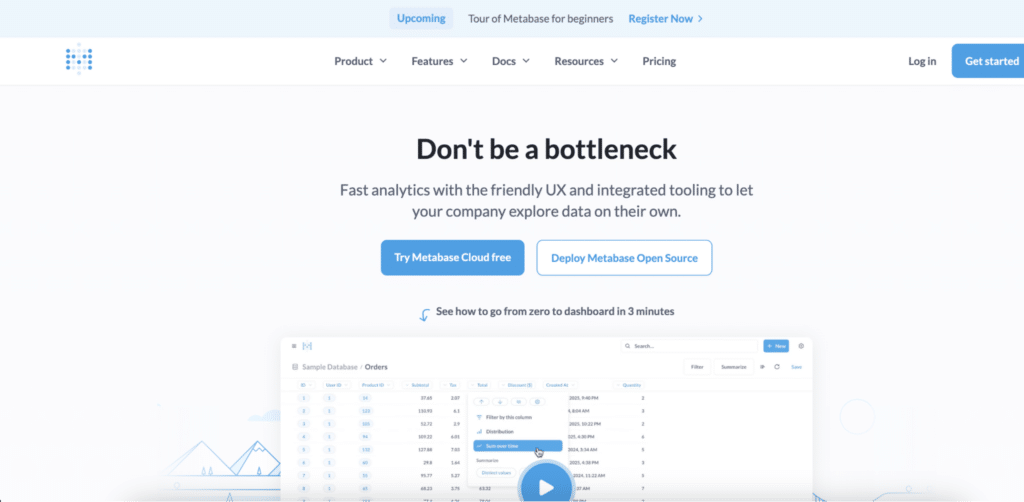
Metabase is the most widely adopted open source BI tool for non-technical users. Self-hosted deployment is free and the cloud-hosted version starts at $85 per month. It connects to most common databases and data warehouses, and the question builder lets non-technical users explore data without writing SQL. Metabase powers dashboards at over 60,000 organizations and is the most common migration target from Looker Studio when teams need row-level security or more advanced self-serve capability. The main consideration is the deployment and maintenance burden: someone needs to manage the tool and troubleshoot issues. For a team with one technically capable person, that is manageable. For a team with no technical resources at all, the easier-to-start tools above are a better fit.
For teams weighing Metabase against Looker Studio: Looker Studio covers around 90% of small business reporting needs at zero recurring cost. Metabase is worth the maintenance overhead only if you specifically need row-level security, more granular user permissions or a self-hosted deployment for data governance reasons.
Comparison Table
| Tool | Best For | Free Plan | Viewer Cost | Setup Time | Starts At |
|---|---|---|---|---|---|
| Looker Studio | Google ecosystem, quick dashboards at zero cost | Yes, fully free | Free, unlimited viewers | Hours | Free |
| Zoho Analytics | Small teams needing full-featured BI affordably | Free trial | Included in plan | Days | $30/month |
| Power BI | Microsoft 365 organizations | Desktop only (no sharing) | $14/user/month (every viewer) | Days to weeks | $14/user/month (Pro) |
| Coefficient | Teams in Sheets or Excel needing live multi-source data and AI dashboards | Yes | Free, unlimited viewers | Minutes to hours | Free plan. Paid from $49/month. No per-user fees. |
| Metabase | Teams with a technical resource wanting self-hosted BI | Yes (self-hosted) | Free on open source | Days to weeks | Free (self-hosted). $85/month (cloud). |
How to Pick the Right Tool for Your Business
Start by calculating the total cost for the scenario you actually need, not the scenario in the pricing page example. That means: how many people build reports, how many people view them, and how many data sources you need to connect.
Your data is primarily in Google tools: GA4, Ads, Sheets or BigQuery
Start with Looker Studio. It is free, the native connectors work well and you will have a dashboard running within a day. Move to a paid tool only when you hit a specific limitation: row-level security, alerting or data blending across many non-Google sources.
You are already paying for Microsoft 365
Check whether Power BI Pro is included in your existing license before evaluating anything else. If it is, your BI tool is already paid for. If it is not, calculate the total viewer cost before committing.
Your data is spread across a CRM, an accounting tool and other business systems
Coefficient is the most direct answer for teams already working in Google Sheets or Excel. Connect your sources once, set the refresh schedule, describe your dashboard in plain English and share the URL. The free plan covers getting started and paid plans run $49 per month with no per-viewer fees. Start free.
You want affordable full-featured BI without Google or Microsoft dependency
Zoho Analytics is the most accessible option at $30 per month. If your business already uses other Zoho products, the value compounds. If you have a technical resource available and want zero licensing cost, Metabase is worth the setup investment.
The best BI tool for a small business is the one that actually gets used. A tool that requires a data engineering team to configure, charges per viewer or takes months to deliver value is not a small business tool regardless of what the marketing page says. Start with the simplest option that covers your actual data sources, verify the total cost including all viewers, and expand from there.
If the bottleneck is manual data pulls across multiple systems, Coefficient is free to start and connects to your first data source in minutes.