Most teams underestimate the implementation burden of embedded BI. The gap between the demo and the production deployment is where projects fall apart.
Traditional BI tools were not designed to be embedded. They were adapted to it. The result is often brittle iFrame integrations, per-user licensing models that make customer-facing analytics economically unviable at scale, and engineering delays that slip product roadmaps by months.
Six criteria matter most, and most buyers do not assess them until they are already mid-implementation:
- Embedding method: Native SDK integration versus iFrame. Native feels part of your product. iFrame looks bolted on and limits interactivity.
- Pricing model: Per-user licensing versus tenant-based. Per-user costs compound as your customer base grows. Tenant-based pricing scales predictably.
- White-labeling depth: Can you fully remove the vendor’s visual footprint, or does the tool always look like itself?
- Data source compatibility: Does it connect to your specific database or warehouse out of the box?
- Multi-tenancy support: For SaaS products, can you isolate data by customer without building custom access controls from scratch?
- Engineering time to first dashboard: Some tools ship in days. Others take months to get right.
This list covers two distinct use cases: product teams embedding analytics into customer-facing applications, and business teams publishing live dashboards internally. Both are embedded BI. They need different tools.
Embedded BI Tools Compared: Quick Reference
| Tool | Best For | Embedding Method | Requires Engineering | Starting Price |
| Coefficient | Internal dashboards, no dev | One-click URL publish | No | From $49/month |
| Power BI Embedded | Microsoft-stack product teams | iFrame + SDK | Yes | From ~$735/month (A1 SKU) |
| Looker | Governed metrics, SaaS products | SDK + iFrame | Yes | Custom, $30k+ /year |
| Qlik | Enterprise apps, complex data | iFrame + mashup API | Yes | Custom, $30k+ /year |
| Tableau | Salesforce ecosystem products | Embedding API + iFrame | Yes | $15/user/month (Viewer) |
| Sigma Computing | Warehouse-native embedded analytics | SDK + iFrame | Yes | Custom, ~$60k/year |
| Metabase | Developer teams, open source | iFrame + SDK (Pro) | Yes | Free (OSS) / $500/month (Cloud) |
At a glance:
- Coefficient: Best for business teams embedding live dashboards without engineering
- Microsoft Power BI Embedded: Best for Microsoft-stack product teams
- Looker: Best for embedding governed metrics into applications
- Qlik: Best for enterprise applications with complex data relationships
- Tableau Embedded Analytics: Best for Salesforce ecosystem product teams
- Sigma Computing: Best for embedded analytics on top of cloud data warehouses
- Metabase: Best for developer teams wanting open-source embedded BI
Coefficient
Best for: Business teams embedding live dashboards without engineering
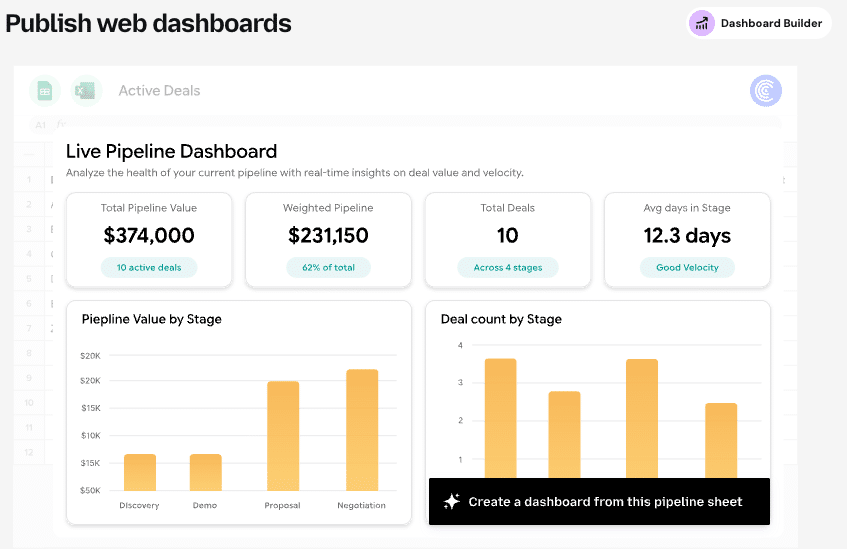
Coefficient is the only tool on this list that does not require a developer. For business, GTM and finance teams that need to publish live, BI-quality dashboards to stakeholders, Coefficient’s one-click web dashboard powered by AI turns any Excel or Google Sheets model into a shareable, auto-updating web view.
No SDK. No iFrame configuration. No engineering ticket. The team that built the analysis in the spreadsheet is the same team that publishes it to stakeholders via a URL. Leadership, cross-functional partners, and clients all see the same live numbers without needing spreadsheet access or a BI tool license.
The data feeding those dashboards comes from the same live spreadsheets Coefficient manages: QuickBooks, NetSuite, Salesforce, HubSpot, Snowflake, Google Analytics, and 100+ more. Every time the scheduled refresh runs, the published dashboard updates automatically.
Scope clarification: Coefficient is not a product-embedded BI tool for SaaS companies building customer-facing analytics with custom branding and multi-tenant data isolation. It is the embedded BI option for internal business teams that need live dashboards without a BI tool, a data team, or a developer. If you are a product team building customer-facing embedded analytics, look further down this list.
Pricing: Starts at $49/month. No per-user or per-viewer fees for published dashboards.
Pros:
- No engineering required, any spreadsheet model becomes a live dashboard
- Dashboards auto-update on scheduled refresh
- Works inside Excel and Google Sheets, no migration
- Flat pricing, no per-viewer licensing
Cons:
- Not suitable for customer-facing product analytics with multi-tenancy requirements
- No SDK or API for custom embedding into external applications
Microsoft Power BI Embedded
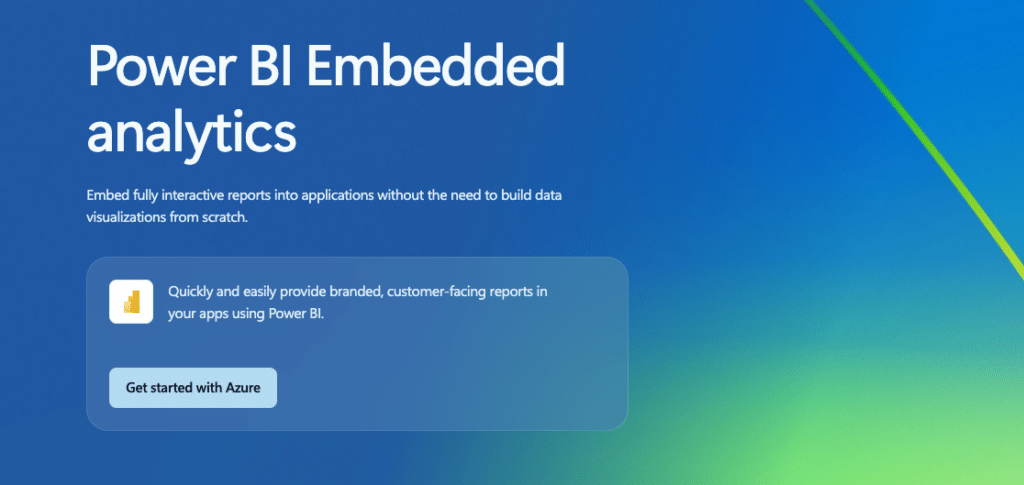
Best for: Microsoft-stack product teams
Power BI Embedded separates the analytics experience from per-user licensing, making it viable for external-facing analytics at scale. Instead of charging per viewer, it uses capacity-based pricing (Azure SKUs), which can make the economics work for SaaS products with large customer bases.
For product teams already deep in the Microsoft stack, the integration with Azure Active Directory, Teams, and Dynamics is a genuine advantage. Report customization within the Power BI framework is accessible, and the connector library is broad.
Limitations: Power BI Embedded’s licensing tiers (A-SKUs, EM-SKUs, P-SKUs) are genuinely confusing. Selecting the right SKU for your workload requires careful planning, and getting it wrong means either overpaying or hitting capacity limits. The embedded experience is tightly coupled to Azure, and customizing beyond Power BI’s default UI requires meaningful development effort.
Pricing: A1 SKU starts at approximately $735/month. Scales significantly for higher capacity tiers. Developer testing available via the Power BI Embedded Playground.
Pros:
- Capacity-based pricing scales better than per-user for external analytics
- Deep Microsoft ecosystem integration
- Broad connector library
Cons:
- Complex licensing tier structure (A, EM, P SKUs)
- Azure dependency for full functionality
- Heavy development lift to customize beyond default Power BI UI
Looker
Best for: Embedding governed metrics into applications
Looker’s LookML semantic layer is what makes it compelling for embedded use cases at scale. Business logic, metric definitions, and data relationships are defined once in LookML and then reused across every embedded surface. Teams building analytics into multiple product areas or across multiple customer-facing contexts benefit significantly from this centralized approach.
Google Cloud integration positions Looker well for GCP-native teams. The Looker Embedded SDK gives developers flexibility in how dashboards are presented, and row-level security for multi-tenant data isolation is built into the framework.
Limitations: LookML requires dedicated engineering investment to build and maintain. Looker is not a fast-to-market option. Most teams report taking two to six months to reach a production-ready embedded implementation. Licensing for embedded use cases is expensive, and the learning curve for LookML extends beyond typical BI tooling.
Pricing: Custom quote only. Typical contracts range from $30,000 to $150,000+ per year. Embedded use cases are separately priced.
Pros:
- LookML semantic layer prevents metric inconsistency across embedded surfaces
- Strong governance and row-level security for multi-tenant SaaS
- Google Cloud integration for GCP-native teams
Cons:
- Requires dedicated engineering to build and maintain LookML
- Not fast to market, 2 to 6 months to production typically
- Expensive for embedded use cases
Qlik
Best for: Enterprise applications with complex data relationships
Qlik’s associative data engine is genuinely differentiated for use cases involving complex, multi-table data relationships. Where other BI tools show you only what matches a filter, Qlik’s engine shows you what matches and what does not, which supports a style of exploratory analysis that is hard to replicate elsewhere.
For enterprise applications where users need to explore relationships across many dimensions of data simultaneously, Qlik has real capability. Its governance features and security controls meet enterprise requirements.
Limitations: Qlik was built for internal BI, not for embedding. The embedding experience relies on iFrames and mashup APIs that create fragile integrations and limit customization depth. White-labeling is constrained: Qlik’s visual fingerprint tends to show through in embedded contexts. For product teams building customer-facing analytics that should feel native to their application, Qlik creates friction that more embedding-native tools do not.
Pricing: Custom quote only. Typical enterprise contracts range from $30,000 to $100,000+ per year.
Pros:
- Associative engine enables powerful multi-dimensional data exploration
- Strong enterprise governance and security
- Well-suited for internal analytics with complex relationships
Cons:
- Embedding via iFrame and mashup APIs creates fragile integrations
- Limited white-labeling depth for customer-facing products
- Not designed natively for embedded use cases
Tableau Embedded Analytics
Best for: Salesforce ecosystem product teams
Tableau’s visualization quality translates well into embedded contexts. The Embedding API v3 and JavaScript API give developers meaningful control over how dashboards are presented, and the output looks polished. For product teams where visual quality and interactivity are primary requirements, Tableau delivers.
The Salesforce connection is a specific advantage for products built within or adjacent to the Salesforce ecosystem. Einstein Copilot integration adds AI-powered analytics for Salesforce-native teams.

Stop exporting data manually. Sync data from your business systems into Google Sheets or Excel with Coefficient and set it on a refresh schedule.
Get Started
Limitations: Per-user licensing for external viewers adds up fast at scale. Tableau Viewer licenses for customer-facing analytics are $15/user/month, which can become a significant cost line as your customer base grows. Truly native embedding, where the analytics feel part of your product rather than an iFrame inset, still requires meaningful development effort.
Pricing: Viewer at $15/user/month. Explorer at $42/user/month. Creator at $70/user/month. Embedded deployments may use different SKUs depending on use case.
Pros:
- High-quality visualization output in embedded contexts
- Embedding API v3 gives developers flexibility
- Strong fit for Salesforce ecosystem products
Cons:
- Per-viewer licensing compounds at scale
- Native embedding still requires significant development effort
Sigma Computing
Best for: Embedded analytics on top of cloud data warehouses
Sigma does not appear on most embedded BI lists, which is an oversight worth correcting. Its spreadsheet-like interface on top of Snowflake, BigQuery, Databricks, and Redshift makes it genuinely accessible to non-technical users while still maintaining warehouse-native performance.
For product teams and internal analytics teams that need to embed live warehouse data in an interface business users can actually navigate, Sigma’s approach reduces the friction between the data layer and the end user. White-labeling support is solid, and the embedding model is cleaner than legacy tools adapted from internal BI.
Limitations: Sigma requires a cloud data warehouse as its data foundation. It is not a self-contained analytics tool. Teams without existing warehouse infrastructure need to build that layer first, which adds to the total implementation cost and timeline. Sigma’s pricing is also not transparent: Vendr data suggests median contracts around $60,500 per year.
Pricing: Custom quote only. Vendr data suggests median contract around $60,500/year.
Pros:
- Spreadsheet-like interface makes warehouse data accessible to non-technical users
- Clean embedding model with solid white-labeling
- Warehouse-native performance for large datasets
Cons:
- Requires cloud data warehouse as foundation
- Opaque pricing, typically expensive
Metabase
Best for: Developer teams wanting open-source embedded BI
Metabase is the most accessible entry point for embedded BI on this list. The open-source version can be self-hosted, deployed against your existing database, and embedded into an application in a fraction of the time most enterprise tools require. For developer teams that need to ship embedded analytics quickly without enterprise pricing or vendor lock-in, Metabase is a credible choice.
The open-source community is active, documentation is thorough, and the question-and-answer interface for non-technical users is genuinely intuitive. Metabase Pro and Metabase Cloud add SSO, advanced permissions, and embedding features beyond what the open-source version supports.
Limitations: The open-source version requires engineering ownership for self-hosting, upgrades, and infrastructure management. Metabase Cloud addresses the hosting burden but limits customization depth. Multi-tenancy data isolation at scale is where Metabase shows its constraints: building robust customer-level data separation requires custom work that more enterprise-oriented tools handle natively.
Pricing: Open source (free, self-hosted). Metabase Cloud from $500/month. Pro plans from $500/month.
Pros:
- Open source with a strong developer community
- Fast to ship for teams with existing databases
- Affordable compared to enterprise alternatives
Cons:
- Self-hosted version requires engineering ownership
- Multi-tenancy data isolation requires custom work at scale
- Limited white-labeling depth compared to enterprise tools
How to Choose the Right Embedded BI Tool
The decision splits cleanly across two dimensions: use case and team type.
Internal dashboards, business team, no developer: Coefficient (Try for free). Nothing else on this list lets a non-technical team publish live, auto-updating dashboards without engineering involvement.
Customer-facing analytics, SaaS product, engineering resources, GCP or general warehouse: Looker for governed metrics at scale. Sigma for warehouse-native accessibility. Metabase for speed and cost efficiency.
Microsoft ecosystem, customer-facing or internal: Power BI Embedded. The capacity pricing model and Azure integration make it the natural choice.
Salesforce ecosystem product: Tableau Embedded Analytics, particularly if the Einstein integration is relevant to your roadmap.
Enterprise application, complex multi-dimensional data: Qlik, with the clear understanding that embedding is not its native strength.
Developer team, open source, speed and cost the priority: Metabase. Ship faster, pay less, own the infrastructure.


