Table of Contents
![]()
- 1. Better Salesforce Opportunity Stages, Better Forecast: Here’s How
- 2. How to create a report in Salesforce?
- 3. A Guide to Custom Report Types in Salesforce
- 4. How to Create a Matrix Report in Salesforce
- 5. Joined Reports in Salesforce: Step-by-Step Tutorial
- 6. How to export opportunities from Salesforce
- 7. How to Build a Stage Report in Salesforce: A Step-by-Step Guide
- 8. How to Build a Salesforce Summary Report
- 9. How to Workaround Salesforce Report Limitations?
- 10. How to Clone a Report in Salesforce (And How to Never Do it Again)
- 11. How to Pull a Report in Salesforce
- 12. How to Share a Report in Salesforce
- 13. The Easy Way to Do Salesforce Field History Tracking
- 14. The Easy Way to Solve Salesforce Opportunity Management Problems

Salesforce reporting is a pivotal tool for extracting valuable insights from your data. Among these, “Stage Reports” are essential for effective sales pipeline management, offering dynamic views of opportunities through different stages.
This guide provides a clear, step-by-step process to create a Stage Report in Salesforce, equipping sales professionals and administrators with actionable data insights.
Understanding Stage Reports
A Stage Report in Salesforce refers to a visual representation that tracks the progress of a specific process or project through various stages. It provides a snapshot of where each opportunity, deal, or project stands in its lifecycle.
- Importance in Sales: In sales, Stage Reports are pivotal for monitoring the sales pipeline. Each stage represents a key phase in the sales process, from initial contact to closing a deal. Sales teams use these reports to identify bottlenecks, prioritize leads, and forecast revenue.
- Importance in Project Management: In project management, Stage Reports are instrumental in tracking the evolution of tasks and milestones. Projects often pass through distinct phases, and these reports provide a visual overview of progress. Project managers utilize them to assess timelines, identify potential delays, and allocate resources appropriately.
Preparing to Build Your Report
While preparing to build your stage report, you need some data and necessary permissions to prepare the report on Salesforce. Here are the required prerequisites to prepare your stage report
1. Ensure Necessary Salesforce Permissions
- Permissions Check: Confirm that you have the necessary permissions to create and run reports in Salesforce. Check your user profile settings or consult your Salesforce administrator to grant the required access.
- Data Access Permissions: Ensure that your Salesforce profile allows access to the specific objects and fields needed for the report. Adjust field-level security and object permissions as necessary.
2. Overview of Data Needed for a Stage Report
- Identify Relevant Objects: Determine which Salesforce objects are essential for your Stage Report. In sales, this often involves Opportunities; in project management, it might be Tasks or Projects.
- Select Key Fields: Identify the key fields that represent different stages in your process. For sales, these could include Stage, Amount, Close Date, etc. In project management, it might be Task Status, Start Date, Due Date, etc.
- Data Quality Check: Ensure that the data in the selected fields is accurate and up-to-date. Clean up any discrepancies or outdated information to ensure the reliability of your report.
- Consider Filters: Think about any specific criteria or filters you want to apply to your report. This could include time frames, specific team members, or other relevant parameters based on your reporting needs.
Step-by-Step Guide: Creating a Stage Report in Salesforce
Creating a stage report is crucial for effective collaboration and tracking the progress of a specific process or project through various stages. Follow this detailed walkthrough to seamlessly create a stage report for your project on Salesforce.
Step 1: Access the Report Module in Salesforce
- Log in to your Salesforce account and navigate to the “App Launcher.”
- Select the “Reports” app to access the Salesforce Report Module.
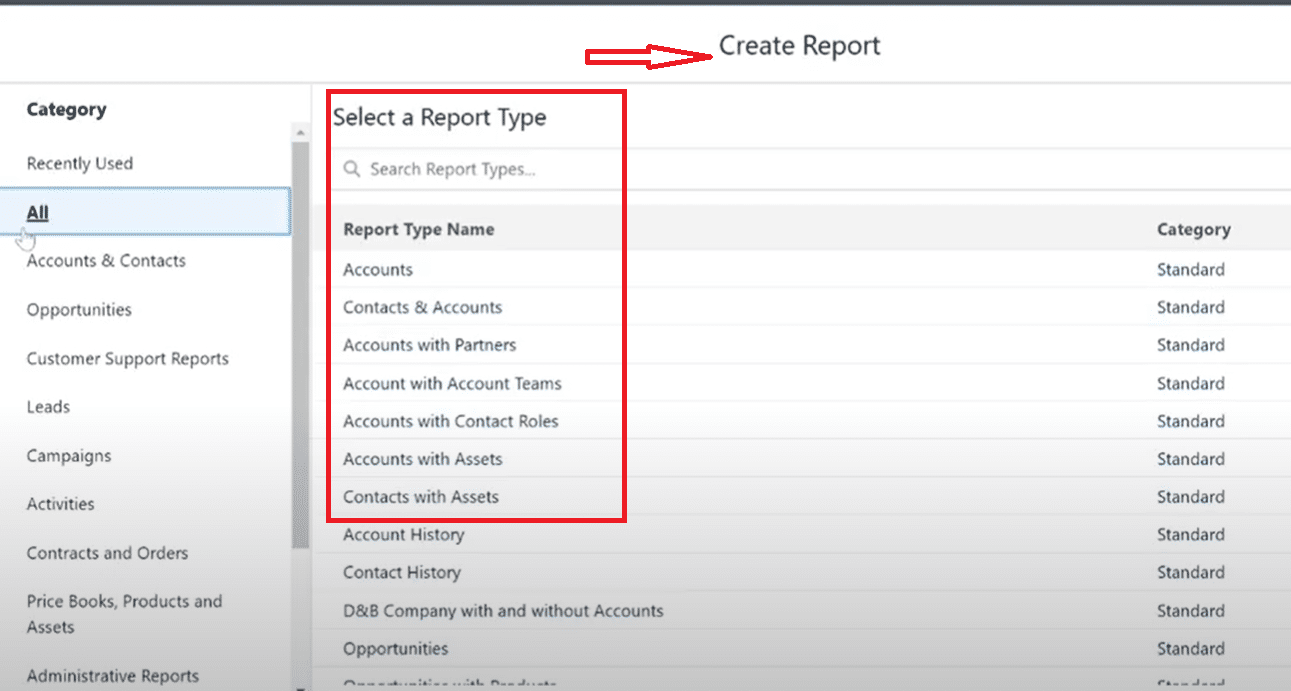
Step 2: Select the Right Report Type
- Click on the “Create Report” button and choose the appropriate report type.
- For a Stage Report, select the report type that aligns with your data structure, such as “Opportunities” or “Projects.”
Step 3: Customizing Report Criteria
- Define the criteria for your Stage Report. Specify parameters such as date ranges, opportunity owners, or project statuses to tailor the report to your specific needs.
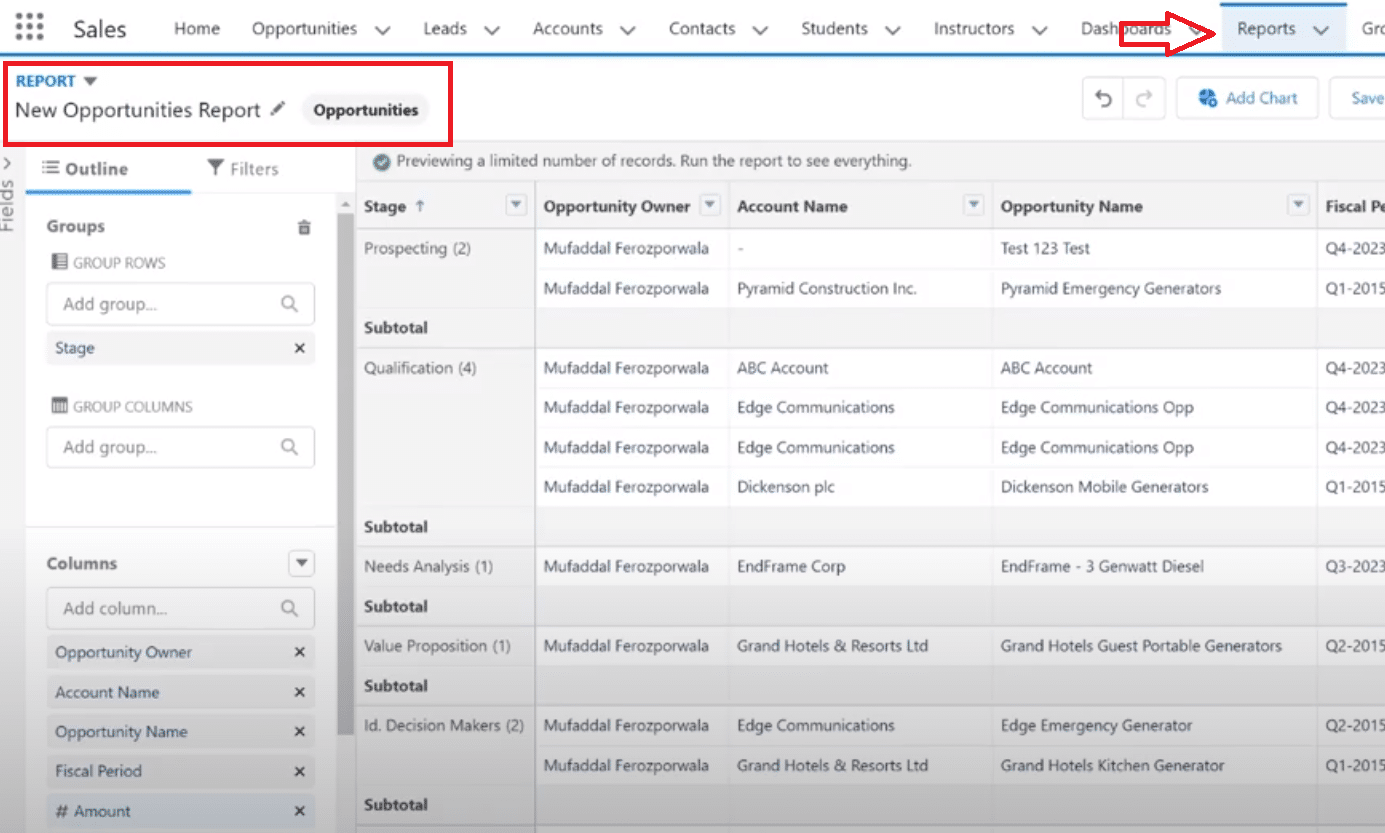
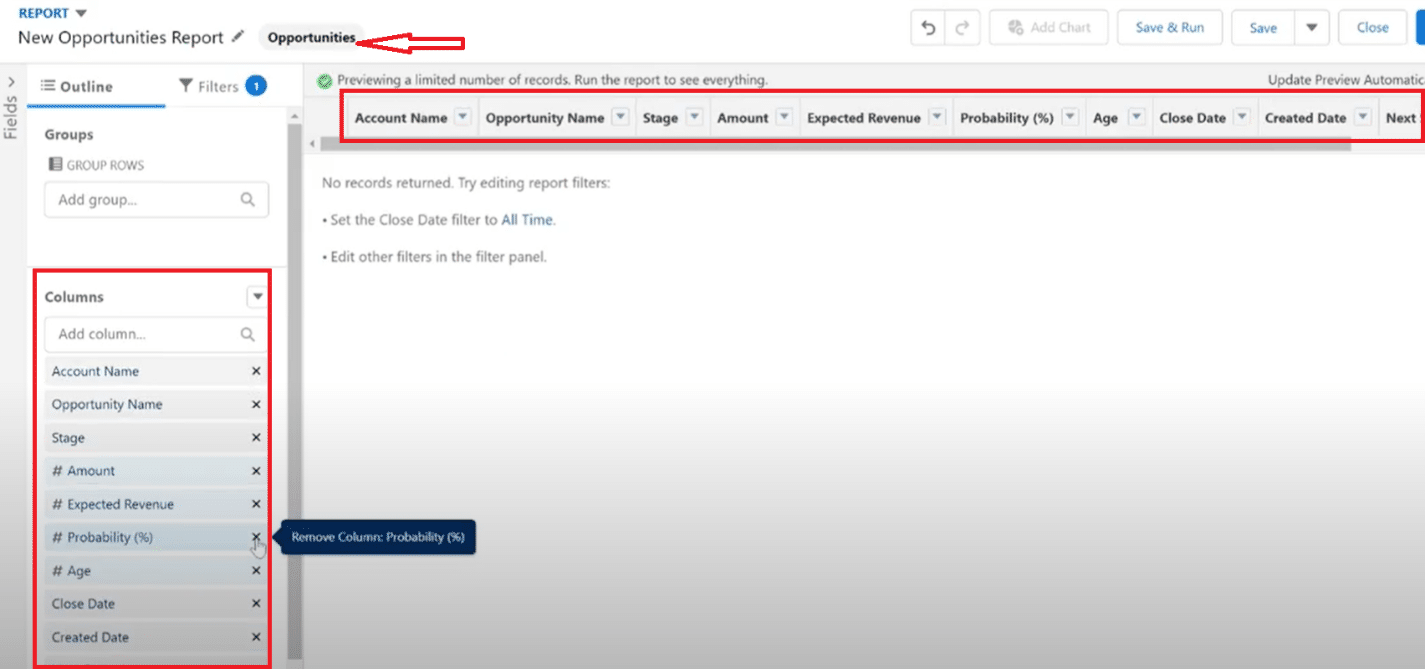
Step 4: Adding and Organizing Fields
- Add relevant fields to your report to capture key information.
- Organize these fields to present data logically.
- For a Stage Report, consider including fields like “Opportunity Name,” “Close Date,” or “Project Stage.”
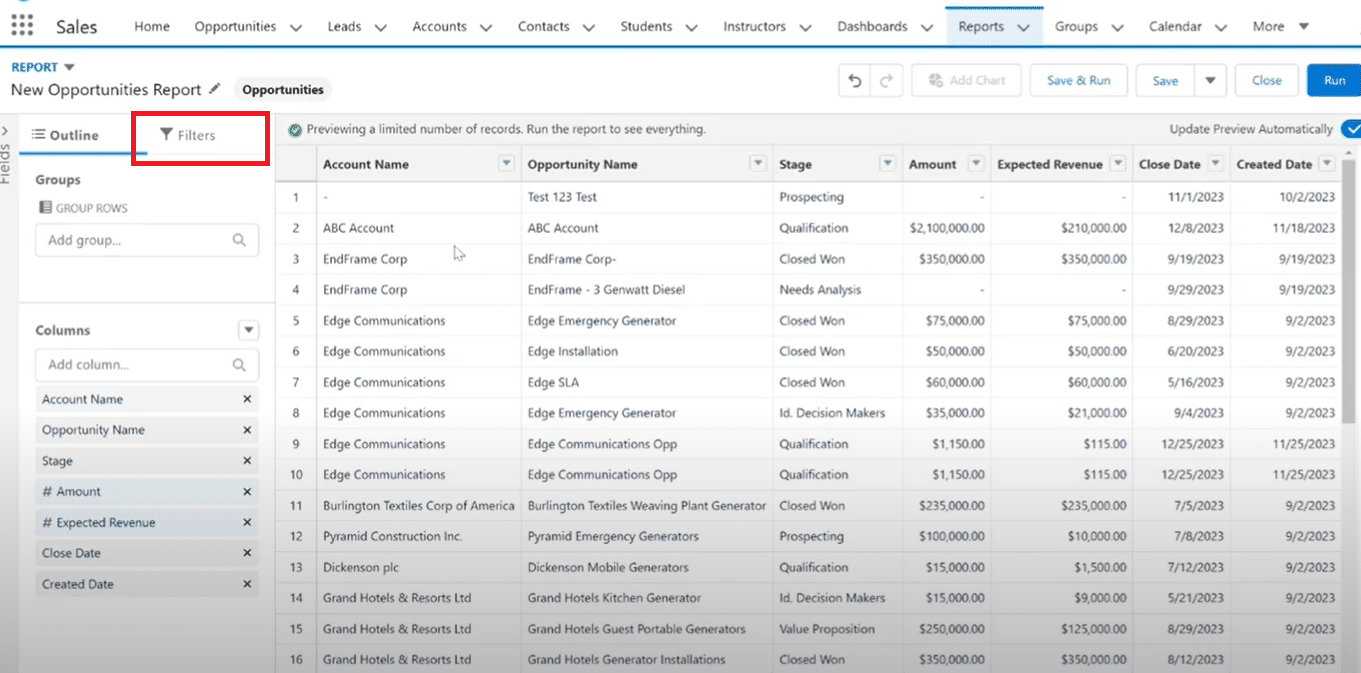
Step 5: Applying Filters for Accurate Data
- Refine your Stage Report by applying filters.
- Filters ensure that only relevant data is included in your report.
- For instance, filter opportunities or projects based on specific criteria such as “Closed-Won” or “In Progress.”
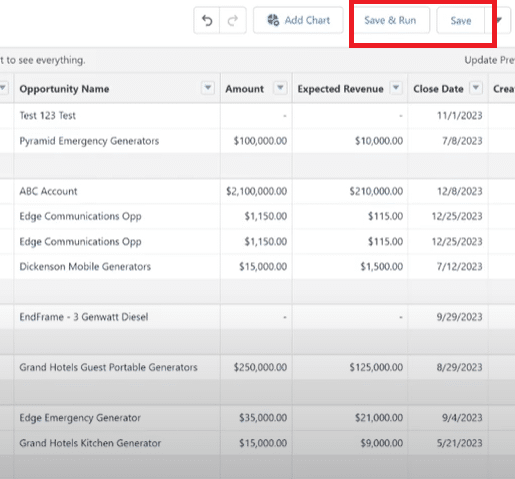
Step 6: Saving and Naming Your Report
- Once satisfied with your Stage Report settings, click on “Save” and provide a meaningful name for your report.
- Choose an appropriate folder for organization and future access.
Enhancing Your Report
To make your Stage Report in Salesforce more insightful and visually impactful, consider the following customization options:
- Customization Options: Select relevant fields, group data, and apply strategic filters.
- Adding Graphs and Charts: Integrate visual elements for a comprehensive overview.
- Dashboard Integration: Incorporate your report into a Salesforce dashboard for a holistic view.
- Dynamic Filters: Implement interactive filters for on-the-fly analysis.
Conclusion
Customize your Salesforce Stage Report to align with your organization’s unique needs. Leverage visual elements, strategic data grouping, and Salesforce’s reporting capabilities to maximize utility.
For an advanced data management experience, explore Coefficient. Enhance your Salesforce reporting with Get started with Coefficient and unlock the potential of sophisticated data analysis and management.