Navigate to Setup by clicking the gear icon and search for “Report Types” in the setup homepage
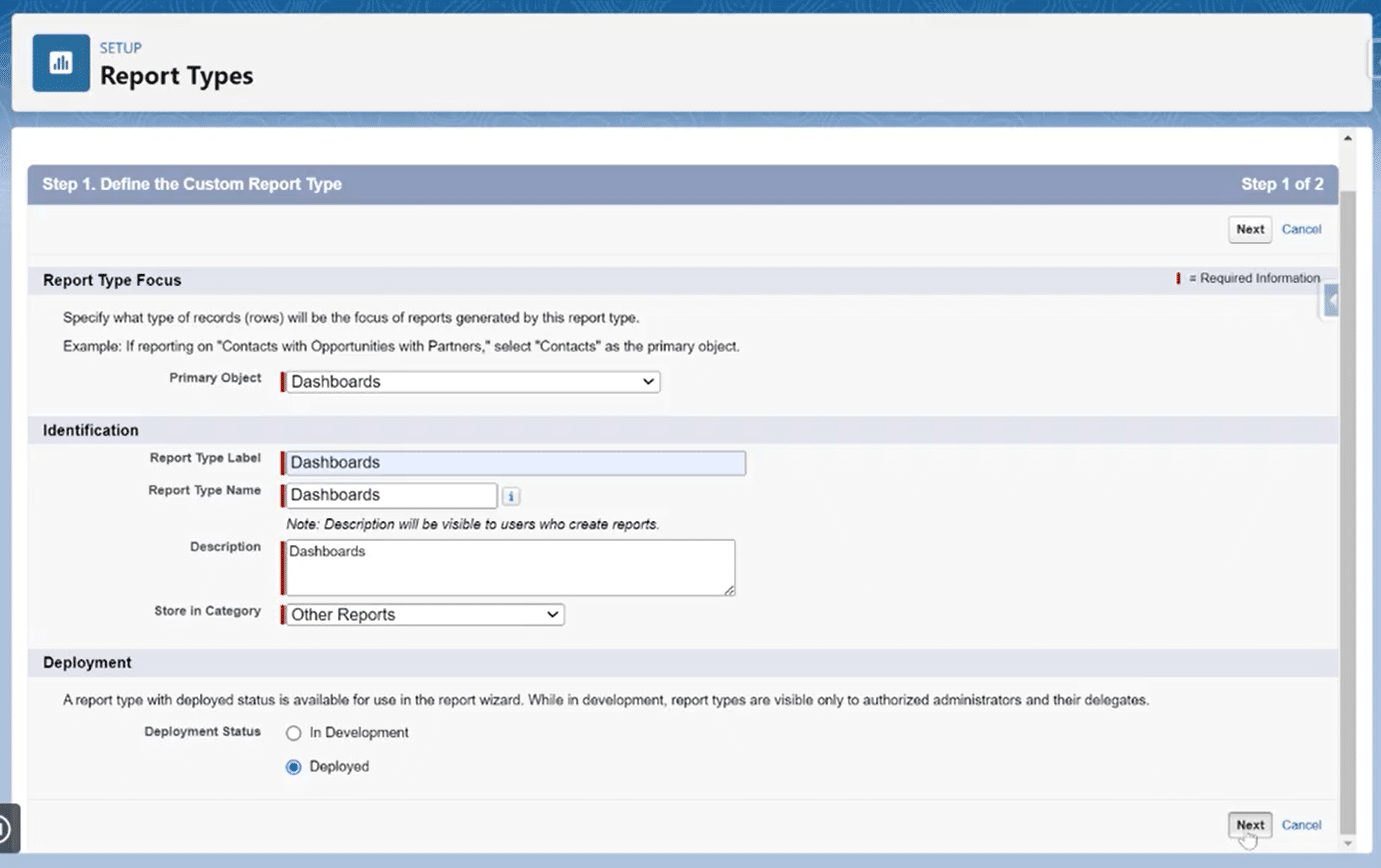
Click “New Custom Report Type” and select “Dashboards” as your primary object
Fill in labels and descriptions, select “Deployed” option, and click “Next” then “Save”
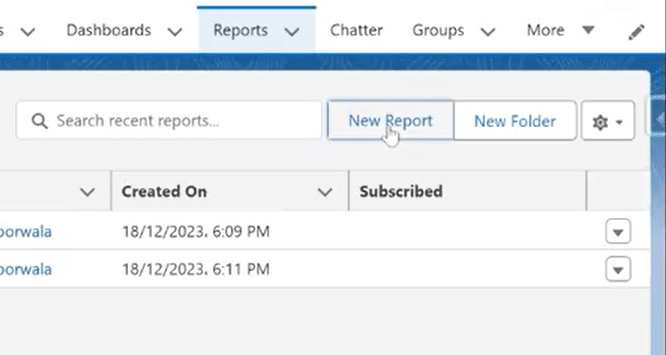
Go to the Reports tab on Salesforce home and click “New Reports” to create a new report
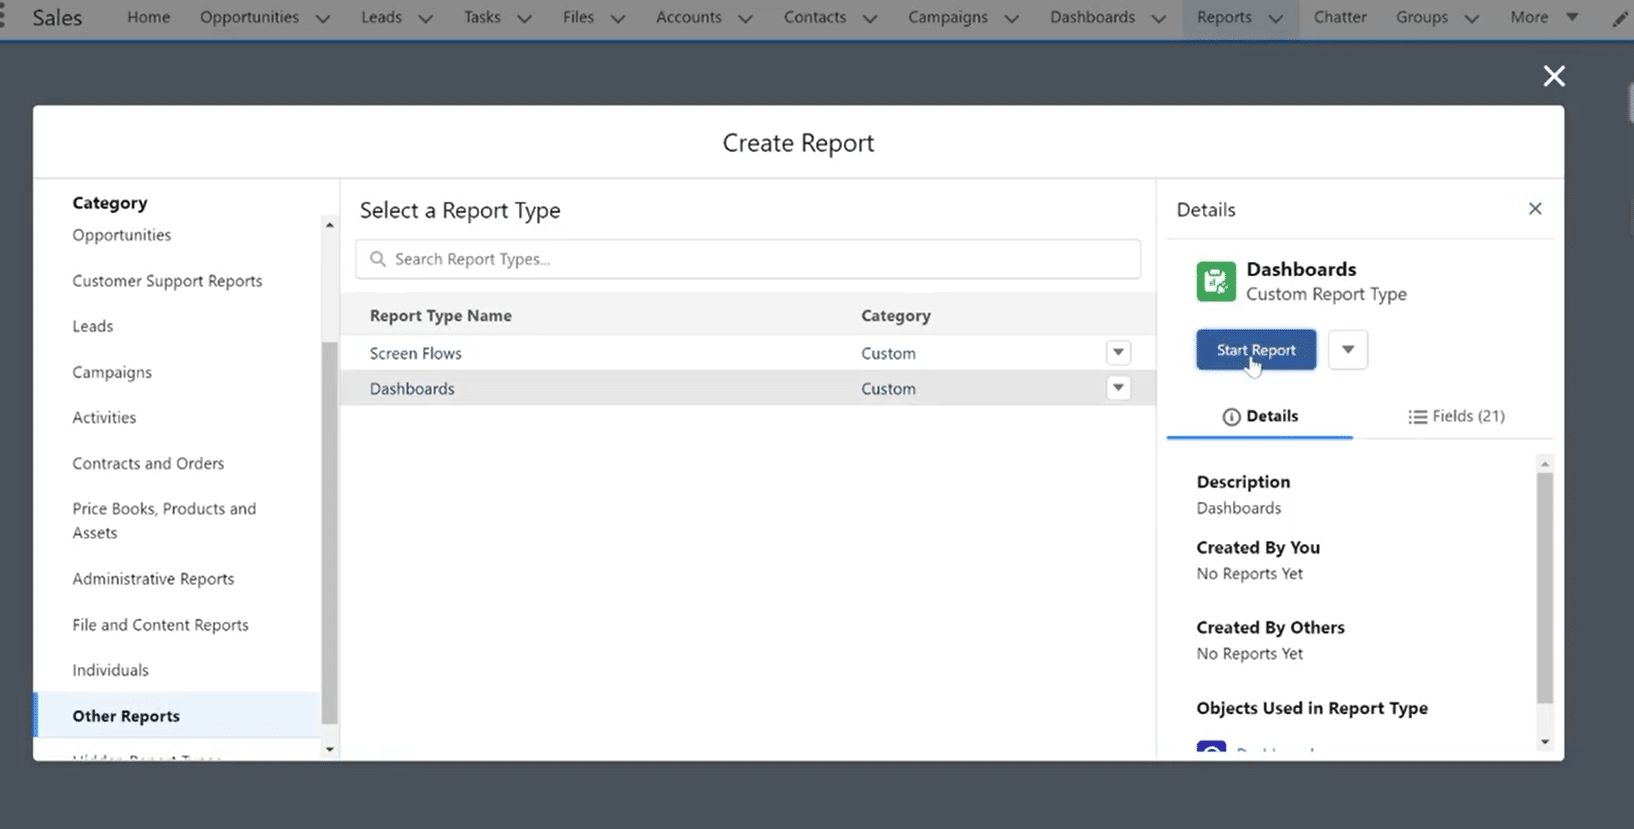
Select “Other Reports” category and choose your newly created “Dashboards” custom category
Click “Start Report” and then “All Dashboards” to see a comprehensive report of your dashboards
Add columns like “Title” and “Dashboard Running User” from the Fields tab for more detailed information
Apply filters for “Dashboard Running User” with values “Run as logged-in user” and “Let authorized users change running user” to isolate dynamic dashboards
Dynamic dashboards give Salesforce users personalized insights based on their roles and needs.
But do you know how many dynamic dashboards you have in your Salesforce org, and what your limits are?
In this article, you’ll find a step-by-step guide to discovering your Salesforce dynamic dashboards, troubleshooting some common issues with managing several at once, and tips on making the most of them. Additionally, we’ll explore how integrating with Coefficient can significantly streamline this process, making dashboard management more efficient and data-driven.
New to Salesforce Dynamic Dashboards? Start with How to Create a Salesforce Dynamic Dashboard with our ultimate guide!
Understanding Dynamic Dashboards in Salesforce
Salesforce dynamic dashboards respond to user interaction, providing an immersive and personalized experience.
Unlike their standard counterparts, dynamic dashboards empower users to take on various roles as they navigate through insights.
So, whether you’re a sales manager assessing team performance or a marketing strategist analyzing campaign metrics, dynamic dashboards adapt to your needs, offering a dynamic canvas for data exploration. Leveraging Coefficient’s seamless integration of live data between your spreadsheet and Salesforce can enhance this adaptability, ensuring your dashboards always reflect the most current data without manual intervention and provide the flexibility you need to build your most complex reports.
5 Benefits of Creating and Tracking Salesforce Dashboards
Here are some key benefits of both creating and tracking your dashboards:
Flexibility
One of the primary benefits of creating Salesforce dynamic dashboards is their flexibility. Users can customize the view, selecting the metrics and key performance indicators (KPIs) most relevant to their role or current objectives. This adaptability ensures the dashboard is a versatile tool for professionals across different departments.
With Coefficient, this flexibility extends beyond Salesforce, allowing for dynamic Salesforce data interaction within familiar spreadsheet environments.
Interactivity
Unlike traditional dashboards, dynamic dashboards invite user interaction. With the ability to drill down into specific data points, apply filters, and explore trends in real-time, users can actively engage with the information presented. This interactivity transforms data analysis into a collaborative and exploratory process. Coefficient amplifies this interactivity by enabling users to receive instant alerts and notifications via Slack or email for specified data changes, fostering a proactive approach to sales analysis.
Resource Optimization
A significant benefit of tracking Salesforce dashboards is optimizing all resources. By knowing the exact count of dynamic dashboards, administrators can better allocate dashboard creation efforts, ensuring that each dashboard serves a purpose and aligns with organizational goals. Coefficient further optimizes resource usage by automating data updates and synchronization, reducing the manual effort required to maintain up-to-date dashboards.
Performance Monitoring
Monitoring the number of dynamic dashboards facilitates performance analysis. Administrators can identify which dashboards are frequently accessed and which may require enhancements. This proactive approach ensures users have a seamless and responsive experience when interacting with dynamic dashboards.
Integrating Coefficient offers enhanced monitoring capabilities, with easy sharing of dashboard insights and performance metrics across teams via spreadsheets, no Salesforce license required.
Troubleshooting and Maintenance
If users encounter issues or errors, administrators can quickly identify and resolve them, maintaining a seamless user experience. Regular maintenance becomes more efficient, contributing to the overall health of the Salesforce environment.
By incorporating Coefficient, troubleshooting becomes even more streamlined, as it provides a clear data lineage that helps track where each piece of data originates, making it easier to pinpoint and resolve issues.
Step-by-Step Guide to Count Dynamic Dashboards
Now that we understand the significance of dynamic dashboards in Salesforce let’s break down the process of counting them within your Salesforce org for better management, and how Coefficient can simplify this process.
Creating a Salesforce report is the easiest way to have a numbered list of your dashboards. To enhance this, Coefficient’s integration between Salesforce and your spreadsheet allows for the direct import of this data into your preferred spreadsheet tool, enabling more flexible and powerful analysis.
As you dive into our written tutorial, feel free to reference our visual guide as well:
Step 1: Create a Custom Report Type
Before you create a report for dynamic dashboards, you must create a custom report type for ‘dashboards’ in your Salesforce list to work on while generating a report.
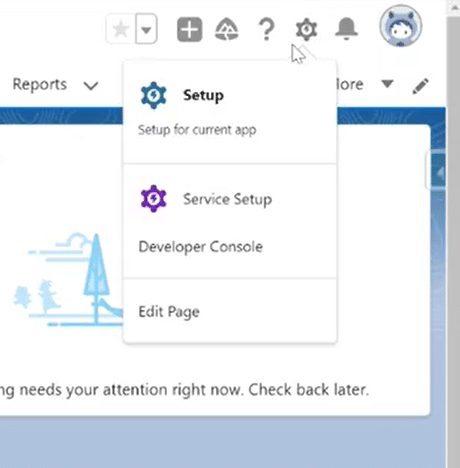
Start by navigating to ‘Setup’ and clicking on the Gear icon.
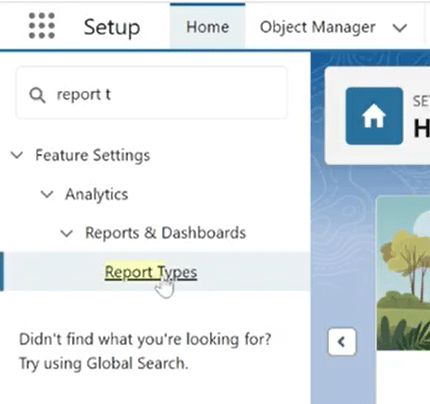
In the search bar on the setup homepage, search and click on ‘Report Types’
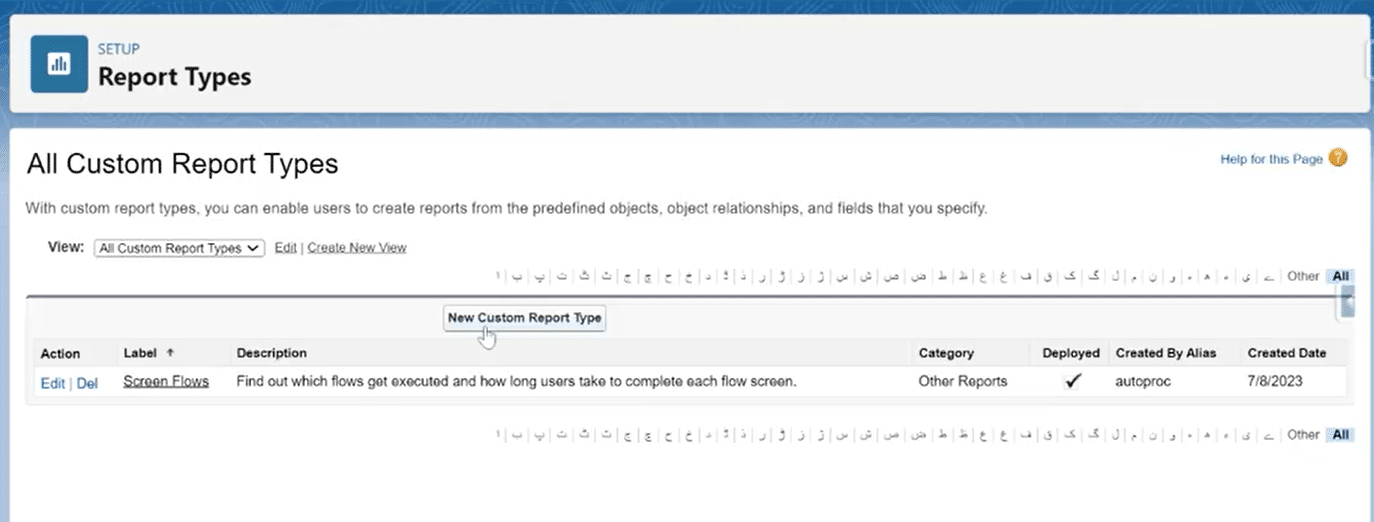
This option will redirect you to the Report Types page. Here, navigate to the button ‘New Custom Report Type’ and click on that option.
Select ‘Dashboards’ as your primary object in the new custom report types window. You can fill in the labels and descriptions as you see fit.
Select the option ‘Deployed’ and click on ‘Next.’
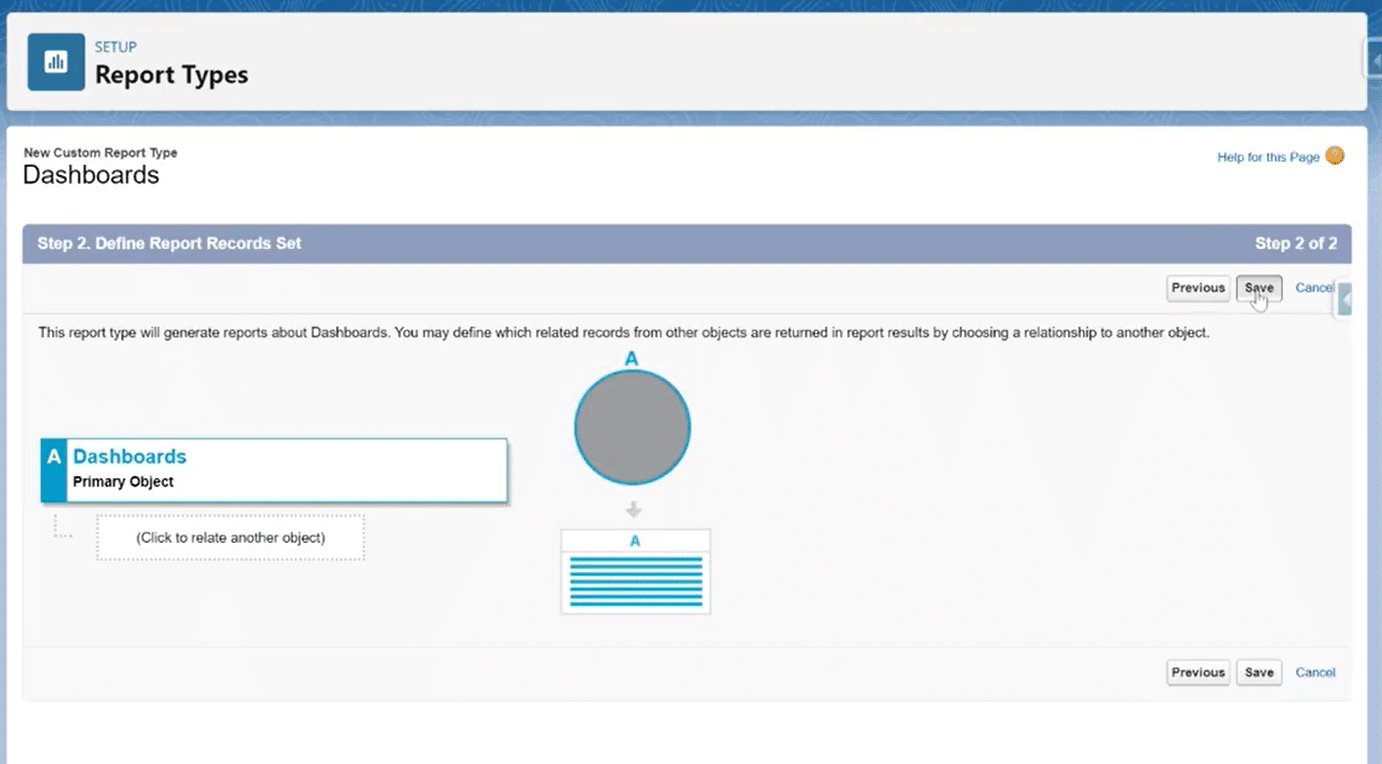
In the final step for creating a new custom report type, define your reports’ record sets. Here, you can relate the primary object (Dashboards) to any other standard or custom object.
Click on ‘Save’ when you’re done!
Step 2: Create a New Report
Once you create a new report type, navigate to Salesforce home and the ‘Reports’ tab.
After it loads, click ‘New Reports’ to create a report describing and numbering your Salesforce dynamic dashboards.
A pop-up window will open to create a new report.
In the category list, navigate to ‘Other Reports’ select your newly created ‘Dashboards’ custom category from the available list, and click on ‘Start Report’
A new report will be generated. Click on ‘All Dashboards’ to see a comprehensive report on the number of your dashboards and types.
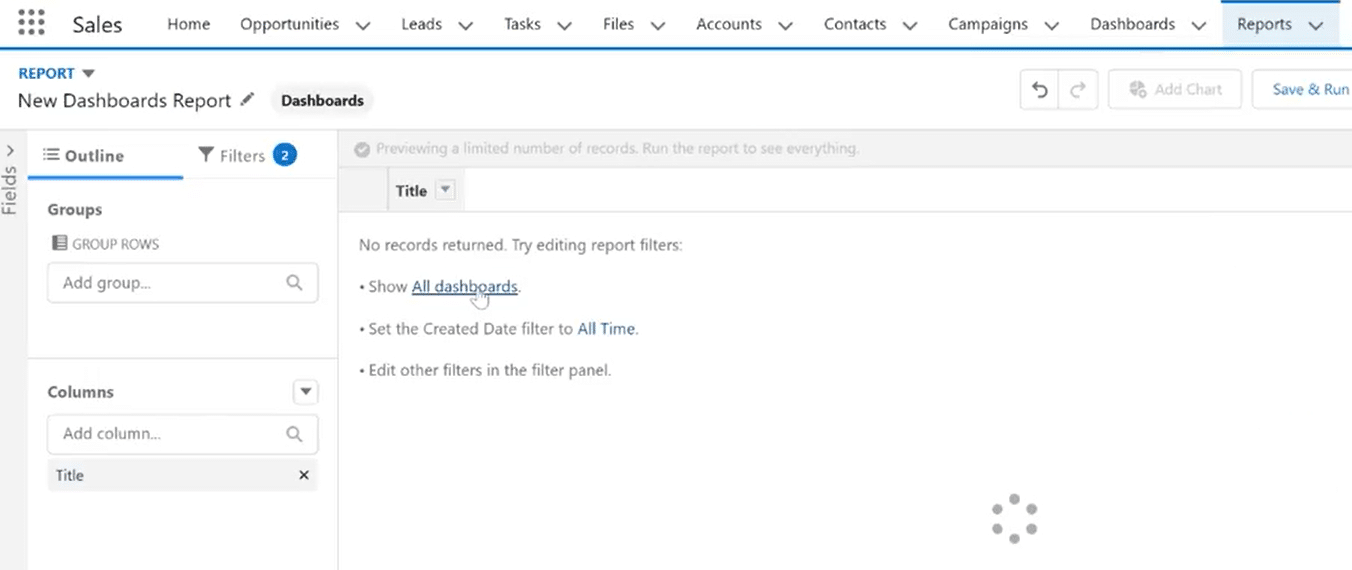
Step 3: Add Related Columns
In the Fields tab, add columns like Title and Dashboard Running User to see more information and permission types on your Salesforce dashboards.
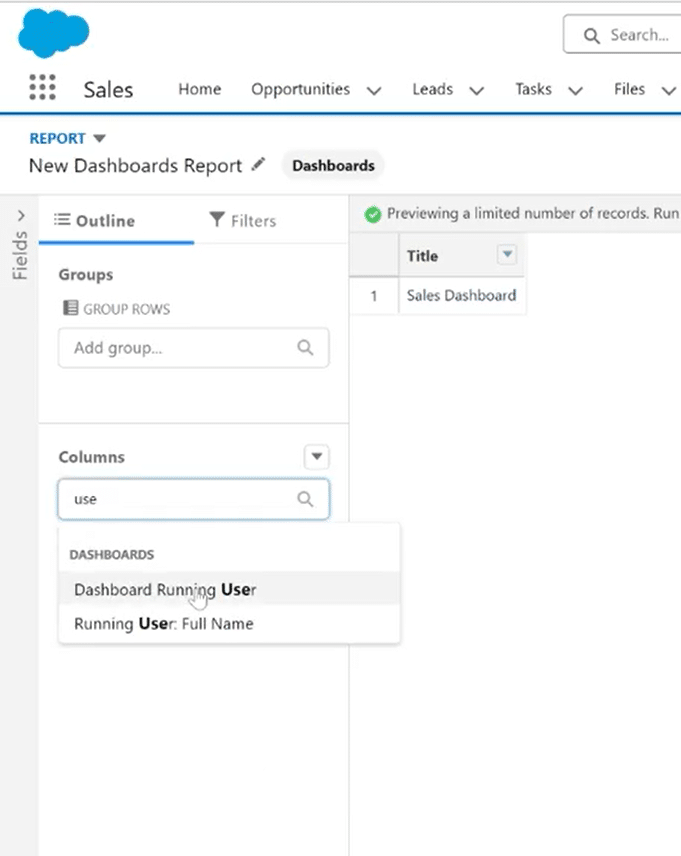
Step 4: Filter for Dynamic Dashboards
The final step to get a complete list of your dynamic Salesforce dashboards is to add relevant filters.
Explore 8 cutting-edge techniques that are revolutionizing how Salesforce admins manage their daily tasks. Contribute more significantly to business outcomes and become a key driver of efficiency and innovation.
See the Techniques
Navigate to the ‘Filters’ section in the Fields tab and search for your filters. In the case of dynamic dashboards, the most useful filter is ‘Dashboard Running User,’ which will help you filter out dashboards with dynamic user permissions.
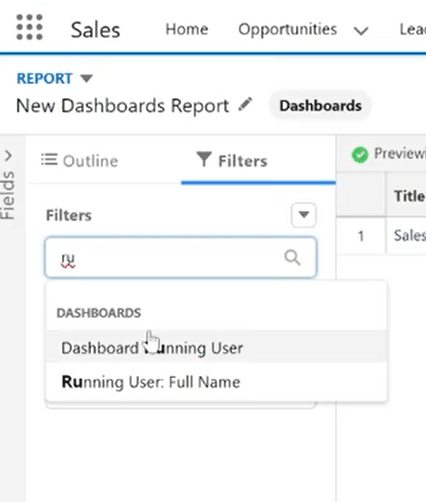
In this filter, add two Values for ‘Run as logged-in user’ and ‘Let authorized users change running user.’ These two values are what determine a dynamic dashboard based on permissions given.
Click on ‘Apply’ and you’re done!
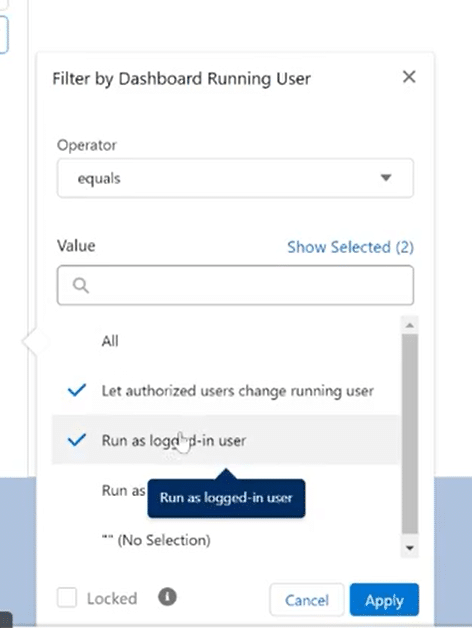
With all these filters applied, you can only see a list of dynamic dashboards linked to your Salesforce account.
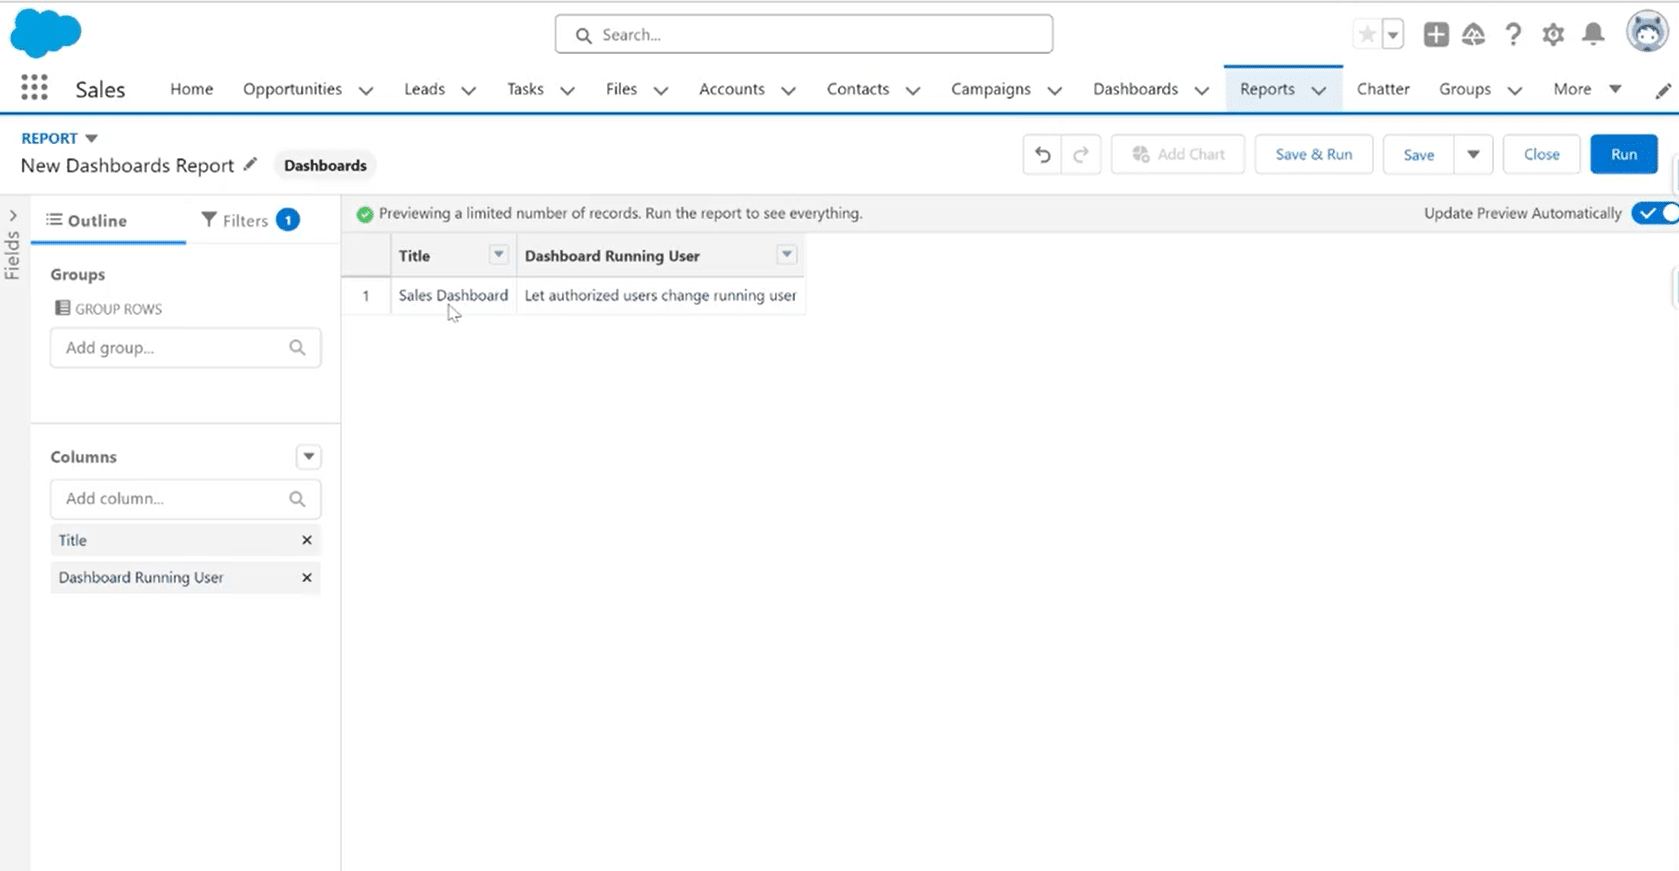
In this example, we only had one, but regardless of the number, your dashboards will be shown numbered, with titles and details, ready to be tracked and reviewed!
Troubleshooting Common Issues in Salesforce Org Management
Encountering issues while accessing or running dynamic dashboards in Salesforce can be frustrating, so here are some prevalent issues and step-by-step resolutions:
‘Insufficient Privileges’ Error
When attempting to access a dashboard, this error may appear for users with specific licenses (Chatter, Force.com Lightning Platform, Customer Portal, Company Community Portal, Partner Portal). The error may arise for non-dynamic dashboards if the running user has a license type different from the accessing user’s.
Solution: Provide the user with permission to ‘Manage Dashboards in Public Folders’. For specific dashboards:
In Salesforce Classic mode:
- Access the dashboard and click Edit.
- Next to ‘View dashboard as,’ select ‘Run as a specified user,’ enter a user with a Salesforce Platform license, and click Save.
- Finally, select ‘Run as logged-in user’ and click OK.
In Salesforce Lightning mode:
- Access the dashboard and click Edit.
- Click the Edit Dashboard Properties icon, choose ‘Another person’ under ‘View dashboard as,’ enter a user with a Salesforce Platform license, and click Save
Running User Permission Issue
The running user for a dashboard lacks the necessary permission to run reports, resulting in an error.
Solution:
- Go to the dashboard with the error and click Edit.
- Identify the running user in the Dashboard Properties.
- Find the user’s profile and navigate to the “General User Permissions” section.
- Ensure that the “Run Reports” permission is enabled.
Inactive Running User
The running user for a dashboard is inactive, causing an error.
Solution: Select an active user for the dashboard by:
- Accessing the dashboard.
- Clicking Edit.
- Choosing an active user in the ‘Running User’ settings.
4 Tips for Efficient Salesforce Dashboard Management
Here are some key tips to enhance the efficiency of your Salesforce dashboards:
Create Unified, Role-Based Dashboards
Rather than crafting multiple dashboards for different access levels, consider developing a single dynamic dashboard that caters to various user roles.
For instance, the CEO might require a comprehensive overview, while department heads may only need insights specific to their domains. Utilize dynamic components to customize data visibility based on user roles, providing a unified yet tailored experience.
Optimize Dynamic Dashboards Limit
Salesforce limits the number of dynamic dashboards you can create, varying with different editions.
Familiarize yourself with these limitations, such as five dynamic dashboards for Enterprise Edition, 10 for Performance and Unlimited Editions, and three for Developer Edition. If your organizational needs surpass these limits, consult your Salesforce account executive to explore options for increasing the limit as a paid feature.
Regular Review and Cleanup
Periodically review your dynamic dashboards to identify and remove outdated or underutilized ones. Consider conducting regular sessions to gather user feedback and adjust dashboard content accordingly.
Provide User Training
Ensure that users are familiar with dynamic dashboards’ features and interactivity options. Conduct training sessions to educate users on customization, filtering, and drill-down functionalities.
Final Word
As you begin this data-driven journey of Salesforce dashboard management, consider elevating your experience with Coefficient. Coefficient seamlessly integrates with Salesforce, transforming data management into a collaborative and real-time experience.
With features like seamless data integration to spreadsheets, instant Slack and email alerts, and the ability to act swiftly on new opportunities, Coefficient is the perfect companion for efficient Salesforce dashboard management.
Start automating your Salesforce data management with Coefficient for free today!
