


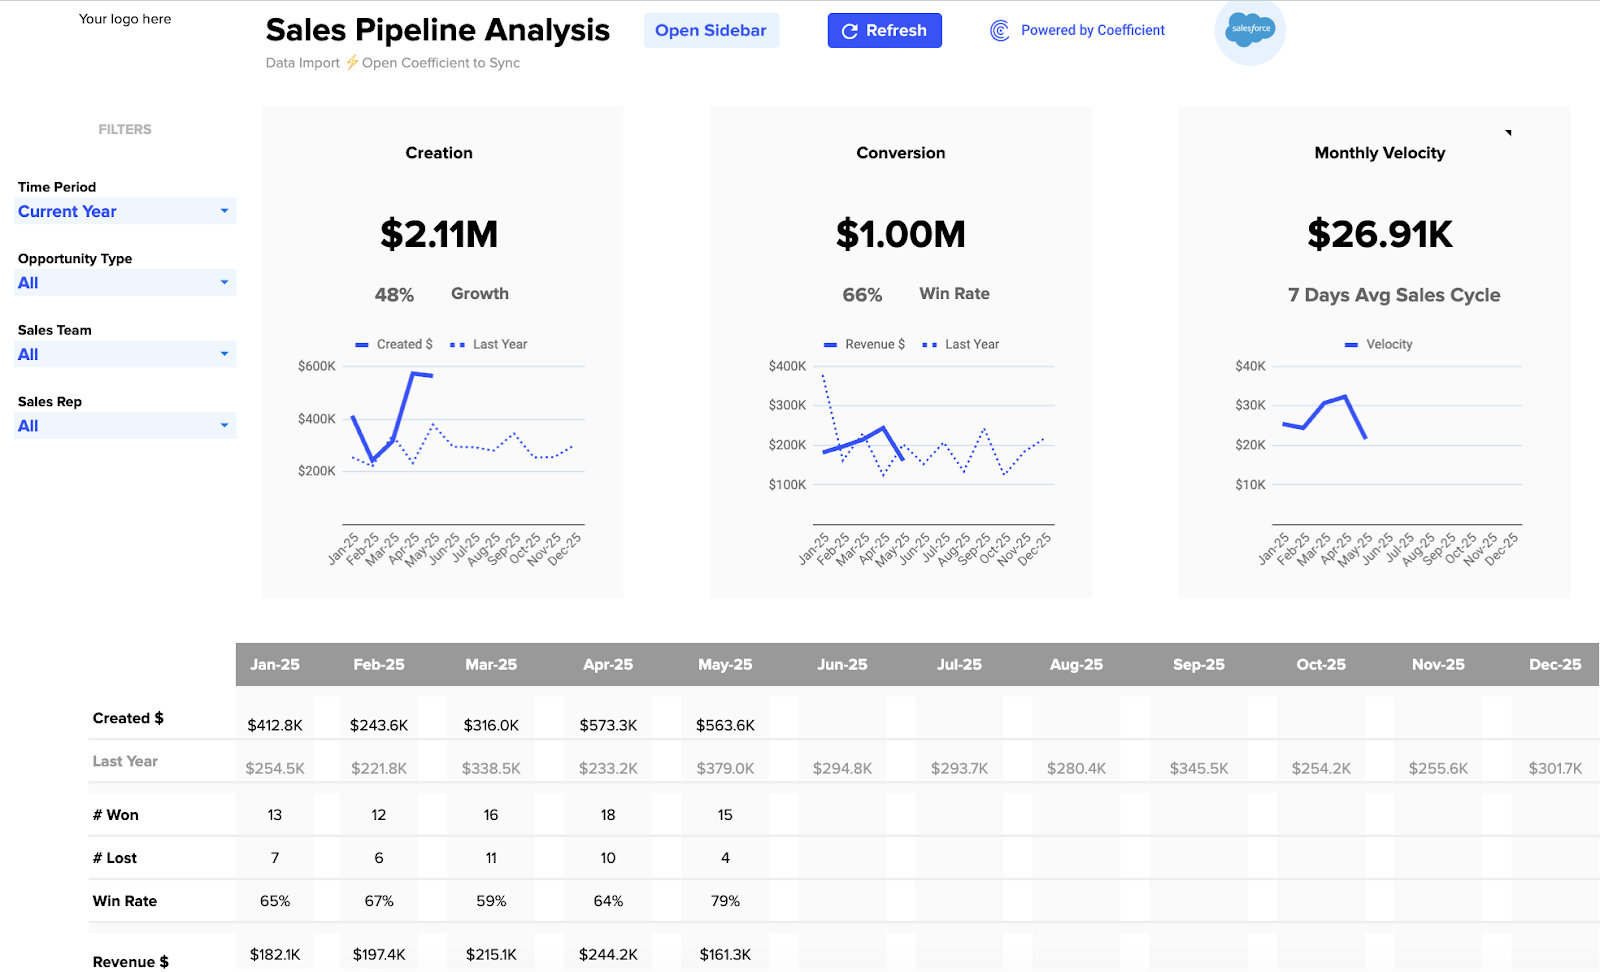
Visualizing your sales pipeline transforms raw data into actionable insights. Real-time dashboards show exactly where deals stand, what’s moving forward, and where revenue might fall short. The best sales leaders don’t just track numbers—they visualize trends and patterns to make faster, better decisions that drive growth.
Benefits of visualizing sales pipeline in Google Sheets or Excel
Custom dashboards with live CRM data
Spreadsheets give you freedom that most CRM dashboards can’t match. You create exactly what you need—not what the system thinks you want. With the right connection to your CRM, your spreadsheet becomes a living document that updates automatically.
No more copying and pasting. No more outdated reports. Just open your sheet and see what’s happening right now.
These custom views let sales leaders spot opportunities and problems faster than scrolling through CRM reports. You can highlight what matters most to your specific business and strip away everything else.
Flexible forecasting & scenario planning
What if that enterprise deal slips? What if your team closes 10% more opportunities this quarter?
Spreadsheets excel at scenario planning. You can create multiple forecast models and toggle between them in seconds. This flexibility helps sales leaders prepare for best-case, worst-case, and everything in between.
Unlike rigid CRM forecasts, spreadsheet visualizations let you adjust assumptions on the fly. You can simulate different close rates, deal sizes, and timelines with a few clicks. This “what-if” capability helps teams make better strategic decisions and set realistic targets.
Fast edits & iteration
Sales reporting needs change constantly. Maybe you need to track a new product line. Perhaps the CEO wants to see conversion metrics differently.
Spreadsheet visualizations adapt quickly. You can update formulas, add fields, or completely redesign dashboards in minutes. This speed lets you respond to changing business questions without waiting for IT or analytics teams.
The ability to iterate quickly means sales leaders can refine their reporting until it perfectly matches their needs. As your understanding evolves, your visualizations can evolve too.
Cross-team visibility & ease of access for leadership
Everyone understands spreadsheets. From the CEO to new sales reps, people know how to navigate rows and columns. This universal language makes sharing insights easier across departments.
Sharing a Google Sheet takes seconds. Everyone sees the same data, eliminating confusion from multiple versions of the truth. When executives have questions, they can look at the live dashboard instead of requesting new reports.
This transparency builds trust between sales and other departments. When everyone can see the pipeline, conversations shift from “what’s happening?” to “what should we do about it?”
Automated alerts & AI insights with Coefficient
Spreadsheet visualizations become even more powerful with automation. Modern tools can alert you when metrics change significantly, saving you from constant dashboard checks.
Coefficient takes this further by connecting your spreadsheets directly to AI-powered insights. The system can automatically flag deals that need attention or highlight unexpected pipeline changes. These proactive alerts help sales leaders focus on the right opportunities at the right time.
Instead of manually scanning for patterns, you get notifications about what matters most. This saves hours of analysis time and ensures critical changes never slip through the cracks.
Blend data from multiple sources
Great sales pipeline visualization often requires more than just CRM data. You might need marketing campaign metrics, customer success scores, or product usage statistics to get the full picture.
Spreadsheets excel at combining disparate data sources. With the right tools, you can pull information from your CRM, marketing automation platform, finance system, and more into a single visualization.
This comprehensive view helps sales leaders understand the complete customer journey. You can see how marketing activities impact pipeline generation, how customer health affects renewal forecasts, and how product adoption influences upsell potential.
Creating a sales pipeline visualization in Google Sheets
Creating a powerful sales pipeline dashboard doesn’t have to be complicated. Grab our free template to get started in seconds.
Prefer to visualize your sales pipeline by hand? Let’s walk through the process step by step:
Step 1: Install Coefficient
First, let’s connect your spreadsheet directly to your CRM data.
- Open Google Sheets and click the Extensions menu tab
- Select Add-ons and Get add-ons
- Search for “Coefficient” in the Google Workspace Marketplace
- Install the Coefficient add-on and launch it
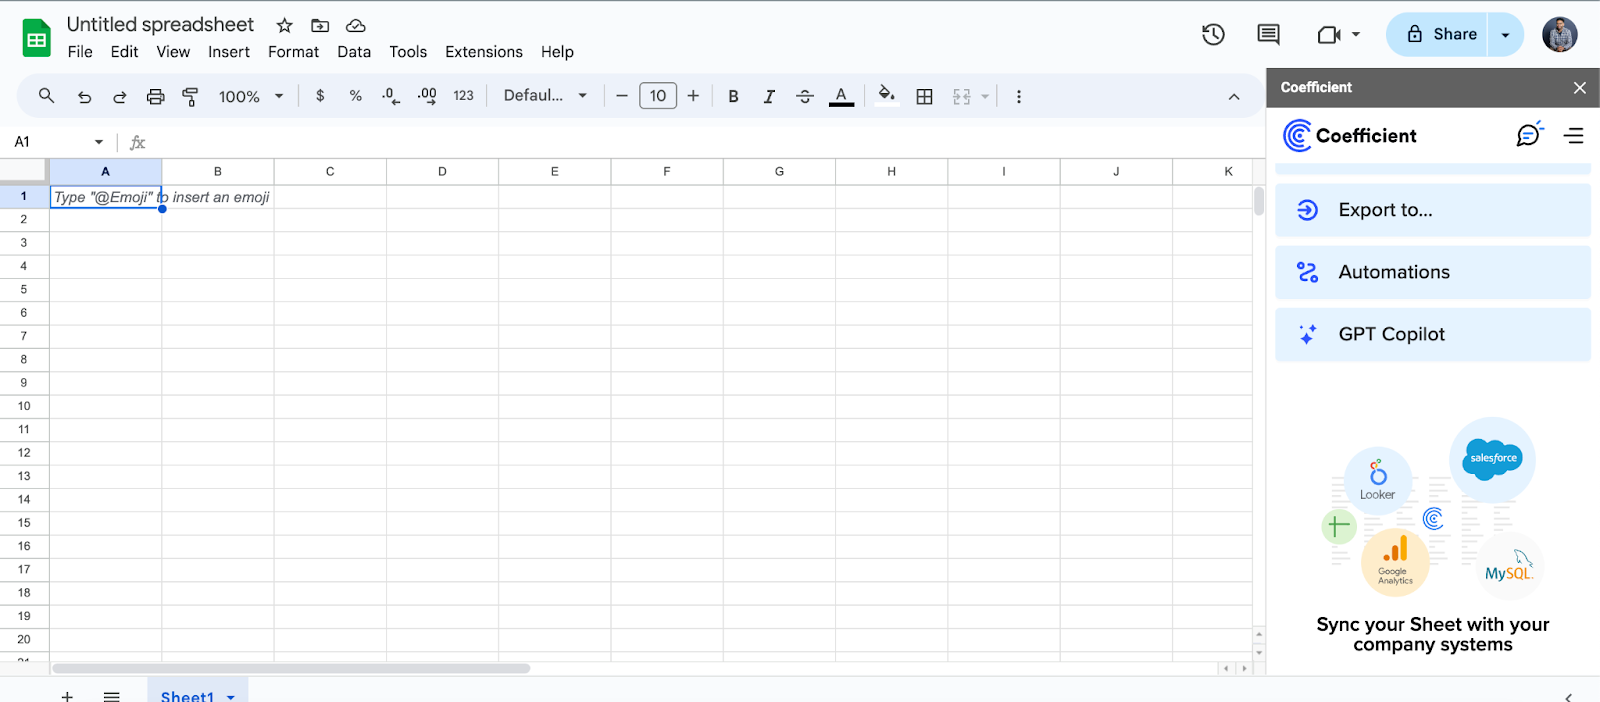
This connection eliminates manual exports and ensures your pipeline visualization always shows current data.
Step 2: Import Salesforce data
Now let’s pull in your pipeline data:
- In the Coefficient sidebar, choose “Import from…”
- Select Salesforce as your data source
- Click “From Objects & Fields”
- Under New Import, choose the “Opportunity” object
- Select key fields like “Forecast Category,” “Amount,” and “Close Date”
- Toggle “Pivot Mode” on
- Set “Forecast Category” as your row and “Close Date” as your columns
- Group by month with “Amount” as your value with the “Sum” function
- Name your import and click “Import”
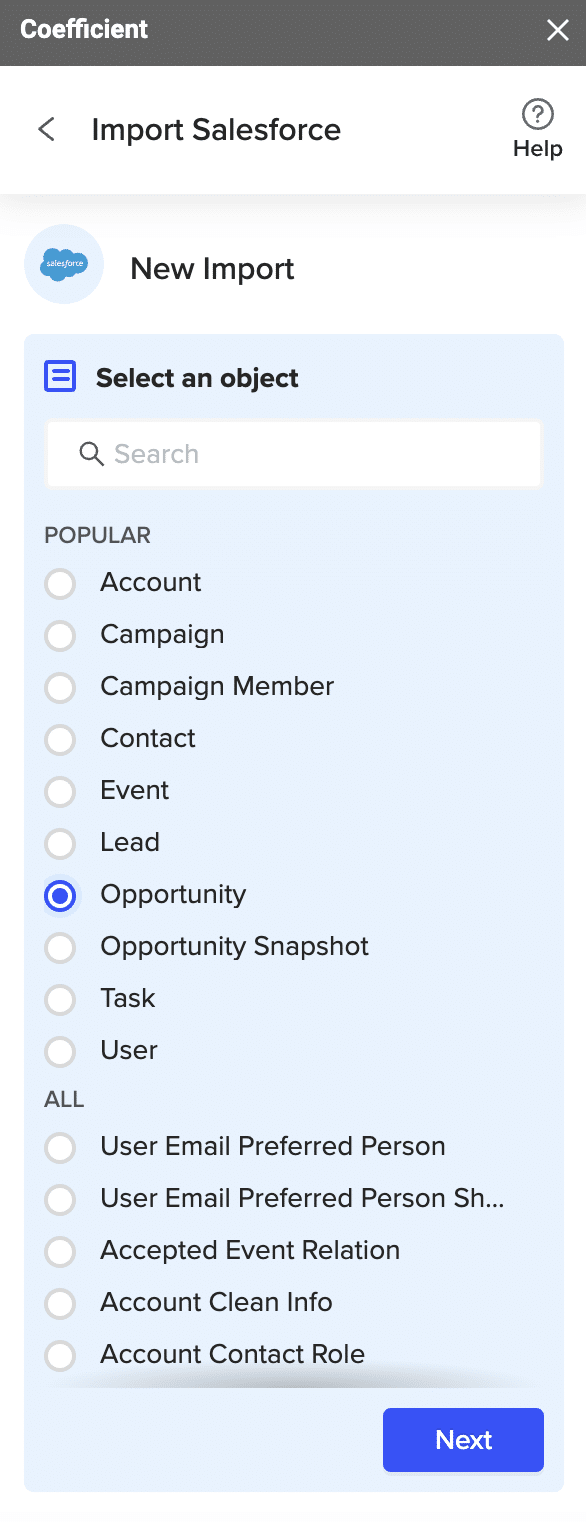
The beauty of this approach is that your data will automatically refresh. No more manual exports or outdated reports.
Step 3: Build your sales pipeline tracker
With your data imported, let’s create a structured view:
- Open a separate tab in your Google spreadsheet
- Build a table referencing your Salesforce import
- Put “Forecast Category” in column A and months across the first row
- Use formulas to calculate amounts for each pipeline category
- Add calculations for closed-won amounts and targets
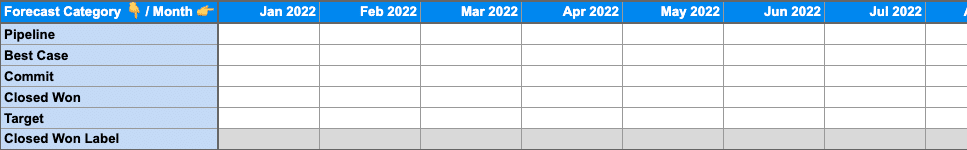
This structured approach makes it easy to track how deals move through your pipeline over time.
Step 4: Create your charts
Now for the visualization:
- Highlight your data range
- Go to Insert → Chart
- Change from “area chart” to “combo chart”
- Customize to show pipeline evolution as an area chart with a target line
- Adjust opacity to differentiate between forecast categories
- Add labels to highlight key metrics
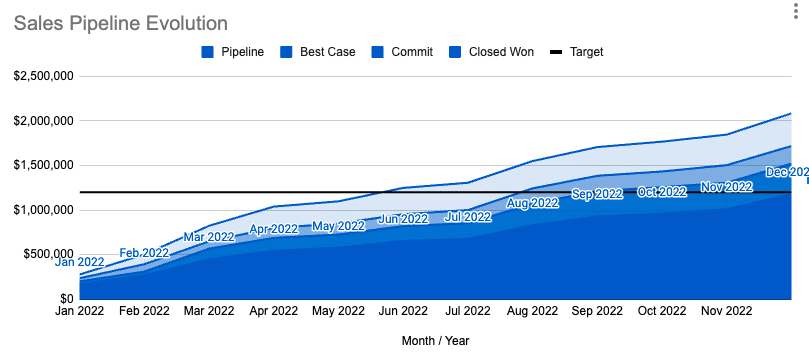
The result is a compelling visual that shows how your pipeline evolves throughout the year, with clear indicators of performance against targets.
Want a more detailed walkthrough? Watch this comprehensive video tutorial:
Video Walkthrough: How to Create a Sales Pipeline Tracker in Google Sheets
This step-by-step guide shows how to build a dynamic sales pipeline visualization that updates automatically with your Salesforce data. You’ll learn expert techniques to track pipeline changes throughout the year and visualize progress toward sales targets.
For a complete tutorial with additional tips, check out our detailed walkthrough.
Make better pipeline decisions
Sales pipeline visualization transforms how teams understand and act on their data. With Google Sheets and Coefficient, you get the perfect balance of flexibility and automation.
Your dashboards update automatically, alert you to important changes, and provide insights that static reports simply can’t match. This approach saves hours of manual work while giving you deeper visibility into what drives your revenue.
The best part? You can start today without complex setup or coding. Connect your data, build your visualization, and transform how your team makes decisions. Get started with Coefficient and turn your pipeline data into your competitive advantage.
FAQ
How to visualize a sales pipeline?
The most effective sales pipeline visualizations include funnel charts showing conversion between stages, pipeline waterfall charts displaying movement over time, and heat maps highlighting high-value opportunities. Start with a clear goal—whether tracking overall health, forecasting, or identifying bottlenecks.
Coefficient streamlines this process by connecting your spreadsheet directly to your CRM. This gives you live data visualizations that update automatically, letting you focus on analysis rather than data preparation. Your pipeline charts remain accurate without manual refreshing.
How do you monitor sales pipeline?
Effective pipeline monitoring requires tracking key metrics like total pipeline value, stage conversion rates, average deal size, and sales velocity. Regular pipeline reviews (weekly for frontline managers, monthly for executives) help identify stalled deals and forecast accuracy.
Coefficient transforms pipeline monitoring by automating data collection and providing real-time alerts. You can set up notifications for significant changes like deals slipping, stage transitions, or forecast adjustments. This proactive approach ensures issues are caught early rather than discovered in end-of-quarter surprises.
