Sales teams live or die by their pipeline. But manually tracking deals across stages wastes hours and creates blind spots. Automated pipeline reporting gives teams real-time visibility into what’s working, what’s not, and where revenue opportunities exist.
Sales pipeline issues solved using automated reports
Pipeline tracking headaches don’t solve themselves. Automation tackles these common challenges:
- Time drain – Teams waste hours manually updating reports instead of selling
- Data accuracy – Human error creates misleading pipeline views
- Visibility gaps – Leaders can’t see bottlenecks until it’s too late
- Accountability issues – Without clear metrics, performance management suffers
- Forecasting blindness – Inaccurate pipeline data leads to missed targets
Top 6 pipeline reports for high functioning sales teams
The right reports transform how teams track, analyze, and optimize their pipeline. These six automated dashboards deliver instant insights that drive results.
#1 Tracking sales activities
Purpose of the report
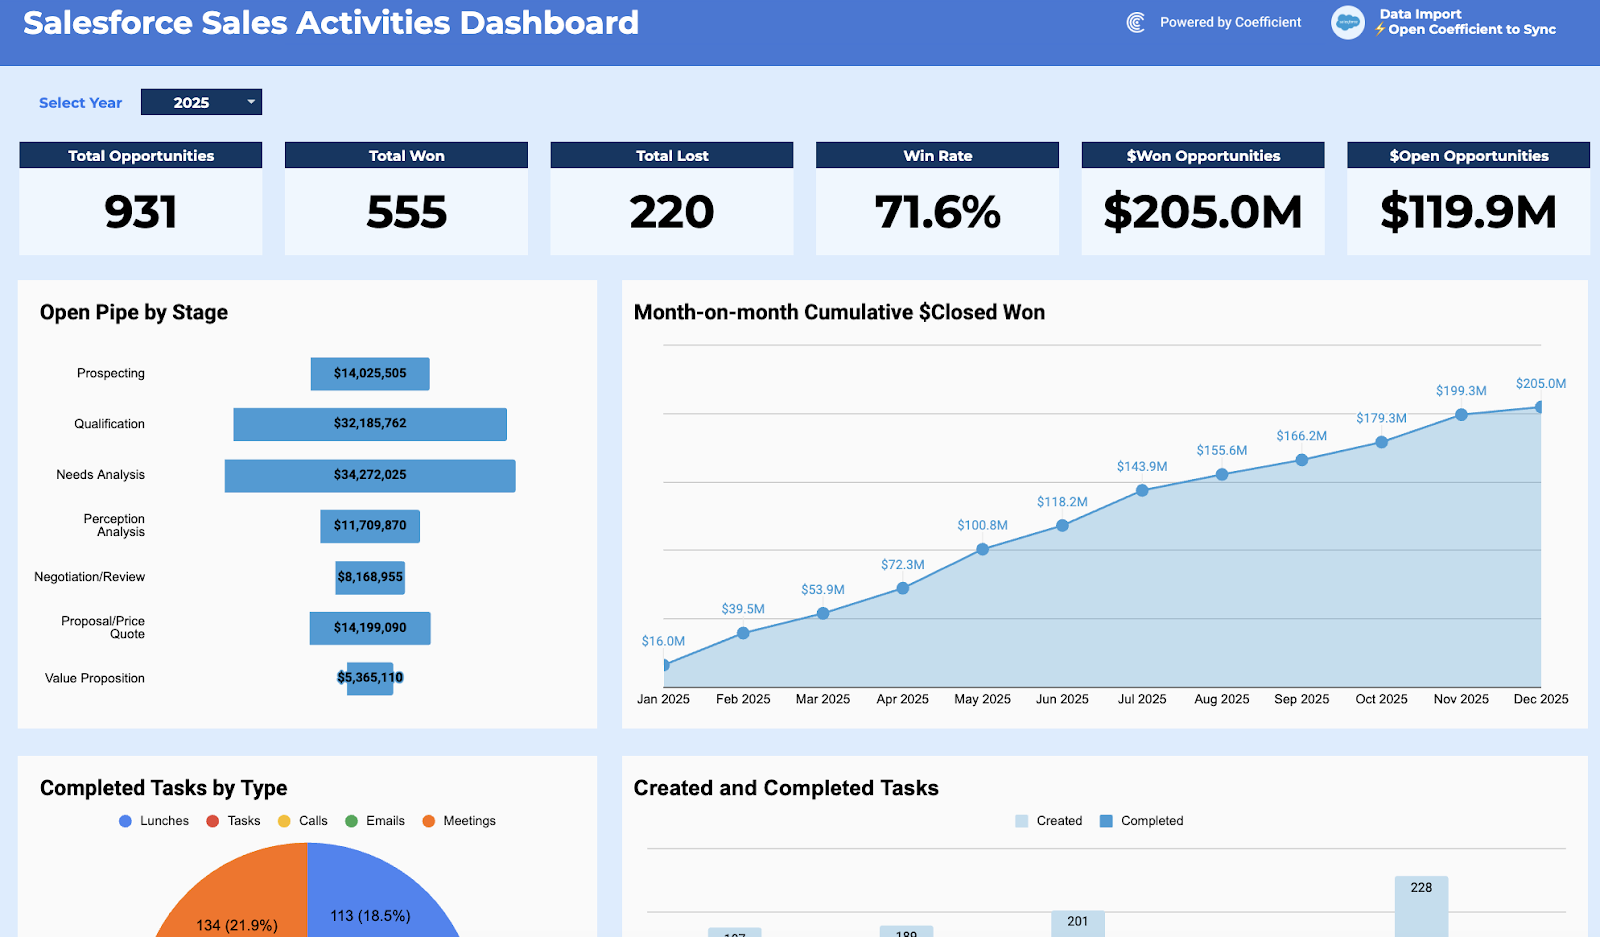
This dashboard connects directly to your CRM and automatically refreshes to show real-time sales activity data. It eliminates manual updates while giving teams complete visibility into their daily performance metrics.
Metrics tracked
- Total activities (vs. last month)
- Contact engagement rates
- Leads generated
- Open opportunities
- Follow-up rate
- Average response time
- Average time to close
- Completed activities (calls, meetings, emails)
- Top 5 deals by value
Useful for
This report serves sales managers tracking team productivity, sales operations professionals measuring activity metrics, and sales representatives monitoring their own performance against goals.
With Coefficient, this report pulls live from Salesforce without manual exports. Teams spot declining metrics early and make data-driven decisions faster.
Ready to stop wasting time on manual updates? Download our free Salesforce sales activities dashboard template that connects directly to your CRM.
#2 Sales manager or sales leadership dashboard
Purpose of the report
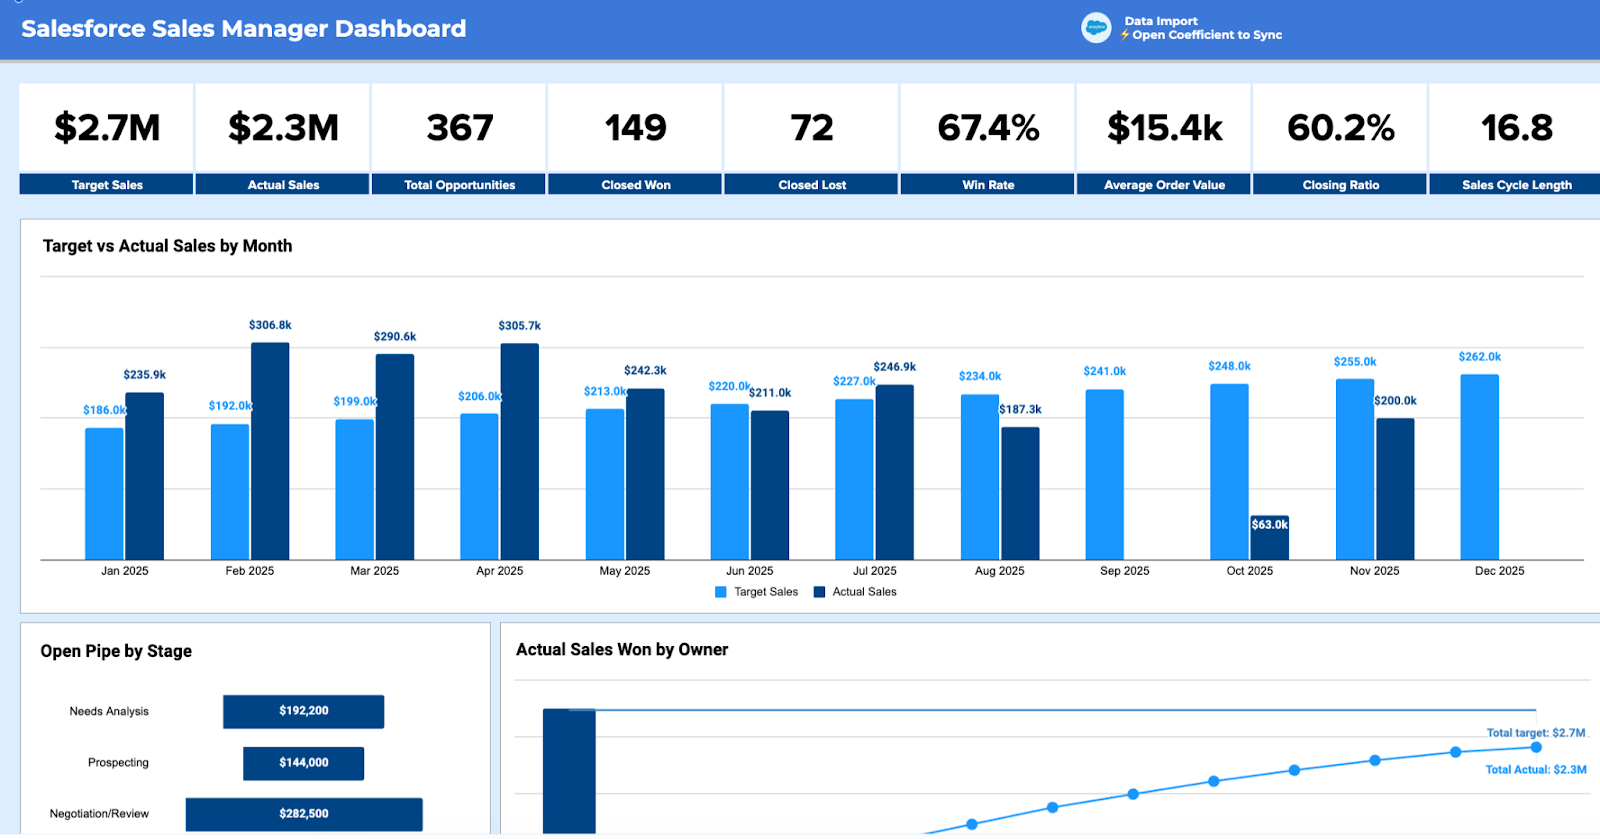
This dashboard creates a centralized command center for sales leaders to monitor team and individual performance. It combines critical sales KPIs into visual charts that reveal trends, identify coaching opportunities, and track progress toward targets.
Metrics tracked
- Sales targets and team revenue goals
- Conversion rates by stage
- Average order value (AOV)
- Pipeline progress
- Closing ratio
- Sales cycle length
- Customer acquisition cost (CAC)
- Win rate by rep and team
Useful for
This dashboard serves sales managers, directors, operations professionals, and executives who need quick access to performance metrics. It’s ideal for daily check-ins, team meetings, and strategic planning sessions.
Coefficient turns this dashboard into a living document that automatically syncs with Salesforce data. No more manual updates or stale information.
Want complete visibility into team performance? Get our free Salesforce Sales Manager Dashboard template and transform how you track results.
#3 In-depth pipeline analysis dashboard
Purpose of the report
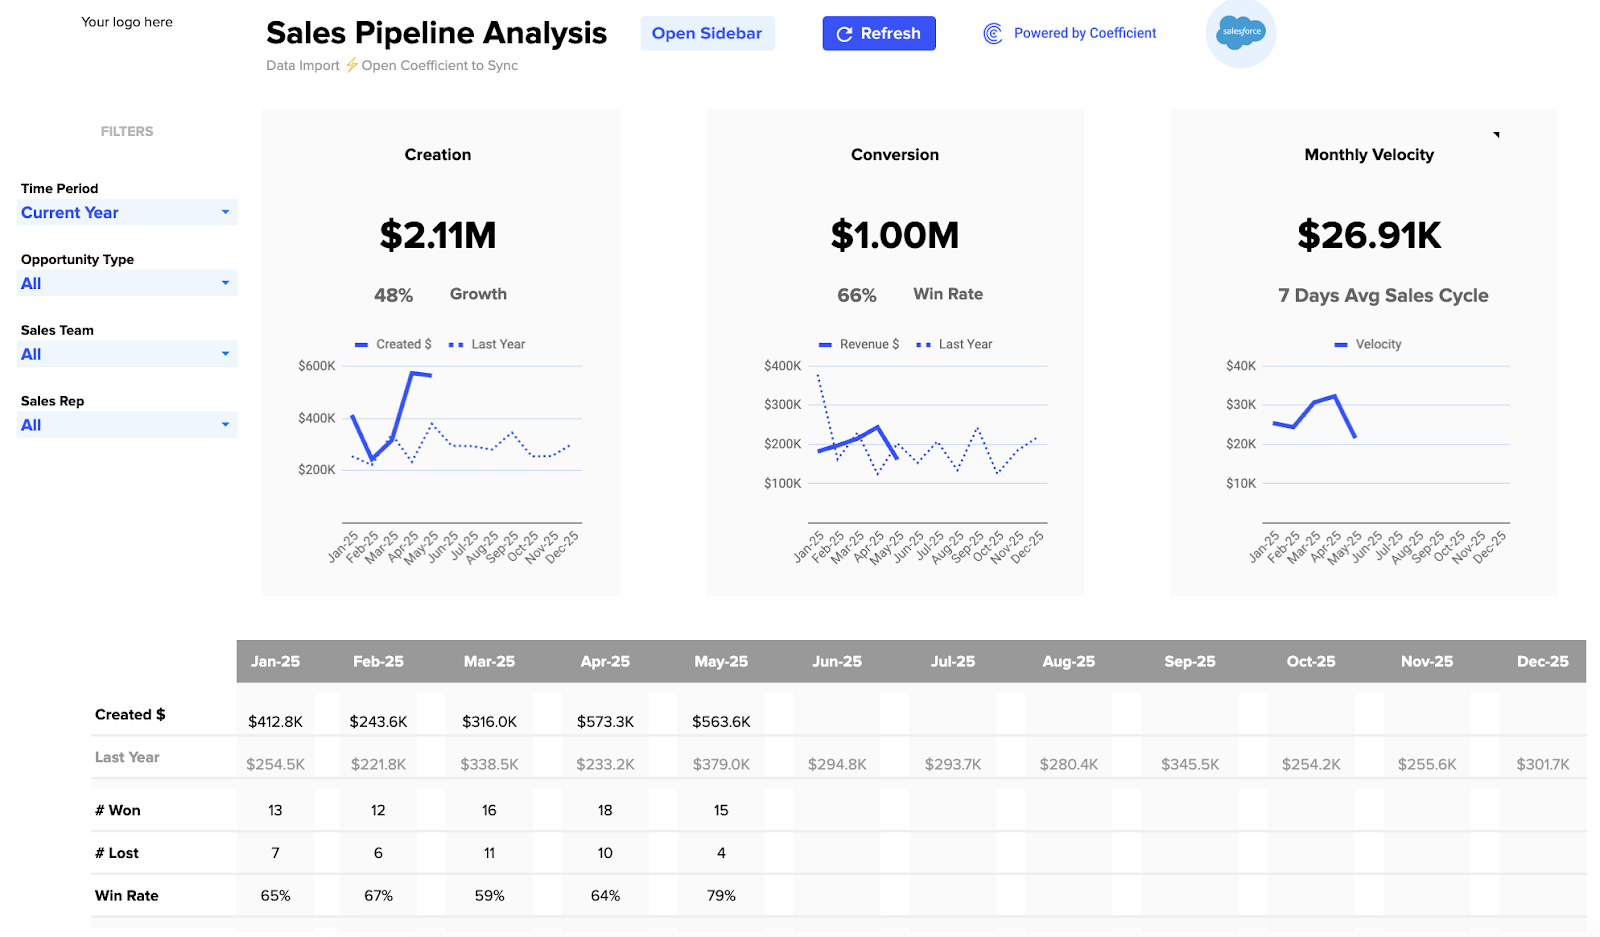
This report digs deeper into pipeline health metrics. It helps teams understand core sales operations data and compare monthly results across key performance indicators.
Metrics tracked
- Pipeline creation by stage
- Win rates by segment
- Average deal age
- Average deal size
- Sales velocity
- Opportunity distribution by stage
- Bottleneck identification
Useful for
Sales operations leaders, revenue operations teams, and sales directors use this dashboard to identify pipeline bottlenecks and optimize the sales process. It’s particularly valuable for teams seeking to improve conversion rates between stages.
The report connects directly to Salesforce through Coefficient, allowing teams to slice data by sales rep, opportunity type, and time period with no manual effort.
Ready to identify pipeline bottlenecks before they hurt revenue? Get our free Pipeline Analysis Dashboard and gain instant insights into your sales process.
#4 Weighted sales pipeline
Purpose of the report
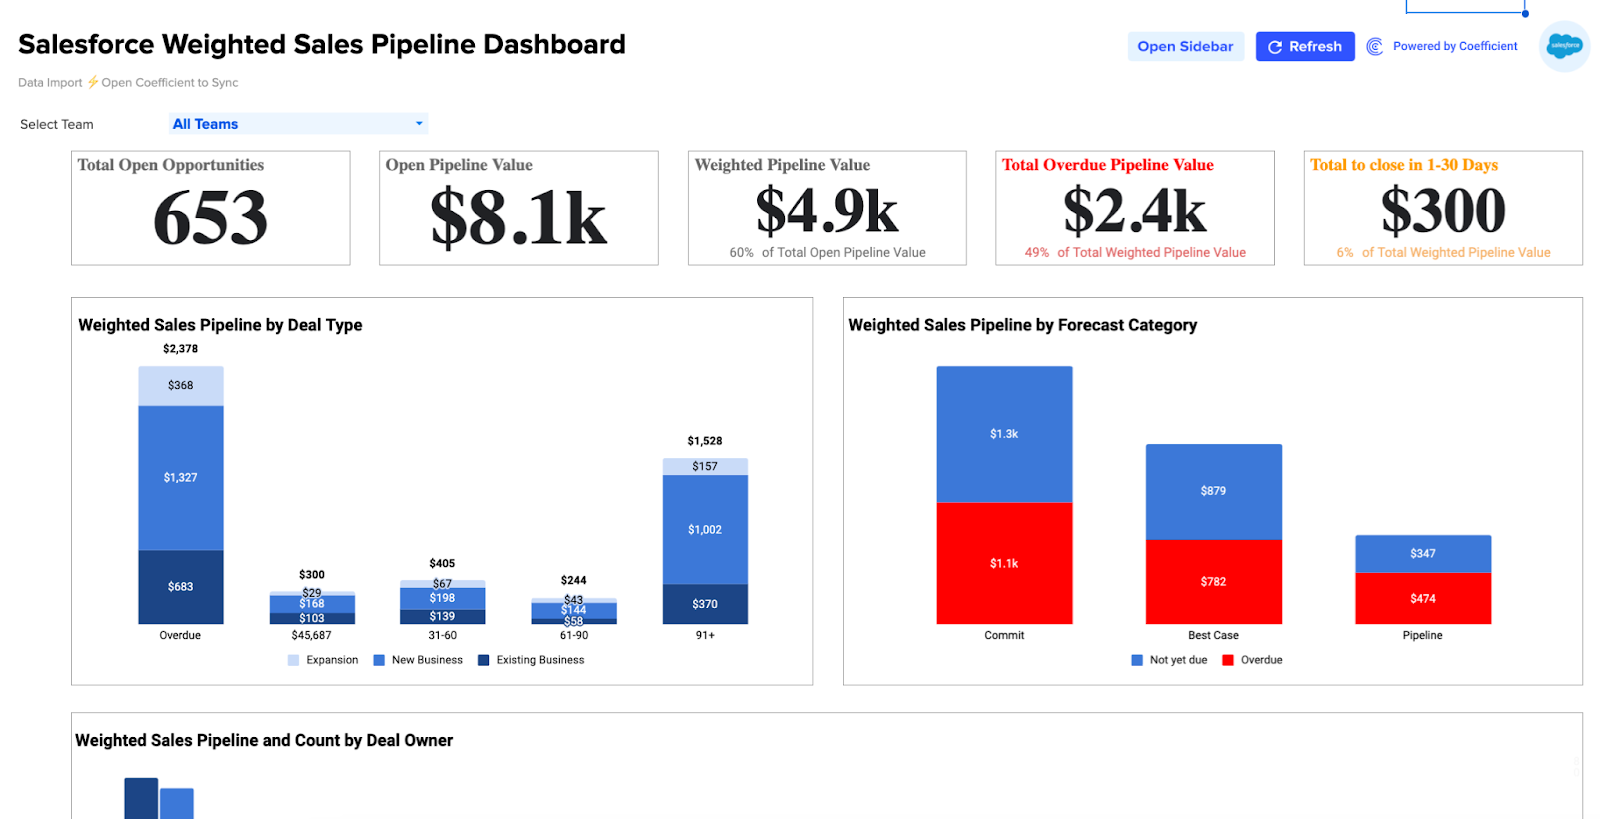
This dashboard transforms raw pipeline data into probability-weighted projections. Unlike standard reports that treat all opportunities equally, this view adjusts deal values based on their likelihood to close.
Metrics tracked
- Total open opportunities
- Open pipeline value
- Weighted pipeline value
- Overdue pipeline value
- Deals closing in next 30 days
- Pipeline by forecast category
- Weighted sales by deal owner
- Deal-level details with closing timeframes
Useful for
Sales leaders, revenue operations teams, and finance departments rely on this report for accurate forecasting. It’s essential for identifying at-risk revenue and making confident resource allocation decisions.
Coefficient automates this entire process, eliminating tedious exports and manual probability calculations. Teams get accurate forecasts with one-click refreshes.
Need more accurate revenue forecasts? Download our Salesforce Weighted Pipeline template and transform how you predict sales.
#5 Win-loss analysis dashboard
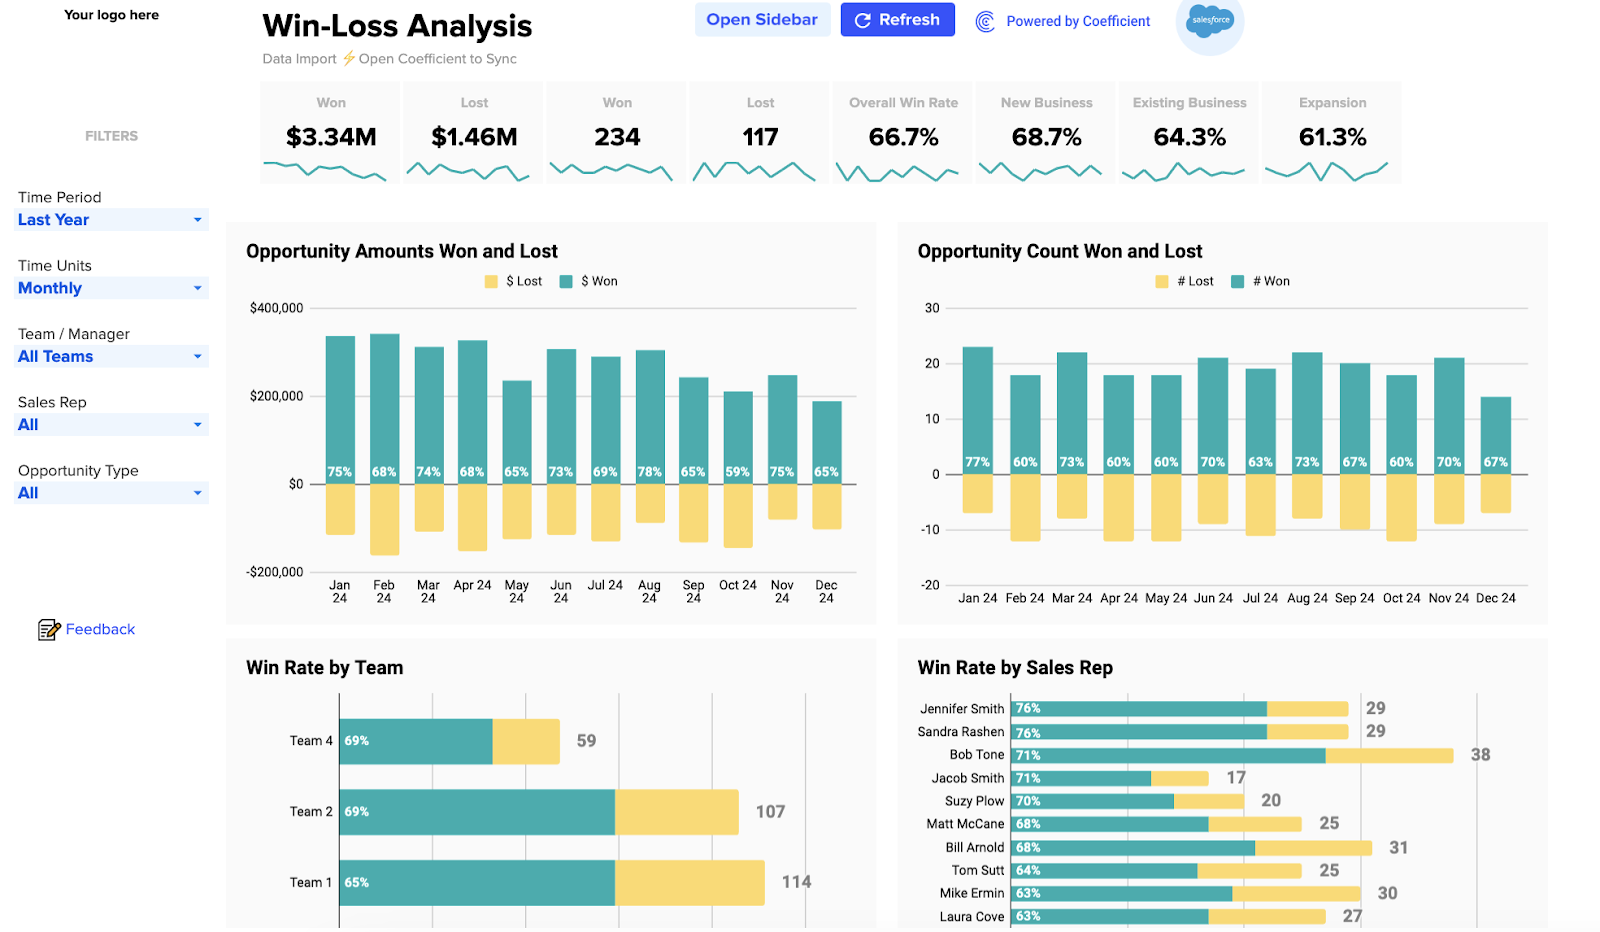
Purpose of the report
This dashboard helps teams understand why they win and lose deals. It tracks conversion rates across all sales units and reps to identify performance trends and improvement opportunities.
Metrics tracked
- Win/loss ratio by rep and team
- Performance trends over time
- Recently lost opportunities with reasons
- Win rate by product/service
- Win rate by deal size
- Competitive analysis
- Loss reasons by category
Useful for
Sales enablement leaders, sales managers, and product teams use this analysis to refine tactics and improve win rates. Marketing teams also gain insights for messaging adjustments.
Coefficient keeps this dashboard current with automated refresh schedules and can even trigger Slack alerts when significant deals are lost.
Want to maximize wins and cut losses? Launch our free Win-Loss Analysis Template and start making data-driven improvements today.
#6 Sales opportunity overview dashboard
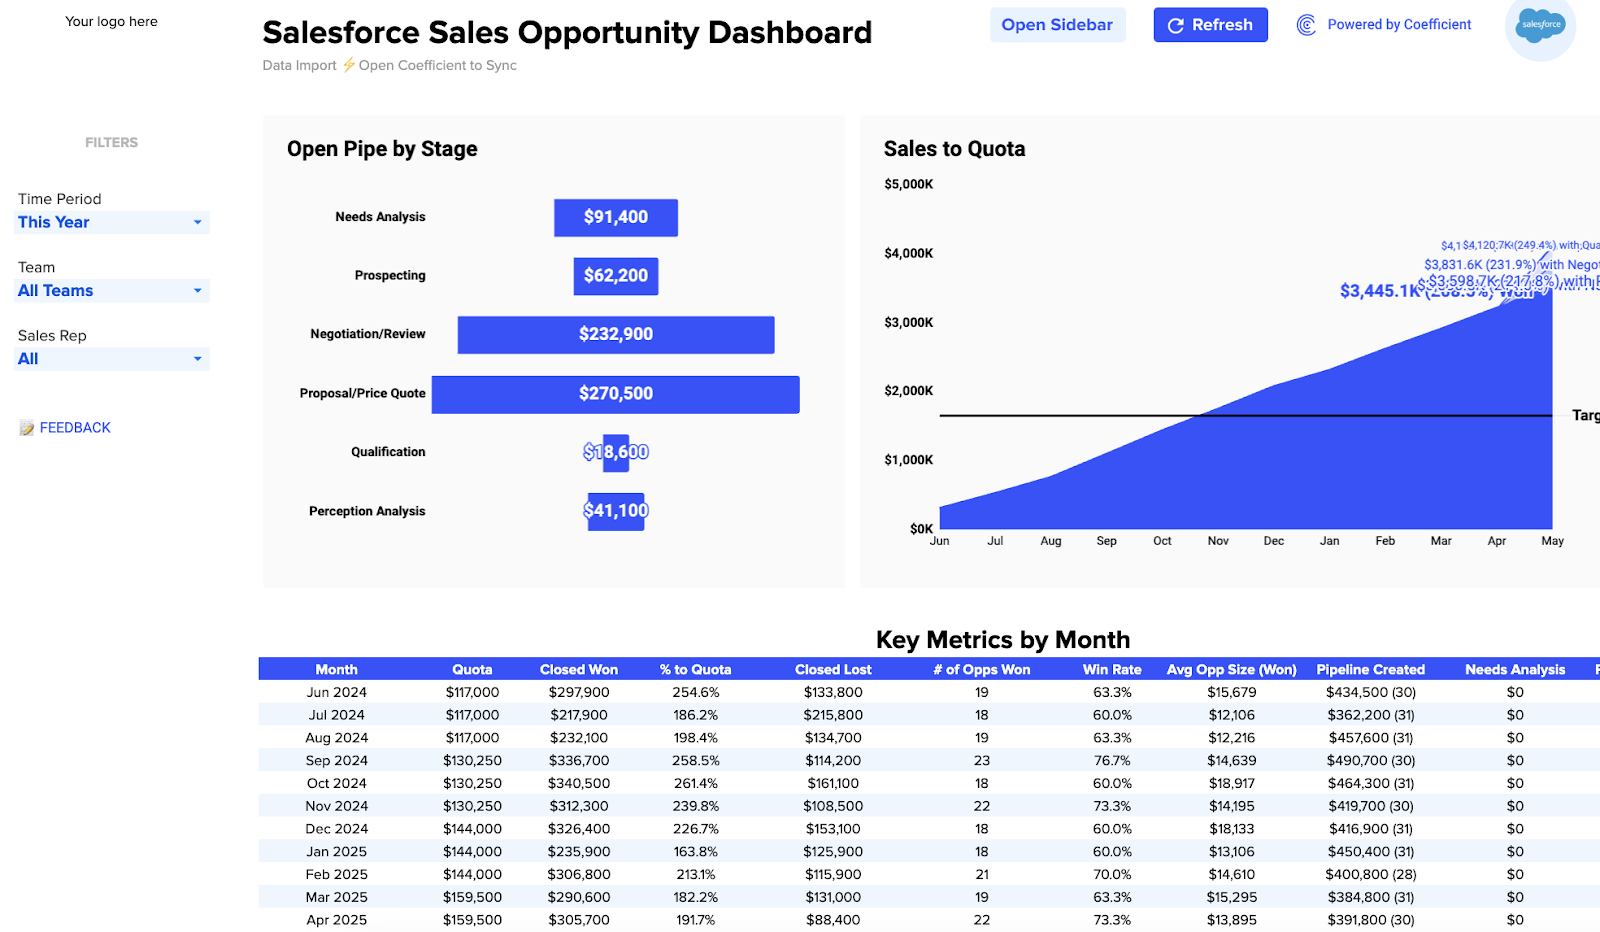
Purpose of the report
This dashboard provides a comprehensive view of the entire opportunity pipeline. It tracks leads from first touchpoint to final close while connecting individual and team performance to targets.
Metrics tracked
- Pipeline by stage and forecast period
- Individual and team quotas
- Monthly KPIs (win rate, average deal size)
- Value by stage or forecast category
- Recent/upcoming opportunities
- Sales cycle duration
- Opportunity age
Useful for
Sales representatives, managers, and operations teams use this dashboard for daily pipeline management. It’s particularly valuable for small businesses seeking to streamline sales efforts.
With Coefficient, this dashboard automatically syncs with your CRM and provides hyperlinks directly to opportunity records for seamless workflow.
Ready to take control of your sales destiny? Get our Salesforce Sales Opportunity Template and track every opportunity from first touch to final close.
Take your pipeline to the next level
Automated pipeline reports transform how teams track and optimize their sales process. With real-time data at your fingertips, you can spot trends earlier, coach more effectively, and make confident decisions that drive revenue. The six reports outlined above provide different views into your pipeline health, from activity tracking to win/loss analysis.
Implementing these reports doesn’t require complex setup or technical skills. With Coefficient, you can get started today by connecting your spreadsheets directly to your CRM for live, automated reporting that eliminates manual updates and provides accurate insights when you need them most.
FAQs
What is a sales pipeline report?
A sales pipeline report is a visual representation of where potential deals stand in your sales process. It tracks opportunities as they move through defined stages from initial contact to closed deal. Good pipeline reports show the number of deals, their value, and their distribution across stages, helping teams identify bottlenecks and forecast revenue.
What is a sales pipeline example?
A typical B2B software sales pipeline might include stages like:
- Qualification (10%) – Initial contact established, basic fit confirmed
- Discovery (25%) – Needs assessment completed, decision-makers identified
- Solution presentation (50%) – Product demo delivered, proposal shared
- Evaluation (75%) – Technical review complete, addressing objections
- Negotiation (90%) – Discussing terms, pricing finalized
- Closed won/lost (100%) – Final decision reached
Each stage has defined criteria and assigned probability percentages to help forecast revenue accurately. The pipeline visualizes how many deals exist in each stage and their combined value, helping teams prioritize their selling activities.