How to extract folder-level permissions matrix for Salesforce reports and dashboards

Salesforce provides no native folder-level permissions matrix view, requiring administrators to manually check each folder’s sharing settings individually through Setup > Sharing Settings.

Here’s how to create comprehensive permission matrices directly in your spreadsheet using automated data imports.

Create dynamic folder permission matrices using Coefficient

Coefficientsolves this by creating comprehensive permission matrices with automated updates. You get consolidated matrix views, historical tracking of permission changes, and powerful export capabilities for permission data.

How to make it work

Step 1. Import folder data for reports and dashboards.

SalesforceConnect tousing SOQL:. This gives you the complete list of folders to analyze.

Step 2. Import permission data and user mappings.

Get permission details with:. Then import user/profile mappings:for complete visibility.

Step 3. Create dynamic permission matrices using pivot tables.

Use your spreadsheet’s PIVOT table functionality and Coefficient’s formula auto-fill to create dynamic permission matrices. Cross-reference folder IDs with permission data and user information.

Step 4. Apply conditional formatting to visualize access levels.

Use conditional formatting to highlight different access levels (Read, Edit, Manage). Create filterable, sortable views of all folder permissions with color coding for quick identification of permission patterns.

Eliminate manual permission auditing with automated matrices

Build yourThe resulting matrix provides filterable, sortable views of all folder permissions with automated updates through Coefficient’s scheduling features.automated permission matrix today.
How to create Salesforce reports showing opportunities with specific products OR without products

SalesforceYou can’t create a singlereport showing opportunities with specific products OR opportunities without products because cross filters don’t support OR logic with standard filters.

This guide shows you how to bypass this limitation and create the unified opportunity report you need using advanced data integration.

Create unified opportunity reports using Coefficient

CoefficientSalesforce’seliminatescross filter restrictions by extracting your opportunity data directly and applying complex OR logic that the platform can’t handle natively. Instead of managing multiple separate reports, you get one comprehensive view.

How to make it work

Step 1. Import your opportunity data with product relationships.

Connect to Salesforce using Coefficient’s “From Objects & Fields” method. Select the Opportunity object and include all relevant fields like Name, Amount, Stage, and Close Date. Import related OpportunityLineItem data separately to capture product relationships, including Product2.Name and Quantity fields.

Step 2. Apply complex OR filtering logic.

Use Coefficient’s advanced filtering to identify both scenarios simultaneously. Create filters for opportunities with your target products:OR opportunities without any products:. This OR logic combination is impossible in Salesforce native reporting.

Step 3. Consolidate into a unified report.

Use spreadsheet functions to merge both datasets:. Add a categorization column withto distinguish opportunity types. Calculate unified metrics across both categories for comprehensive analysis.

Step 4. Set up automated refresh and alerts.

Schedule automatic data refresh to maintain current information without manual updates. Configure alerts for new opportunities appearing in either category. This keeps your unified report accurate while eliminating the need to manage multiple Salesforce reports.

Get the complete opportunity view you need

Start buildingThis approach transforms what requires multiple disconnected Salesforce reports into a single comprehensive analysis tool. You’ll have real-time insights across all opportunity types that cross filter limitations prevent.your unified opportunity reports today.

How to exclude accounts with zero dollar opportunities from Salesforce net new account report

SalesforceExcluding zero-dollar opportunities from net new account analysis is particularly challenging inbecause these records often represent placeholder opportunities, test data, or incomplete records that skew reporting accuracy. Native filtering struggles with this nuanced data cleanup requirement.

Here’s how to build cleaner net new account reports by filtering out zero-dollar opportunities at the source and creating quality control measures.

Clean up your data with Coefficient

CoefficientSalesforceprovides superior data handling for this common net new accountsreporting challenge by letting you filter out problematic data before analysis.

How to make it work

Step 1. Import clean data at the source.

Use Coefficient’s filtering capabilities to exclude Amount = 0 or null values during import. Use “From Objects & Fields” with Amount > 0 filter, or custom SOQL:

Step 2. Set up dynamic amount criteria.

Create dynamic filtering by pointing to a cell containing your minimum amount threshold. This allows easy adjustment without re-importing data when your qualification criteria change.

Step 3. Identify accounts with only zero-dollar opportunities.

Use formulas to flag accounts that only have zero-dollar opportunities for data quality review:

Step 4. Build refined net new calculation.

Create comprehensive logic that considers both amount and stage criteria:

Step 5. Create quality control dashboard.

Build a secondary analysis showing excluded accounts for data quality review, so you can identify patterns in your zero-dollar opportunity creation.

Get more accurate net new account identification

Start cleaningThis approach ensures more accurate net new account identification by eliminating data quality issues that commonly affect Salesforce opportunity amount criteria reporting.up your account reports today.

How to export historical pipeline snapshots from HubSpot to Excel for trend analysis

HubSpot lacks native functionality to export pipeline data as it existed at specific past dates. You can’t easily track how your pipeline looked last month or compare pipeline states over time for trend analysis.

Here’s how to automatically capture historical pipeline snapshots and export them to Excel for comprehensive trend analysis that HubSpot’s standard reporting cannot provide.

Capture automated historical pipeline data using Coefficient

Coefficient’sHubSpot’sSnapshots feature specifically addresses this challenge by automatically capturing historical pipeline data copies for Excel trend analysis. Unlikelimited historical reporting, you get complete pipeline state preservation at any frequency you need.

Each snapshot maintains complete deal data with all custom properties as they existed at capture time, creating a comprehensive historical dataset impossible to build with HubSpot’s native tools.

How to make it work

Step 1. Set up live pipeline data import with required properties.

Create a live import of your pipeline deals including all relevant properties like deal amount, stage, probability, close date, and custom fields. This becomes your current pipeline view that updates automatically with fresh data.

Step 2. Configure monthly snapshots for historical capture.

Enable scheduled snapshots to automatically preserve pipeline state data on specific dates like month-end. Choose monthly frequency for quarterly trend analysis, or weekly snapshots if you need more granular historical tracking.

Step 3. Create Excel analysis comparing pipeline periods.

Build formulas to compare pipeline values, stage distribution, and deal velocity across different snapshot periods. Use SUMIFS to calculate pipeline totals by month and create percentage change calculations between periods.

Step 4. Build trend charts for pipeline growth visualization.

Create Excel charts showing pipeline growth, conversion rates, and forecasting accuracy over time using your historical snapshot data. Include trend lines to identify seasonal patterns and performance trajectories.

Step 5. Use Excel’s data analysis tools for pattern identification.

Apply Excel’s statistical functions to identify seasonal patterns, calculate moving averages, and spot performance trends that would be impossible to detect without historical pipeline data preservation.

Finally track how your pipeline actually changes over time

Start capturingThis automated approach creates a comprehensive historical pipeline dataset in Excel that enables sophisticated trend analysis impossible with HubSpot’s standard reporting capabilities.your pipeline history automatically today.

How to check effective permissions for Salesforce reports when users have multiple permission sets

Calculating effective permissions across multiple permission sets is extremely complex in Salesforce, as permissions can be additive across profiles, permission sets, sharing rules, and role hierarchies with no native calculator available.

Here’s how to simplify this through automated permission aggregation and spreadsheet analysis capabilities.

Calculate effective permissions automatically using Coefficient

Coefficientsimplifies effective permission calculation through automated permission aggregation. You can import all permission sources using comprehensive SOQL queries and create effective permission matrices with permission source attribution.

How to make it work

Step 1. Import all permission sources with comprehensive queries.

SalesforceConnect toand import profile permissions:. Then get permission set assignments:

Step 2. Get folder sharing permissions.

Import folder-level access:. This captures sharing rule permissions that might grant access beyond profile and permission set settings.

Step 3. Create additive permission calculations using spreadsheet formulas.

Use Coefficient’s formula auto-fill to create IF/OR formulas that determine the highest permission level across sources. Build VLOOKUP combinations to cross-reference user assignments and conditional logic for permission inheritance rules.

Step 4. Build effective permission matrices.

Create user-specific effective permissions across all reports with permission source attribution (Profile vs Permission Set vs Sharing). Calculate access level results showing Read/Edit/Manage effective rights for each user-report combination.

Step 5. Apply dynamic filtering and schedule updates.

Use dynamic filtering to analyze specific users or permission combinations. Schedule automated updates to maintain current effective permission calculations as permission assignments change.

Get comprehensive effective permission visibility

Salesforce’sStart calculatingThis provides comprehensive effective permission visibility that’s impossible throughnative interface, eliminating hours of manual permission checking.your effective permissions today.

How to create Salesforce report for accounts with no closed won opportunities since specific date

SalesforceFinding accounts that haven’t closed any deals since a specific date is trickier than it sounds.native reporting struggles with this “accounts WITHOUT something” scenario because it requires complex cross-object analysis between accounts and opportunities.

SalesforceHere’s how to build this report using spreadsheet formulas that can handle the negative filtering logic thatcan’t manage effectively.

Build the report using Coefficient

Coefficientlets you import both account and opportunity data into your spreadsheet, then use formulas to identify accounts with opportunities but no closed won deals since your target date. This approach bypasses Salesforce’s cross-filter limitations entirely.

How to make it work

Step 1. Import your account data.

Use Coefficient’s “From Objects & Fields” to pull all accounts with key fields like Account ID, Name, Created Date, and Industry. This gives you the base list to analyze against.

Step 2. Import opportunity data with date filtering.

Create a second import for opportunities, including Account ID, Stage, Close Date, Amount, and Created Date. Use dynamic filtering to only include opportunities created since your target date (like 2018 or whenever you want to start tracking).

Step 3. Create your analysis formula.

Use a COUNTIFS formula to identify accounts that have opportunities but no “Closed Won” stage since your specified date:

Step 4. Set up automated refresh.

Schedule hourly or daily refreshes to keep your report current without manual work. This ensures you’re always working with the latest opportunity data.

Get better account insights with real-time data

Start buildingThis approach gives you the flexible date handling and cross-object analysis that Salesforce’s standard reports can’t provide.more sophisticated account reports today.

How to create employee list with less than 40 hours from Salesforce timecards

Creating employee lists based on aggregated timecard hours requires working around Salesforce’s inability to filter on calculated totals, since native reports and list views cannot reference timecard aggregations.

Here’s the most efficient method for generating and maintaining dynamic employee lists that update automatically with current timecard data.

Generate dynamic employee lists with automated timecard analysis using Coefficient

SalesforceCoefficientSalesforcecannot create reports that filter employees based on sum of their timecard hours, and list views on Employee objects cannot reference timecard aggregations.provides the most efficient method by integrating both employee data and timecard records from, then using spreadsheet functions to calculate totals and generate filtered lists that maintain current employee status with scheduled data refreshes.

How to make it work

Step 1. Import employee and timecard data.

Connect to both Salesforce User/Employee and Timecard objects using Coefficient. Join data on Employee ID to link timecards with employee information like name, department, manager, and contact details.

Step 2. Calculate weekly hours per employee.

Create weekly hour calculations using SUMIFS formulas:. This aggregates individual timecard entries into meaningful weekly totals for each employee.

Step 3. Filter and format the employee list.

Apply filters where calculated hours are less than 40 and add color-coding for different hour ranges (0-20, 20-30, 30-39 hours). Group by manager for targeted follow-up and include all relevant employee details for HR workflows.

Step 4. Automate list maintenance.

Schedule weekly refresh to update employee status automatically. Set up alerts when specific employees consistently fall below thresholds and integrate with email notifications for proactive management.

Build actionable employee tracking systems

Start creatingThis approach creates a dynamic, actionable employee list that updates automatically and provides comprehensive insights beyond what Salesforce native reporting can deliver.your automated employee tracking lists today.

How to automatically export HubSpot contact records to Excel when deal stage changes

HubSpot workflows can’t create Excel files when deal stages change, but there’s a better approach that gives you live, automatically updating spreadsheets with your contact data.

Instead of trying to trigger one-time exports, you can set up a system that maintains real-time contact records and updates automatically in Excel whenever deal stages change.

Get live contact data that updates with deal stage changes using Coefficient

Rather than wrestling with workflow limitations, Coefficient’s 2-way sync between HubSpot and Excel connects your data directly to Excel with live sync capabilities. This means your contact records update automatically when deal stages change, without needing complex workflow triggers.

The key advantage is that you get a continuously updated spreadsheet instead of static exports. Your data stays current, and you can apply Excel’s full analytical power to your contact records and deal associations.

How to make it work

Feel free to read through the steps below or watch this quick tutorial on how to pull and sync HubSpot contact data to Excel. The video shows a walkthrough in Google Sheets, but you’ll experience the same setup process in Excel.

Now for our readers.

Step 1. Connect HubSpot to Excel and import contact records with deal associations.

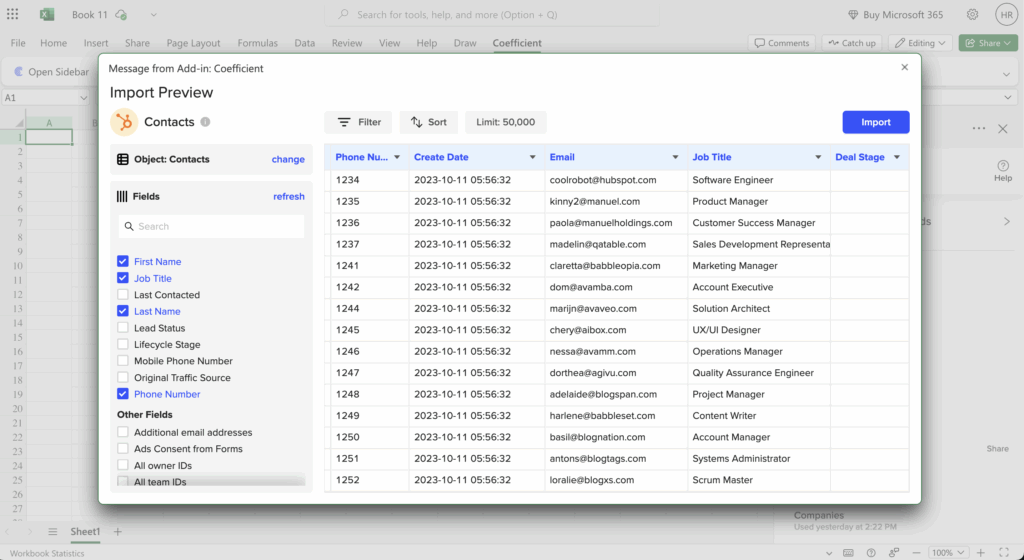
Open Excel and install Coefficient from the add-ins menu. Connect to HubSpot and create an import for contacts. Select “Row Expanded” display to show multiple deals per contact, giving you complete visibility into deal stage relationships.

automatically export hubspot contacts excel deal stage

Step 2. Apply dynamic filters for specific deal stages.

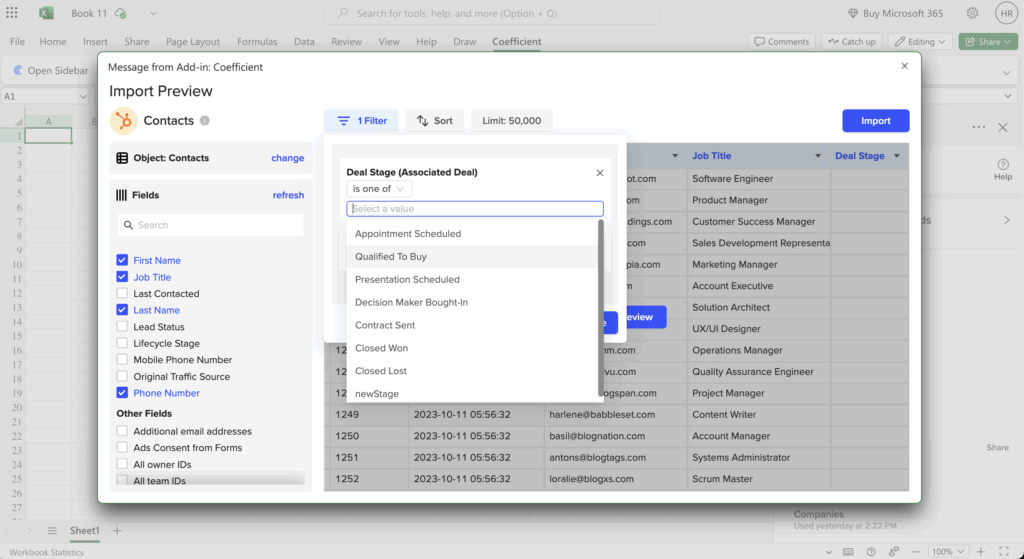
Use Coefficient’s filtering system to focus on contacts associated with deals in specific stages. You can set up to 25 filters with AND/OR logic, and even reference spreadsheet cells for flexible criteria that you can change without rebuilding the import.

apply dynamic filters to hubspot deal stages

Step 3. Schedule automatic refreshes to capture deal stage changes.

Set up hourly, daily, or weekly refreshes so your spreadsheet updates automatically when deal stages change in HubSpot. This eliminates the need for workflow triggers while ensuring your data stays current.

Schedule automatic excel refreshes to capture hubspot deal stage changes

Step 4. Set up alerts for stakeholders when new records appear.

Configure Slack or email notifications to alert your team when new contact records meet your deal stage criteria. This gives you the notification benefits of workflows without the complexity.

trigger alerts on mysql data to slack or email

Start syncing your contact data automatically

This approach gives you more reliable contact data exports than workflow-based solutions, with the added benefit of live updates and Excel’s analytical capabilities.to set up your automated contact exports today. Try Coefficient’s HubSpot connector for Excel today.

How to bulk export report folder permissions for all user profiles in Salesforce

Salesforce doesn’t provide a consolidated view for bulk report folder permissions export, forcing admins to manually navigate through Setup > Sharing Settings for each folder individually.

Here’s how to automate the entire process using custom SOQL queries that extract permission data directly into your spreadsheet.

Extract all report folder permissions automatically using Coefficient

Coefficientsolves this by leveraging custom SOQL queries to target permission objects like FolderShare, Report, and UserRole. This creates comprehensive permission matrices without the manual clicking through hundreds of user profiles.

How to make it work

Step 1. Connect to Salesforce and set up your permission query.

SalesforceIn Coefficient, choose “Custom SOQL Query” and connect to yourorg. Use this query to get folder-level permissions:

Step 2. Add user and profile details with a second query.

Create another import to get user information:. This lets you cross-reference permission assignments with actual user details and profile assignments.

Step 3. Build your permission matrix using spreadsheet formulas.

Use VLOOKUP formulas (auto-filled by Coefficient) to match UserOrGroupId from the permissions data with actual user names and profiles. Apply conditional formatting to visualize different access levels like Read, Edit, and Manage.

Step 4. Schedule automated refreshes for ongoing monitoring.

Set up hourly, daily, or weekly refresh schedules to maintain current permission data. Add Slack or email alerts to notify you when permission changes occur across your report folders.

Get centralized permission auditing that updates automatically

Start buildingThis approach eliminates manual permission checking and provides a schedulable audit solution that maintains current data automatically.your automated permission matrix today.

How to bypass CloudAnswers authentication issues for automated report sending

CloudAnswers authentication issues are blocking your automated report distribution, causing missed deadlines and frustrated partners who depend on consistent data delivery.

Here’s how to completely bypass CloudAnswers authentication bottlenecks by establishing an independent connection pathway that avoids the problems affecting CloudAnswers entirely.

Establish independent authentication pathway using Coefficient

CoefficientSalesforcecompletely bypasses CloudAnswers authentication issues by establishing an entirely separate connection pathway tothat avoids the authentication bottlenecks affecting CloudAnswers. This approach provides immediate relief while delivering equivalent or superior automated reporting capabilities.

While CloudAnswers struggles with profile-based authentication in MFA environments, Coefficient uses OAuth2 API authentication that operates independently of user profile permissions, eliminating the root cause of CloudAnswers’ failures.

How to make it work

Step 1. Set up alternative authentication method.

SalesforceConnect Coefficient tousing OAuth2 API authentication that operates independently of the user session dependencies causing CloudAnswers authentication timeouts and permission conflicts. This provides stable connections with automatic reauthorization to prevent authentication timeouts.

Step 2. Migrate your CloudAnswers reports.

Inventory all reports currently automated through CloudAnswers, then use Coefficient’s “From Existing Report” feature to recreate CloudAnswers functionality. Import any standard or custom object data that your automated workflows require.

Step 3. Configure equivalent scheduling and distribution.

Set up daily automation matching current CloudAnswers timing using Coefficient’s built-in scheduling engine. Configure automated email alerts to send reports directly to partners without relying on CloudAnswers’ problematic distribution system, with multiple trigger options including scheduled times, new data, or value changes.

Step 4. Test and transition safely.

Verify email alerts reach intended recipients and test partner distribution workflows. Run both systems briefly in parallel to ensure continuity before CloudAnswers decommission, maintaining business operations during the transition period.

Eliminate authentication problems permanently

Bypass these authentication issuesThis approach provides immediate relief from CloudAnswers authentication problems while delivering superior automated reporting capabilities that maintain organizational security requirements.and establish reliable automated reporting that works consistently.