How to eliminate manual data entry when creating custom variance reports from QuickBooks Online

Manual data entry from QuickBooks Online into spreadsheets for variance reporting creates multiple pain points: human errors, time consumption, version control issues, and delayed insights. You spend hours each reporting period copying and pasting data that’s outdated before you finish.

Here’s how to completely eliminate this manual process through automated data synchronization that runs itself.

Eliminate manual processes completely using Coefficient

Coefficient completely eliminates this manual process through automated data synchronization. You set up your data connections once, and your variance reports update themselves with current QuickBooks and QuickBooks data on whatever schedule you choose.

How to make it work

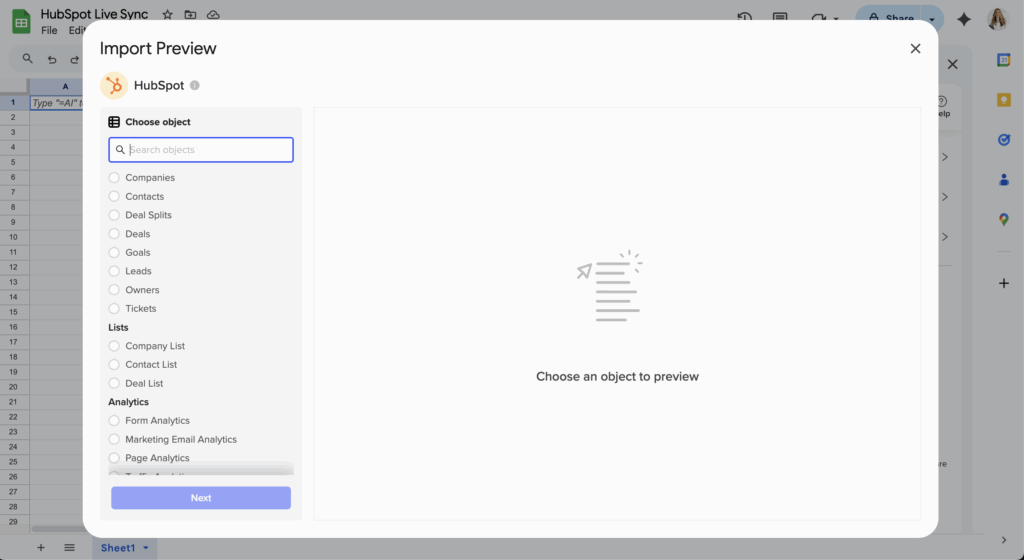
Step 1. Replace export/import workflows entirely.

Instead of exporting QuickBooks reports, opening in Excel, copying data, and pasting into templates, you click “Import from QuickBooks,” select your reports, and data flows directly to designated cells. No manual copying, no file management, no version control issues.

Step 2. Automate multi-report consolidation.

Set up one-time imports for all needed reports – P&L with budget columns, prior period comparisons, department/class breakdowns, and customer and vendor summaries. Each report maintains its own refresh schedule, so financial statements can update daily while aging reports update weekly.

Step 3. Eliminate rekeying for variance calculations.

Your formulas reference live QuickBooks data cells, so variance calculations update automatically. No manual entry of budget vs actual differences, period comparisons calculate without user intervention, and conditional formatting highlights significant variances automatically.

Step 4. Schedule unattended updates.

Set daily refreshes at 7 AM for P&L and Balance Sheet, weekly Monday updates for AR/AP aging reports, and monthly refreshes on the 1st for budget vs actual comparisons. Your reports update themselves while you sleep.

Step 5. Prevent data entry errors completely.

No transposition errors from manual copying, no missed negative signs or decimal places, consistent data formatting maintained automatically, and complete audit trail of all data sources. Your reports are always accurate and current.

Transform hours of manual work into automated accuracy

The transformation is dramatic: what previously required hours of error-prone manual work each reporting period now happens automatically, with 100% accuracy and zero manual data entry. Your variance reports are always current and accurate. Start eliminating manual data entry today.

How to eliminate manual HubSpot exports for weekly sales reporting

Manual weekly exports from HubSpot waste hours of valuable time and introduce data lag into your sales reporting. Every week, the same routine: export, format, calculate, and distribute reports that are already outdated.

Here’s how to completely eliminate this manual process and create reports that update automatically.

Replace all manual exports with automated intelligence using Coefficient

Coefficient completely eliminates manual weekly exports through intelligent automation that keeps your reports continuously updated with live HubSpot data, transforming weekly reporting from a manual chore into an automated intelligence system .

How to make it work

Step 1. Set up your one-time connection to replace all exports.

Link HubSpot to your spreadsheet through Coefficient’s secure connection. Import deals data, activity data (calls, emails, meetings), and contact/company data for complete reporting context. This replaces all future manual exports with a live data pipeline.

Step 2. Configure smart scheduling for weekly reporting cycles.

Set up Monday 7 AM full pipeline refresh before weekly meetings, daily 8 AM incremental updates for standups, Friday 4 PM end-of-week snapshots for weekend planning, and on-demand refreshes via button clicks when needed.

Step 3. Build automated report generation.

Create formulas for week-over-week comparisons that calculate automatically, rep performance scorecards that update in real-time, pipeline movement reports that highlight advancing or stalling deals, and activity tracking with call/email metrics flowing directly into reports.

Step 4. Implement historical tracking with automated snapshots.

Configure Coefficient Snapshots to capture weekly point-in-time data, enable automatic trend analysis across weeks, and track forecast accuracy without manual record-keeping. This builds historical context impossible with manual exports.

Step 5. Set up intelligent notifications.

Configure Slack alerts when reports are updated, email notifications for significant changes, and warnings when metrics fall below thresholds. Your team stays informed without manual monitoring.

Step 6. Calculate your time savings.

Eliminate 2-3 hours weekly of manual exports and formatting, remove data entry errors from copy-paste processes, and provide real-time data instead of stale weekly exports. This time goes back to selling activities.

Transform reporting from manual chore to automated intelligence

Automated reporting eliminates manual work while providing better insights and real-time data instead of stale weekly exports. Your team can focus on selling instead of data management, and your reports are always current. Start automating your HubSpot reporting today.

How to export activity engagement metrics and response rates alongside activity data

HubSpot captures valuable engagement data like email opens, clicks, and call outcomes, but accessing this information alongside your activity data for comprehensive analysis requires more than the standard export tools provide.

Here’s how to export complete activity datasets that include all available engagement metrics and response tracking.

Export comprehensive engagement data using Coefficient

Coefficient’s flexible field selection gives you access to all available activity properties in HubSpot , including engagement metrics and custom tracking fields that native exports often miss.

How to make it work

Step 1. Set up Activities import with comprehensive field selection.

Connect to HubSpot and create an Activities import. During field selection, choose all standard activity fields plus any custom engagement tracking properties configured in your instance.

Step 2. Include email engagement metrics.

Select email-specific fields like “Email Opens,” “Email Clicks,” “Email Replies,” and “Email Status” to capture engagement data alongside your email activity records. These fields provide the response rate data you need for analysis.

Step 3. Add call disposition and outcome fields.

Include call-related engagement fields such as “Call Disposition,” “Call Outcome,” “Call Duration,” and any custom call tracking properties. This data helps calculate call response rates and success metrics.

Step 4. Pull associated contact context.

Add associated contact fields like “Email (Associated Contact)” and “Lifecycle Stage (Associated Contact)” to provide context for response rate calculations and engagement analysis.

Step 5. Create calculated response rate columns.

Use spreadsheet formulas to calculate custom response rates from your exported engagement data. For example, divide successful outcomes by total activities to determine response rates by activity type or time period.

Step 6. Schedule regular engagement data updates.

Set up automated refreshes to maintain current engagement metrics without manual export processes. This ensures your response rate analysis stays current with fresh activity data.

Analyze complete engagement performance

This comprehensive approach gives you access to all available engagement data for thorough response rate analysis and activity performance tracking. Start exporting your complete engagement metrics today.

How to export all historical activities from CRM when native export only shows last 90 days

HubSpot’s native export functionality caps activity data at 90 days, which severely limits your ability to analyze long-term trends, track historical performance, or create comprehensive reports that span months or years.

Here’s how to bypass this limitation and extract your complete activity history for thorough CRM analysis.

Export unlimited historical activities using Coefficient

Coefficient connects directly to HubSpot’s API, completely bypassing the 90-day export restriction. You can pull activity data from any date range, set up custom filters with advanced logic, and schedule regular imports to maintain both current and historical records.

How to make it work

Step 1. Connect HubSpot and create an Activities import.

Open your spreadsheet and launch Coefficient from the sidebar. Select HubSpot as your data source, then choose “Activities” as your import object. This gives you access to all activity types including calls, emails, meetings, and tasks.

Step 2. Set up custom date range filters.

In the filter section, add “Activity Date >= YYYY-MM-DD” where you specify your desired start date. For example, “Activity Date >= 2022-01-01” pulls all activities from January 1, 2022 forward. You can combine this with an end date filter using AND logic for specific time periods.

Step 3. Configure dynamic filtering for flexible date ranges.

Reference a spreadsheet cell in your filter criteria like “Activity Date >= A1” where cell A1 contains your start date. This lets you change the date range without rebuilding the entire import, making it easy to pull different historical periods as needed.

Step 4. Schedule regular imports and snapshots.

Set up automated refreshes (daily, weekly, or monthly) to capture new activities while maintaining your historical data. Enable snapshots to preserve historical records even as your main import updates with fresh data.

Access your complete activity history

With this approach, you’ll have unrestricted access to your CRM’s complete activity history, enabling comprehensive analysis and reporting that spans your entire business timeline. Start extracting your historical activity data today.

How to export all open invoices for a specific customer from NetSuite to Excel

Exporting open invoices for a specific customer from NetSuite to Excel doesn’t have to be a manual, repetitive task that leaves you with outdated data the moment you download it.

Here’s how to set up automated invoice exports that stay current and eliminate the need for constant manual CSV downloads.

Get live customer invoice data using Coefficient

Coefficient maintains a live connection to your NetSuite data, so your invoice reports update automatically without manual intervention. Unlike NetSuite’s standard export features that create static CSV files, Coefficient keeps your data current with scheduled refreshes.

How to make it work

Step 1. Connect NetSuite to your Excel workbook.

Install Coefficient and authenticate your NetSuite connection. Your NetSuite admin will need to complete the OAuth setup and RESTlet deployment for secure API access.

Step 2. Choose your import method based on your needs.

You have three main options: Records & Lists for custom filtering, Saved Search Import for existing searches, or SuiteQL Query for complex data extraction. Records & Lists works best for straightforward customer-specific filtering.

Step 3. Set up your customer and status filters.

Select “Transaction” records, then apply filters for “Entity” (your specific customer) and “Status” (Open/Pending Payment). Choose fields like Transaction ID, Amount, Due Date, and Amount Remaining.

Step 4. Configure automated refresh scheduling.

Set up daily, weekly, or hourly updates so your invoice data stays current. The refresh timing is based on your timezone, and you’ll get notifications when updates complete.

Step 5. For advanced filtering, use SuiteQL queries.

Create custom queries like: SELECT entity, tranid, amount, duedate FROM transaction WHERE type = ‘Invoice’ AND entity = ‘Customer Name’ AND status = ‘Open’. This gives you precise control over the data you extract.

Keep your invoice data current automatically

This approach eliminates manual CSV exports while providing more flexible filtering than standard NetSuite reports. Start automating your invoice exports today.

How to export deleted or archived activities that don’t appear in standard reports

While you can’t recover permanently deleted activities from HubSpot, there are ways to access archived data and prevent future data loss through proactive backup strategies.

Here’s what’s possible for accessing hidden activity data and how to protect against future deletions.

Access archived activities and prevent data loss using Coefficient

Coefficient can import activities associated with archived users and access records with non-standard statuses that native HubSpot exports might filter out, though permanently deleted activities remain inaccessible.

How to make it work

Step 1. Import activities from archived users.

Create an Activities import that includes activities associated with archived users. These activities often don’t appear in standard HubSpot reports but remain accessible through the API connection.

Step 2. Use comprehensive filtering to capture inactive records.

Apply broad filters that might reveal “soft-deleted” or inactive activities. Remove restrictive status filters and include all activity types to capture records that might be marked as inactive rather than permanently deleted.

Step 3. Set up proactive snapshot scheduling.

Configure daily or weekly snapshots of your activity data as a backup strategy. This preserves complete historical records before any deletion occurs, creating your own archive of activity data.

Step 4. Create deletion prevention workflows.

Set up alerts for activity changes that might indicate impending deletion. Consider implementing workflows that archive rather than delete activities to maintain data integrity.

Step 5. Configure comprehensive field selection.

Include all available activity fields, including status and modification fields that might indicate deleted or archived states. This helps identify activities that exist but don’t appear in standard reports.

Protect your activity data going forward

While truly deleted activities can’t be recovered, this proactive approach helps you access archived data and prevent future data loss through regular backups and comprehensive data capture. Start protecting your activity data today.

How to export Financial Reports Row Layout Assignment data when NetSuite Saved Search doesn’t show the dataset

NetSuite saved searches often fail to display Financial Reports Row Layout Assignment data because this configuration information lives in system tables that aren’t exposed through standard search functionality.

Here’s how to access this critical data using direct table queries and automated export methods that bypass NetSuite’s built-in limitations.

Access row layout data directly using Coefficient

Coefficient provides direct access to NetSuite system tables through SuiteQL queries, eliminating the need for complex workarounds or custom development. Instead of struggling with saved search limitations, you can query the actual tables where row layout assignments are stored.

How to make it work

Step 1. Connect Coefficient to your NetSuite instance.

Install the Coefficient add-on in Excel or Google Sheets. Your NetSuite admin will need to configure OAuth 2.0 authentication and deploy the RESTlet script for secure API access.

Step 2. Select SuiteQL Query as your import method.

Open Coefficient and choose “SuiteQL Query” from the import options. This method allows you to write custom SQL-like queries that access NetSuite’s underlying database tables directly.

Step 3. Write your row layout extraction query.

Use this query to extract comprehensive row layout data:

Step 4. Preview and import your data.

Click “Preview” to see the first 50 rows of results. Once you verify the data looks correct, import it directly into your spreadsheet. You can process up to 100,000 rows per query.

Step 5. Set up automated refreshes.

Schedule daily or weekly refreshes to keep your row layout data current. Coefficient will automatically re-authenticate and pull fresh data according to your schedule.

Get complete financial report configuration data

This approach gives you access to all row layout fields including formulas, hierarchies, and print orders that saved searches simply can’t reach. Start extracting your NetSuite row layout data today.

How to export HubSpot data with custom formatting using report filters

HubSpot’s native export functionality gives you basic CSV files with minimal formatting options and restricted filtering capabilities that fall short of professional reporting needs.

Here’s how to create sophisticated, formatted exports with advanced filtering that transforms your HubSpot data into presentation-ready reports.

Transform HubSpot exports with advanced formatting using Coefficient

Coefficient completely transforms your HubSpot export capabilities by connecting your CRM data to spreadsheets where you can apply professional formatting, create complex filters, and build automated reporting workflows. Instead of basic CSV dumps, you’ll get formatted reports that update automatically and can be shared with stakeholders immediately.

How to make it work

Step 1. Set up sophisticated filtering beyond HubSpot’s report limitations.

Apply up to 25 filters with complex AND/OR logic that HubSpot’s native reports can’t handle. Create dynamic filters that reference spreadsheet cells, allowing you to change criteria without rebuilding the entire export. Filter across associated objects seamlessly—something that requires multiple exports in HubSpot .

Step 2. Apply custom formatting in your spreadsheet environment.

Use conditional formatting based on HubSpot data values to highlight important records. Create pivot tables and charts that aren’t available in HubSpot’s reporting suite. Format dates, currencies, and numbers to your exact specifications. Merge data from multiple HubSpot objects into single, formatted reports.

Step 3. Build automated export workflows with scheduling.

Schedule exports to run automatically—hourly, daily, or weekly—so your formatted reports stay current without manual intervention. Create snapshots to preserve formatted reports over time for historical analysis. Set up email or Slack alerts with formatted data attachments for key stakeholders.

Step 4. Create advanced reports with live HubSpot data.

Use the =HUBSPOT_SEARCH formula for complex queries with custom field selection that mirrors API functionality but requires no coding. Combine HubSpot data with other business systems in one formatted report. Build executive dashboards with custom KPIs that update automatically with live data.

Step 5. Export with formatting tricks unavailable in HubSpot.

Export associated records in expanded rows or comma-separated format for better readability. Include hyperlinked Object IDs for quick navigation back to HubSpot records. Create multi-tab reports with different data views for various stakeholders, all formatted professionally.

Create professional reports that impress stakeholders

This approach eliminates the need for manual data manipulation after export and provides professional-grade reporting capabilities that HubSpot’s native tools simply can’t match. Your reports will look polished and update automatically. Start creating formatted exports that save hours of manual work.

How to export HubSpot sequence and campaign data for combined reporting analysis

Exporting HubSpot sequence and campaign data for combined analysis typically requires multiple manual exports and complex data manipulation. There’s a better way that streamlines this entire process with live data connections and automated imports into Google Sheets or Excel.

It’s exactly how you can eliminate manual exports and get continuous access to live data for sophisticated analysis that updates automatically.

Automate sequence and campaign data imports using Coefficient

Coefficient‘s 2-way sync between HubSoot and Google Sheets or Excel eliminates the need for traditional exports that require tons of clicks and repeats by creating automated data imports and live connections. You get continuous access to fresh data without the manual export hassle, plus advanced analysis capabilities that static exports can’t provide.

Here’s a quick walkthrough of how it works.

How to make it work

Step 1. Configure automated sequence imports.

Select all sequence fields including name, enrollment, replies, opens, and clicks from HubSpot. Include associated contact IDs and properties, apply date filters for relevant time periods, and enable automatic refresh (hourly or daily) to keep data current.

export hubspot sequence and campaign data

Step 2. Set up campaign data imports.

Import campaign associations with contact IDs, include first touch and last touch attribution, pull campaign influence data and revenue attribution, and set matching refresh schedules to ensure data synchronization.

Step 3. Combine data using advanced techniques.

Use XLOOKUP or INDEX/MATCH to join sequence and campaign data via contact IDs, create master tables that combine metrics from both sources, build calculated columns for cross-source metrics like sequence ROI by campaign, and implement data validation to ensure data integrity. Need help with your formulas? Leverage Coefficient’s AI Sheets Assistant.

Step 4. Build comprehensive analysis capabilities.

Create performance correlation analysis to identify which campaigns drive the best sequence engagement, build attribution modeling combining both touchpoints, perform segmentation analysis of sequence performance by campaign-driven segments, and identify trends in how different campaigns affect sequence outcomes.

Step 5. Enable flexible export and sharing options.

Keep data live in spreadsheets for collaborative analysis, schedule automated data pushes back to HubSpot or your data warehouse, create PDF reports for executive distribution, and build API connections for custom dashboard tools.

Get continuous live data without manual exports

This approach provides continuous access to live sequence and campaign data without manual export processes, enabling sophisticated analysis that updates automatically. Start building your automated data analysis system today with Coefficient.

Get Started Free with Coefficient for HubSpot

How to export invoice line items with product details to Excel weekly

You can export detailed invoice line items from NetSuite to Excel weekly with automated scheduling that captures individual product details, not just summary totals.

This guide shows you how to set up weekly exports that pull granular transaction data including SKUs, quantities, rates, and amounts for each line item.

Get detailed invoice line items automatically using Coefficient

Coefficient connects directly to NetSuite to access Transaction Line records, which contain individual invoice line items rather than summary invoice data. Unlike NetSuite’s native export functionality that typically provides only invoice totals, this approach captures each product line as separate rows with complete details.

How to make it work

Step 1. Connect to NetSuite and select Transaction Line records.

Use the Records & Lists import method to access Transaction Line records. This gives you granular access to individual invoice line items instead of summary-level invoice data that NetSuite typically exports.

Step 2. Choose your specific fields for product details.

Select fields like Item Name, SKU, Quantity, Rate, Amount, Invoice Number, Customer, and Date. You can also include custom fields from both invoice headers and line items for complete product information.

Step 3. Apply filters to focus on relevant invoices.

Use date range filters to capture invoices from specific periods. You can also filter by customers or other criteria using AND/OR logic to narrow down your data set.

Step 4. Set up weekly automated scheduling.

Configure automatic data refresh on a weekly schedule through the scheduling feature. Choose your preferred day and time, and the system will handle timezone-based scheduling automatically.

Step 5. Review your structured output.

Each product line appears as individual Excel rows with complete product details. The data stays current with automatic refresh capabilities, eliminating manual export requirements.

Start automating your weekly invoice exports

Weekly invoice line item exports give you consistent access to detailed product data without manual intervention. Get started with automated NetSuite exports today.