Download inventory replenishment by transfer order transaction data to Excel

Downloading transfer order transaction data for replenishment analysis shouldn’t require multiple steps and file conversions. You can pull this data directly into Excel with all the fields and formatting you need.

This guide shows you how to create a direct connection that downloads comprehensive transfer order data while maintaining proper data types and enabling advanced analysis.

Download transfer order data directly to Excel using Coefficient

Coefficient streamlines the download process by connecting NetSuite transfer orders directly to Excel. No CSV files, no data type conversion issues, and no manual formatting required.

How to make it work

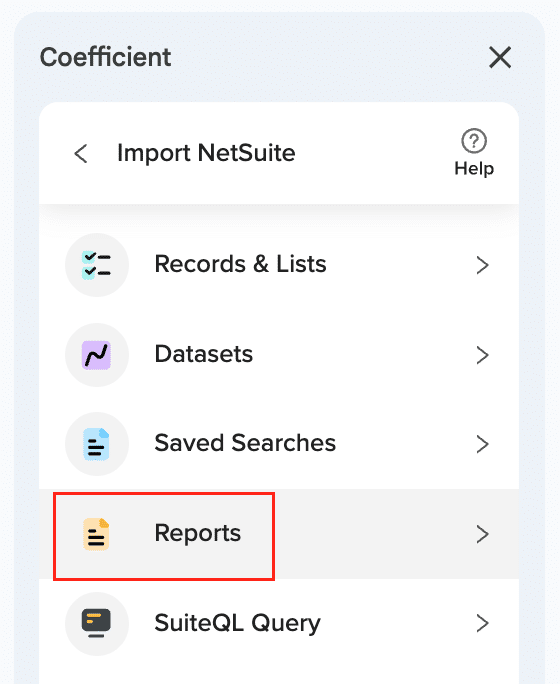
Step 1. Access transfer order transactions.

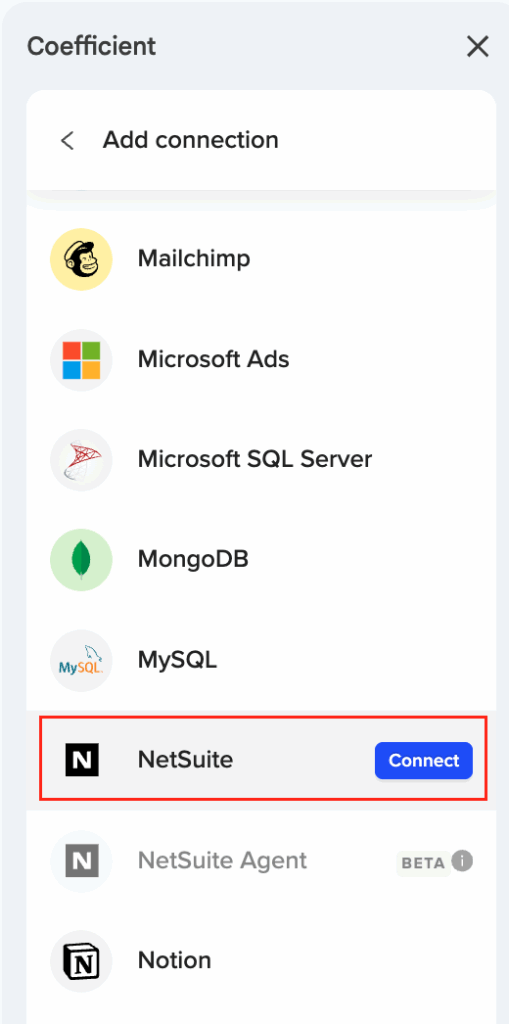
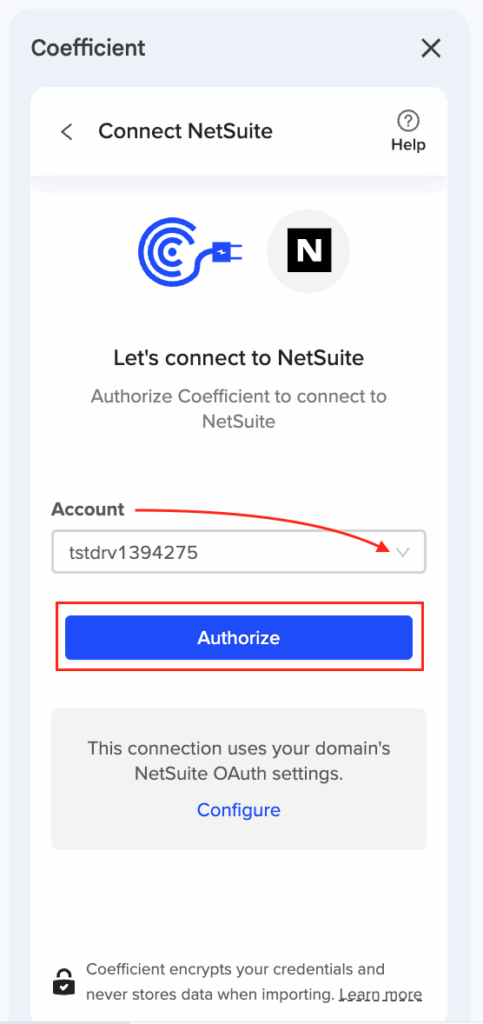
Open Coefficient in Excel and select “Import from NetSuite” → “Records & Lists” → “Transfer Order”. This gives you direct access to all transfer order transaction data.

Step 2. Configure replenishment data fields.

Select essential fields like item details, SKU, quantities, location information, expected receipt dates, and transfer order status. Include any custom fields specific to your replenishment process.

Step 3. Apply filters for replenishment analysis.

Filter by transaction status like “Pending Receipt”, set date ranges for your planning horizon, and specify locations or item categories that require replenishment tracking.

Step 4. Enhance with related data.

Use SuiteQL queries to combine transfer orders with current inventory levels, reorder points, and lead time information. This creates a comprehensive dataset for replenishment decisions.

Get comprehensive replenishment data in Excel

Direct downloads preserve data integrity and enable immediate analysis without manual formatting. Your transfer order data becomes a dynamic foundation for inventory management decisions that updates automatically. Download your data directly from NetSuite today.

Excel external data connection NetSuite permission requirements

NetSuite permission requirements for Excel external data connections are complex and often misconfigured, leading to authentication failures and data access issues.

Here’s how to configure specific permissions correctly through a clear OAuth setup process that eliminates common permission-related connection failures.

Configure NetSuite permissions properly using Coefficient

Coefficient requires specific permissions that are clearly defined and properly managed through the OAuth setup process for NetSuite . SuiteAnalytics Workbook permissions are essential for data access and reporting capabilities.

How to make it work

Step 1. Set up required NetSuite permissions.

Configure SuiteAnalytics Workbook permissions and REST Web Services access for API communication. Create custom roles with specific permissions for OAuth 2.0 authentication support.

Step 2. Deploy RESTlet scripts with proper permissions.

Handle company-wide RESTlet script deployment with proper role-based permissions. Configure department and subsidiary access controls for data scope and security boundaries.

Step 3. Configure OAuth authentication securely.

Complete one-time OAuth setup with proper role assignment and external URL configuration for secure API communication. Use company domain emails only (Gmail not supported).

Step 4. Manage token refresh automatically.

Handle automatic 7-day token renewal with proper permissions while providing clear troubleshooting guidance for common permission issues.

Clear permissions eliminate connection failures

This provides clear permission documentation and eliminates the trial-and-error process common with other NetSuite Excel integration attempts. Configure your NetSuite permissions correctly for reliable Excel connections.

Excel formatting destroyed when refreshing NetSuite data connection

Excel’s native NetSuite connections destroy your formatting because they rebuild the entire data range instead of updating existing cells. This wipes out your conditional formatting, column widths, and custom number formats every single time.

Here’s how to keep your Excel formatting intact while still getting fresh NetSuite data automatically.

Preserve Excel formatting during NetSuite refreshes using Coefficient

Coefficient solves this problem with smart refresh technology that updates only the data values while keeping all your Excel formatting exactly as you set it. No more rebuilding your reports after every refresh.

The key difference is how Coefficient handles data updates. Instead of deleting and recreating your data range, it updates individual cell values. This means your conditional formatting rules, custom number formats, column widths, and table styles stay put.

How to make it work

Step 1. Connect NetSuite to Excel through Coefficient.

Install Coefficient from the Excel add-ins store and authenticate with your NetSuite account. Your NetSuite admin will need to configure OAuth access, but this is a one-time setup.

Step 2. Import your NetSuite data using Coefficient’s sidebar.

Choose from Records & Lists, Saved Searches, or SuiteQL Query depending on what data you need. You can preview the first 50 rows and select exactly which fields to import.

Step 3. Apply your Excel formatting after the data imports.

Set up conditional formatting rules, adjust column widths, apply custom number formats, and style your data exactly how you want it. This is the last time you’ll need to do this formatting work.

Step 4. Set up automatic refreshes or use manual refresh.

Configure hourly, daily, or weekly refresh schedules through Coefficient’s sidebar. You can also use the manual refresh button whenever you need updated data. Your formatting will remain intact through every refresh.

Keep your NetSuite reports looking professional

Stop wasting time reformatting your Excel reports after every data update. Coefficient’s intelligent refresh system preserves all your formatting work while keeping your data current. Try Coefficient and see how much time you save on report maintenance.

Excel formulas to pull NetSuite trial balance data without manual exports

Manual trial balance exports from NetSuite break your Excel formulas and create version control nightmares. Dynamic formula connections let you reference live NetSuite data without constant CSV downloads and formatting fixes.

You’ll learn how to create Excel formulas that pull trial balance data directly from NetSuite and update automatically as your accounting periods close.

Create formulas that reference live NetSuite trial balance data

Coefficient enables Excel formulas to dynamically reference NetSuite trial balance data through live connections. The platform creates a live data table in Excel that your formulas can reference without manual exports.

How to make it work


Note: 
Before getting started, Install Coefficient and authenticate with your NetSuite account using OAuth. Your NetSuite admin will need to deploy the RESTlet script and configure external URL settings for secure API access.

Step 1. Import trial balance data using the Reports method.

Select “Trial Balance” from NetSuite report options and configure your reporting period, accounting book, and subsidiary. The import creates a structured Excel table that serves as the foundation for your formula-based reporting.

Step 2. Build dynamic formulas using structured table references.

Use XLOOKUP to pull specific account balances: =XLOOKUP(A2,TrialBalance[Account],TrialBalance[Balance]). Create account groupings with SUMIFS: =SUMIFS(TrialBalance[Balance],TrialBalance[Account],”>=1000″,TrialBalance[Account],”<2000″). These formulas automatically update when the underlying data refreshes.

Step 3. Set up advanced analysis formulas for variance and reconciliation.

Build variance analysis with =IFERROR((Current[Balance]-Prior[Balance])/Prior[Balance],0) for percentage changes. Create reconciliation checks using =IF(XLOOKUP(A2,TrialBalance[Account],TrialBalance[Balance])=B2,”Balanced”,”Review”) to flag discrepancies automatically.

Step 4. Configure refresh schedules aligned with your close process.

Set daily auto-refresh during month-end close periods and weekly refresh during interim periods. Your formulas always reference current NetSuite data without manual intervention or copy-paste operations.

Build formulas that work with live data

Formula-based trial balance connections eliminate manual exports while maintaining calculation transparency and audit trails in your Excel workbooks. Start building your dynamic trial balance formulas today.

Excel named ranges disappearing after NetSuite data refresh

Named ranges disappear after NetSuite data refresh because Excel’s native connections recreate the entire data range, breaking the cell references that named ranges depend on. This destroys complex financial models and dashboards that use named ranges for formula clarity.

Here’s how to preserve your named ranges through NetSuite data refreshes.

Keep named ranges stable during NetSuite refreshes

The problem occurs because Excel deletes and recreates cells during external data refresh. Named range definitions pointing to deleted cells become #REF! errors, dynamic named ranges using OFFSET or INDEX functions lose their anchor points, and scope conflicts arise when names collide.

Coefficient maintains all named ranges through its cell-update refresh approach. It updates data values without changing cell addresses, preserves complex dynamic named ranges using OFFSET, INDEX, or Table references, and maintains both worksheet-level and workbook-level named ranges.

How to make it work

Step 1. Import NetSuite data using Coefficient’s sidebar tools.

Choose Records & Lists for customer data, financial records, or any NetSuite information. You can also use Saved Searches or SuiteQL Query depending on your data needs.

Step 2. Create named ranges for key data areas after import.

Define named ranges like “Revenue_Data” for your revenue figures or “Customer_List” for customer information. Include both simple ranges and dynamic ranges using OFFSET or INDEX functions if needed.

Step 3. Build formulas and charts referencing these named ranges.

Use your named ranges in formulas throughout your workbook. Create charts that reference named ranges, build summary calculations, or set up complex financial models that depend on these stable references.

Step 4. Schedule automatic refreshes with confidence.

Set up hourly, daily, or weekly refresh schedules knowing all named range references remain intact. Your formulas and charts will continue working correctly with updated NetSuite data.

Build stable financial models with NetSuite data

Stop recreating named ranges after every NetSuite refresh. Coefficient’s reference-stable refresh system preserves all your named ranges and dependent formulas while keeping data current. Start building reliable financial models with Coefficient.

Excel NetSuite integration automatic refresh scheduled reports

Native Excel connections can’t handle NetSuite’s authentication requirements, making automatic refresh impossible for financial reports without constant manual intervention.

Here’s how to set up reliable automatic refresh for your NetSuite reports in Excel with flexible scheduling options.

Schedule automatic NetSuite report updates using Coefficient

Coefficient provides comprehensive automatic refresh capabilities for NetSuite financial reports. The scheduling system offers hourly refresh for critical data, daily refresh for standard workflows, and weekly refresh for periodic analysis.

How to make it work

Step 1. Import your NetSuite financial report.

Use Coefficient’s Reports method to import your desired financial report (Income Statement, Trial Balance, etc.) or import existing Saved Searches with all criteria preserved.

Step 2. Configure automatic refresh scheduling.

After importing, access the scheduling interface and choose your refresh frequency. Set timezone-based scheduling to align with your business hours.

Step 3. Set up manual refresh options.

Add on-sheet refresh buttons for immediate updates outside scheduled times. This gives you on-demand access when you need current data quickly.

Step 4. Let the system handle authentication.

Coefficient automatically manages NetSuite’s 7-day token refresh requirement, eliminating authentication failures that break other Excel integration approaches.

Reliable data without the technical complexity

This eliminates complex ODBC configurations and custom API programming that typically fails with NetSuite’s security model. Start scheduling your automatic NetSuite report updates in Excel today.

Excel ODBC connection to NetSuite financial reports configuration

ODBC connections to NetSuite financial reports require complex driver installation, authentication setup, and often fail due to NetSuite’s security model limitations.

Here’s how to eliminate these technical barriers and get direct financial report access without ODBC drivers or connection string configuration.

Access NetSuite financial reports without ODBC using Coefficient

Coefficient eliminates technical barriers by providing direct financial report access from NetSuite without ODBC drivers. The Reports import method offers direct access to Income Statement, Trial Balance, and General Ledger data.

How to make it work

<notepad> Plan: 1. The current steps are vague and incorrectly refer to the product as “OAuth 2.0” instead of Coefficient 2. Need to completely rewrite the step-by-step to be more specific and actionable 3. Add clear installation as Step 1 4. Make steps more concrete with actual actions users take 5. Add [IMAGE PLACEHOLDER] tags for 2-3 key steps 6. Keep intro and conclusion sections unchanged per instructions

Current steps are too abstract:

  • “Skip driver installation entirely” – not actionable
  • “Import financial reports directly” – needs specifics
  • “Configure automatic authentication” – confusing OAuth reference
  • “Set up optimized performance” – not a user action

New steps should be:

  1. Install Coefficient in Excel (with image)
  2. Connect your NetSuite account (with image)
  3. Select your financial report type (with image)
  4. Configure report parameters
  5. Set up automatic refresh schedules </notepad>

<updated_content>

Excel ODBC connection to NetSuite financial reports configuration

ODBC connections to NetSuite financial reports require complex driver installation, authentication setup, and often fail due to NetSuite’s security model limitations.

Here’s how to eliminate these technical barriers and get direct financial report access without ODBC drivers or connection string configuration.

Access NetSuite financial reports without ODBC using Coefficient

Coefficient eliminates technical barriers by providing direct financial report access from NetSuite without ODBC drivers. The Reports import method offers direct access to Income Statement, Trial Balance, and General Ledger data.

How to make it work

Step 1. Install Coefficient in Excel.

Open Excel and navigate to Insert > Get Add-ins. Search for “Coefficient” and click Add to install the add-in. Launch Coefficient from the Add-ins ribbon once installation completes.

Step 2. Connect your NetSuite account.

Click “Connect to NetSuite” in the Coefficient sidebar. Your NetSuite admin will need to complete a one-time OAuth setup by deploying the RESTlet script and configuring external URL settings. This replaces ODBC driver installation and DSN configuration.

Step 3. Select your financial report type.

Choose from Income Statement, Trial Balance, General Ledger, or Comparative Income Statement. Each report type maintains NetSuite’s native structure and calculation logic without manual configuration.

Step 4. Configure report parameters.

Set your reporting periods, select the accounting book, choose view mode preferences, and apply subsidiary or department filters as needed. Preview the first 50 rows to verify your data before importing.

Step 5. Set up automatic refresh schedules.

Configure hourly, daily, or weekly refresh schedules to keep financial data current. Coefficient handles NetSuite’s 7-day token refresh automatically, maintaining continuous access without manual re-authentication.

Better performance without technical overhead

This provides enhanced functionality with configurable reporting periods and subsidiary selection without the technical complexity of ODBC driver management. Start importing NetSuite financial reports directly into Excel.

Excel pivot table formatting reset when updating NetSuite source data

Pivot table formatting resets during NetSuite source data updates because Excel’s refresh mechanism rebuilds the underlying data range, causing pivot tables to lose custom formatting, calculated fields, and layout preferences. This forces manual reformatting after every data refresh.

Here’s how to keep your pivot table formatting intact while updating NetSuite source data.

Preserve pivot table formatting with stable NetSuite data sources

The formatting reset happens because pivot tables lose their connection stability when source data ranges get rebuilt. Value field number formats revert to General, custom subtotal and grand total formatting disappears, conditional formatting rules within pivot tables vanish, and calculated fields require recreation.

Coefficient preserves pivot table formatting by maintaining stable source data ranges. It updates NetSuite data without changing the pivot table’s source reference, maintains all number formats in value areas, conditional formatting rules, custom styles and themes, and report layouts. It also protects calculated fields and custom measures.

How to make it work

Step 1. Import NetSuite data using Coefficient as your pivot table source.

Use Records & Lists for Income Statement data, Trial Balance information, or any custom records. You can also import Saved Searches that contain the financial data you need for analysis.

Step 2. Create pivot tables referencing the Coefficient data range.

Build your pivot tables using the imported NetSuite data as the source. The data range will remain stable through refreshes, maintaining the pivot table’s source reference integrity.

Step 3. Apply complex formatting, slicers, and timeline controls.

Set up number formats for value fields, apply conditional formatting rules, add custom styles and themes, configure report layouts, and create calculated fields. Also add slicers and timeline controls for interactive analysis.

Step 4. Schedule automatic refreshes without formatting loss.

Set up hourly, daily, or weekly refresh schedules. Your pivot tables will update with new NetSuite data while preserving all formatting, calculated fields, and interactive elements.

Build formatted pivot tables that stay formatted

Stop reformatting pivot tables after every NetSuite data update. Coefficient’s stable data source approach preserves all your pivot table formatting and calculated fields while keeping data current. Start using Coefficient for reliable pivot table refreshes.

Excel pivot table not refreshing with NetSuite ODBC connection after ERP migration

Post-migration refresh failures with NetSuite ODBC connections are frustratingly common. Connection strings reference old endpoints, authentication tokens become invalid, and field mappings change between ERP systems, breaking your existing pivot table workflows.

Here’s how to establish reliable NetSuite data connections that maintain consistent refresh capabilities after migration, plus automated scheduling that works without manual intervention.

Build migration-friendly pivot tables with Coefficient

Instead of troubleshooting ODBC connection issues after migration, NetSuite users can establish purpose-built Excel connections that handle migration scenarios gracefully. Coefficient’s OAuth authentication auto-renews and doesn’t rely on server endpoints that change during migrations.

The key advantage is automated refresh scheduling that runs in the cloud, so your pivot tables stay current even when connection details change.

How to make it work

Step 1. Install Coefficient and connect to your new NetSuite instance.

Add Coefficient from Excel’s add-in store and authenticate with your post-migration NetSuite credentials. OAuth handles authentication without connection strings.

Step 2. Import NetSuite data using Records & Lists or Saved Searches.

Select your data source and choose the fields you need for your pivot tables. Preview the data to ensure field mappings are correct after migration.

Step 3. Build pivot tables on Coefficient-imported data.

Create your pivot tables using the imported NetSuite data as the source. This ensures pivot tables refresh reliably when the underlying data updates.

Step 4. Set automated refresh schedule.

Click the schedule icon and set refresh frequency (daily at 6 AM works well for most reports). Pivot tables update automatically based on the refreshed data.

Eliminate post-migration refresh headaches

This approach provides more reliable refresh capabilities than traditional ODBC setups while handling migration scenarios without manual reconfiguration. Your pivot tables stay current with automated scheduling that doesn’t depend on local connections. Set up Coefficient to ensure your Excel pivot tables refresh reliably after NetSuite migration.

Excel pivot tables with live NetSuite GL transaction data

NetSuite’s pivot reporting capabilities pale in comparison to Excel’s analytical power. Live GL transaction data in Excel pivot tables combines real-time NetSuite information with superior analytical tools for comprehensive financial analysis.

Here’s how to create Excel pivot tables that connect directly to NetSuite GL data and refresh automatically for dynamic financial reporting and trend analysis.

Build pivot tables that update with live NetSuite GL data

Coefficient enables powerful Excel pivot table creation with live NetSuite GL transaction data. The platform combines Excel’s superior analytical capabilities with real-time NetSuite information for comprehensive financial analysis.

How to make it work

Step 1. Import comprehensive GL transaction data using Records & Lists.

Select Transaction records and include fields like Date, Account Number, Account Name, Debit, Credit, Department, Class, Location, Memo, and Transaction Type. Apply filters for Posting = True and your desired date range to focus on posted transactions only.

Step 2. Optimize data imports using SuiteQL for pivot-ready datasets.

Create custom queries that pre-structure data for pivot analysis: SELECT t.trandate, a.accountnumber, a.name as accountname, d.name as department, tl.netamount, tt.name as transactiontype FROM transactionline tl JOIN transaction t ON tl.transaction = t.id JOIN account a ON tl.account = a.id WHERE t.posting = ‘T’.

Step 3. Configure pivot tables for common financial analyses.

Build P&L by Department with Rows: Account Name, Columns: Department, Values: Sum of Net Amount. Create Monthly Trend Analysis using Rows: Account Number, Columns: Period Name, Values: Sum of Net Amount. Add calculated fields for Gross Margin % = (Revenue – COGS) / Revenue.

Step 4. Set up automated refresh schedules and advanced features.

Configure daily refresh during month-end close and weekly refresh for mid-month monitoring. Use slicers for instant department filtering, date timelines for period selection, and conditional formatting for variance highlighting in your pivot tables.

Transform GL data into powerful analytical insights

Live GL data in Excel pivot tables provides analytical capabilities that surpass NetSuite’s native pivot reporting while maintaining real-time data integrity. Create your live GL pivot tables today.