
Are you looking to track your lead to opportunity conversion rate using Google Sheets?
It’s not as complicated or as tedious as you might think.
In this guide, you’ll learn:
- What lead to opportunity conversion rate is
- Why you should track it
- How to track it in Google Sheets while pulling data automatically from Salesforce
- Frequently asked questions about lead to opportunity conversion rate
So if you want to get a better handle on your team’s lead conversion rates, you’ll need this guide.
Let’s get started.
Lead to opportunity conversion rate: What is it?
Before diving into the nitty-gritty of lead to opportunity conversion rates, let’s go over the important terms first.
Leads and opportunities can have distinct meanings to various companies, but these terms have general definitions.
Essentially, a lead is a sales prospect who is at the top of the sales funnel but has not yet been qualified and converted to an opportunity. These are the people who downloaded a whitepaper, signed up for your webinar, requested a demo, etc.
In Salesforce, leads undergo five stages: Unqualified, New, Working, Nurturing, and Converted.
Once a lead is converted, it then becomes an Opportunity.
When a lead becomes an opportunity, it has been through a qualification process where it meets the criteria to enter the pipeline. Opportunities can have stages such as Qualification, Need Analysis, Proposal, Negotiation, and Closed.
The goal is to quickly and effectively convert leads to opportunities that then become paying customers.
And so the question becomes, what is a lead to opportunity conversion rate?
In simple terms, it is the percentage of leads that convert to opportunities.
Determine the lead to opportunity conversion rate by dividing the number of leads converted to opportunities by the number of total leads.
For instance, if you had 100 leads and 20 of these leads converted to opportunities, your lead conversion rate would be:
20 / 100 = 20%
Monitoring opportunities in your sales data helps you assess and improve your company’s sales performance. It helps build your sales pipeline and contributes to your forecasting efforts.
Why track your lead to opportunity conversion rates?
Below are examples where tracking your lead to opportunity conversion rate can boost sales revenue.
- Opportunity qualification. Tracking your lead to opportunity conversion rate allows your sales team to “qualify out” leads with no real chances of converting. This prevents you from allocating resources (needlessly) to nurturing leads who will never convert down the line.
- Learn which lead nurturing strategies are working. Not all lead nurturing strategies are created equal. Some will bring you meaningful results, while others, not much. When you track your conversion rates, it tells you which among your lead nurturing initiatives are yielding meaningful results. This should prompt you to double down on what’s working and remove (or drastically improve) the failing ones.
- Learn and share. Monitoring the lead to opportunity conversion rate helps sales managers identify team members with high success rates. This allows managers to uncover best practices and strategies that sales teams can use as learning tools to generate higher conversions. The data can also be used to pinpoint who among your sales representatives ought to be rewarded to encourage them to perform even better.
- Manage customers better. Tracking the lead to opportunity conversion rate helps sales teams optimize the sales process by adjusting and balancing their efforts between new and existing clients.
- Identify funnel leakage. When there is an abrupt and huge dip from one stage of your sales pipeline to another, it means there’s an issue that you need to address. Studying your Leaking Funnel report and lead to opportunity conversion rate lets you uncover gaps in your sales pipeline and address them immediately.
Tracking lead to opportunity conversion rates in Google Sheets
In our example below, we will use Salesforce as our data source for generating the leads to opportunity conversion rate in Google Sheets.
We will create a report in Salesforce that shows your leads and the number of leads that converted to opportunities.
To create the report, navigate to the “Reports” tab. Click “New Report” and choose “Leads.” Depending on what you need, you can either choose among “Leads,” “Leads with converted lead information,” or “Lead history.”
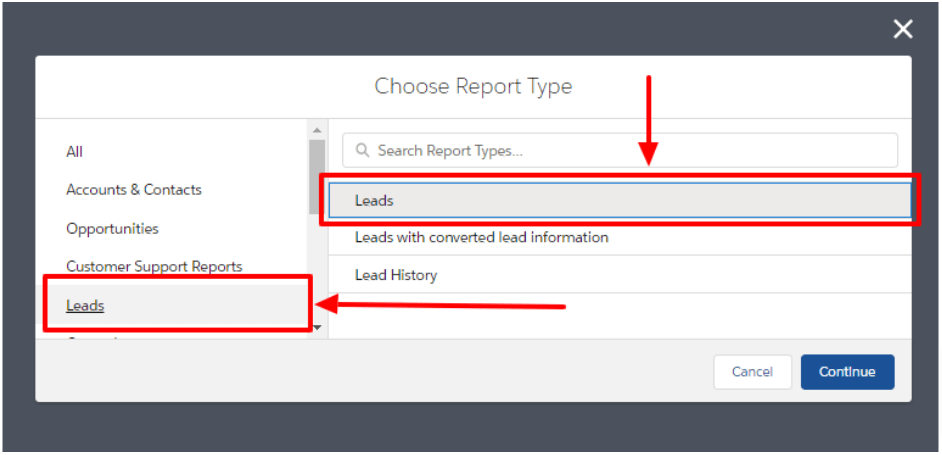
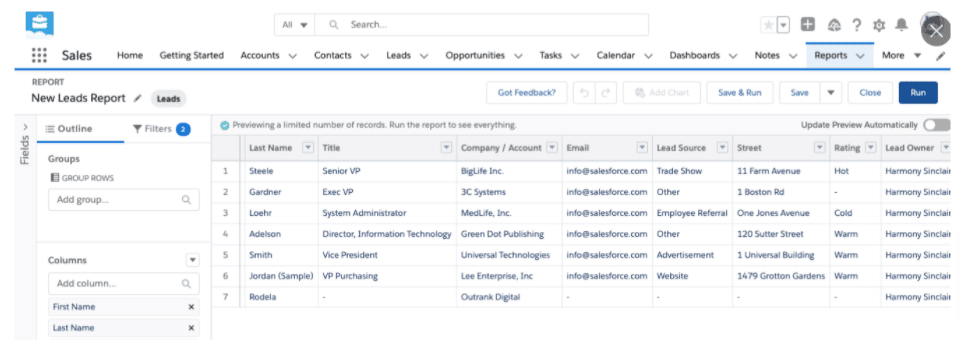
For the sake of this example, we will choose “Leads.” The report should look like this:
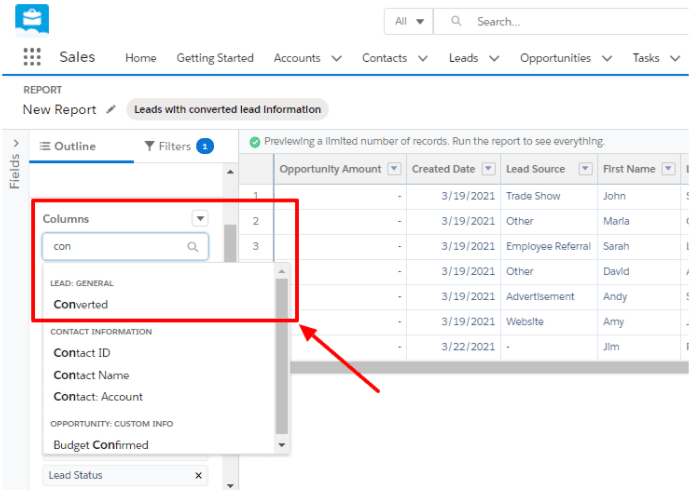
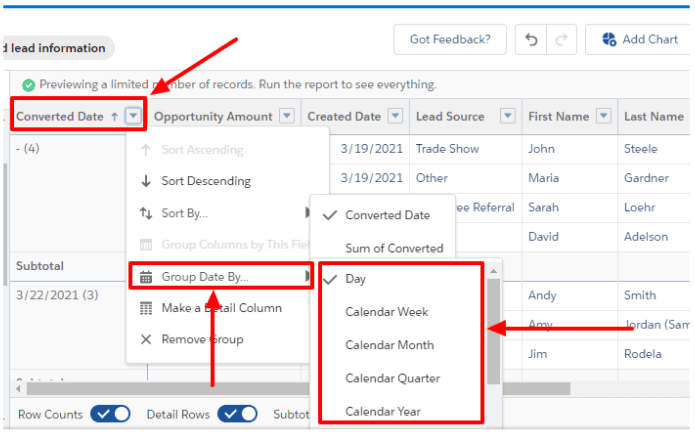
In the “Columns” section, add “Converted” so the report would show the number of leads that converted into opportunities.
Once you’ve added the “Converted” column, the leads who had converted will have a checkmark.
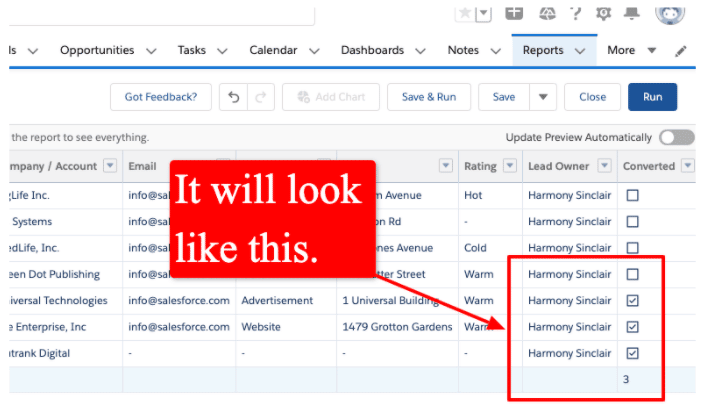
Click the “Run” button to run the report.
You can also choose to view the converted leads by calendar week, month, quarter, year, etc., in the “Converted date” column.
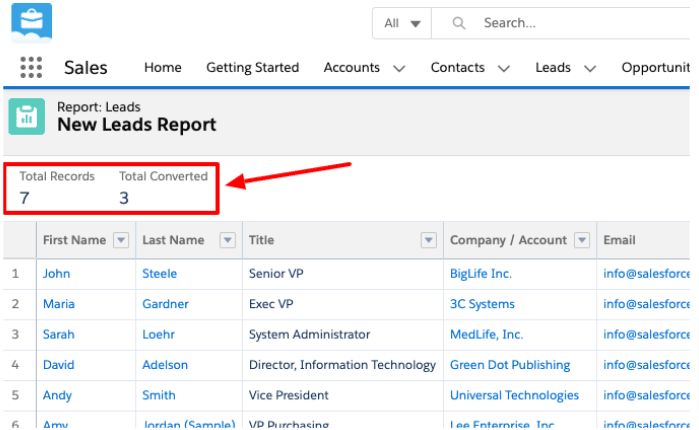
With this setup, your report will now show the total number of leads and the number of converted leads (or the opportunities).
Once you have this information, you can export your reports to CSV and import them into google sheets or you can use Coefficient to import data from Salesforce directly to your Google Sheets automatically.
With this, you can even create a chart to get a visual representation of your lead to opportunities conversion rate.
(Because we hate tedious and needlessly repeatable tasks we will show you how to import and keep your data fresh using Coefficient.)
Coefficient makes keeping your report up to date effortless and seamless. The app automatically updates your Google Sheets info every time you change anything in your SFDC data. You can then set alerts that trigger notifications for your sales directors and managers.
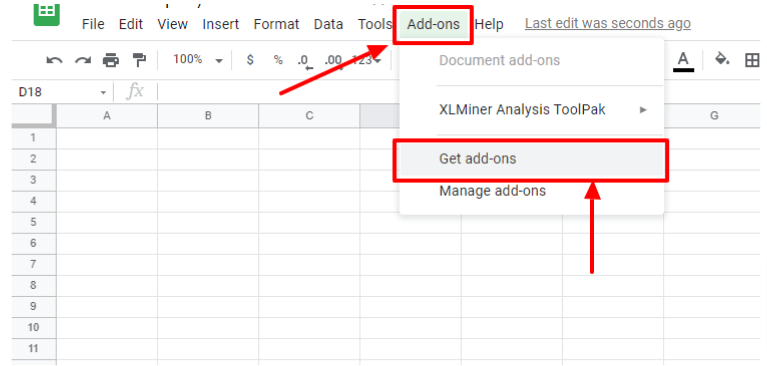
To install the Coefficient app to your Google Sheets account, go to “Add-ons” and click “Get Add ons.”
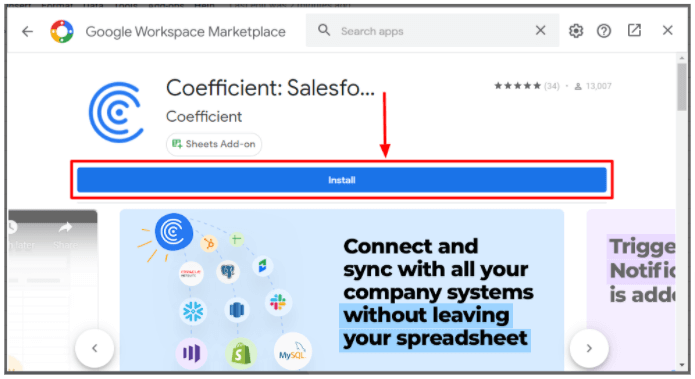
Search for Coefficient and click “Install.”
Once installed, launch the app from the “Add-ons” tab.
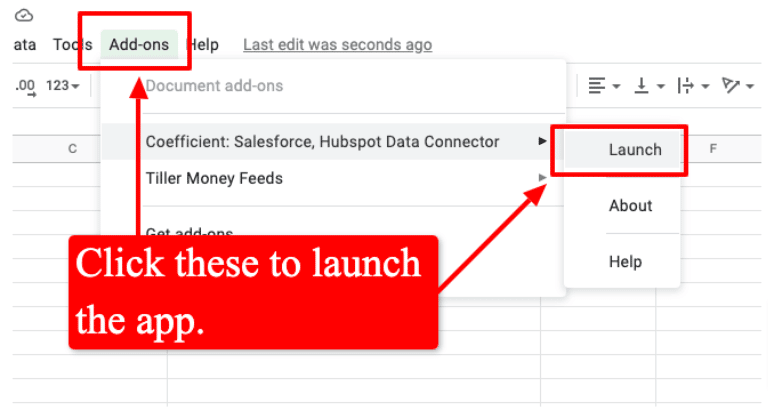
Click “Import Data” in the Coefficient popup window > select “Salesforce” > import from “Report.”
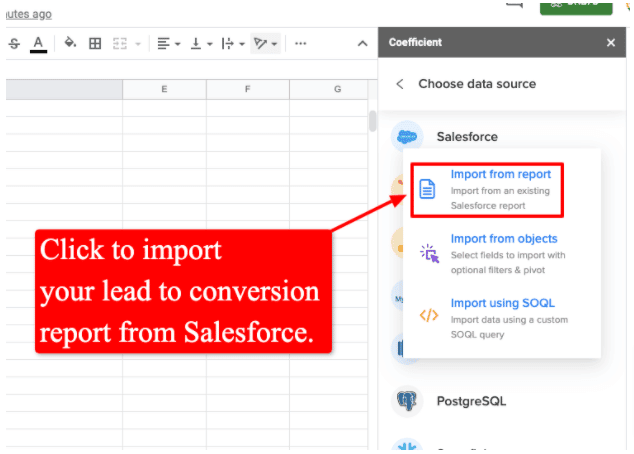
Following these steps will import your lead to conversion opportunity data to Google Sheets in seconds.
There are several ways to interpret your conversion rates. However, for the most part, having a low lead to opportunity conversion rate would mean you have a poor lead qualification process.
If you have a high number of qualified leads, but a good majority of them don’t convert into opportunities, it often means you have deeper issues within your sales funnel.
It could be that your sales team lacks training, the leads you obtained from the get-go weren’t a good fit, or your offers don’t resonate with your audience, etc.
In a nutshell, tracking your lead to opportunity conversion rate can show you the good and bad practices you’re implementing in your sales initiatives.

Stop exporting data manually. Sync data from your business systems into Google Sheets or Excel with Coefficient and set it on a refresh schedule.

Frequently asked questions about lead to opportunity conversion rate
Below are questions we’ve seen over and over about lead to opportunity conversion rates.
What is a good lead to opportunity conversion rate?
It can vary depending on your industry, type of business, or your campaign’s dynamics.
However, the average lead to opportunity conversion rate across various industries is 13% (Source: youngmarketingconsulting.com), with an average time to conversion of 84 days.
How do you convert leads to opportunities?
Generally, your lead becomes an opportunity when you qualify it, and it is ready for conversion.
In Salesforce, qualifying a lead means converting that lead record into an opportunity, and your sales team can work on that opportunity until the deal is closed, either by completing or canceling it.
When you convert a sales-ready lead, SFDC uses the lead record information to automatically create a business account (the actual company or business), contact (the person and the same individual from the lead), and opportunity.
What is a lead conversion rate?
Lead conversion rate can mean many things depending on what you want to measure and the various areas your sales team and company choose to focus on.
You can get as granular as you can with measuring your conversion rate. The deeper you go, the more distinct your performance metrics are.
For instance, you can measure the rate at which your website visitors convert to Marketing Qualified Leads (MQLs) to Sales Qualified Leads (SQLs), SQLs to closed deals. On the other hand, the entire process of turning cold leads to closed deals can also be your lead conversion rate.
A more concrete example of a lead conversion rate is the percentage of website visitors you capture as leads.
Measuring this top-of-the-funnel conversion metric can help you determine your lead-capturing strategies’ effectiveness in attracting your target audience and your website’s efficiency in turning visitors into leads.
What is a good B2B conversion rate?
It depends on your marketing and sales channels, industry, and other factors.
Klood.com considers 3% – 5% and 8% to be a good SaaS conversion rate.
Besides determining the best conversation rate for your business to turn to significant profit and ROI, a good approach is to look at the average conversion rate for several B2B companies.
You can use the information as benchmarks to compare your sales performance with your competitors’ average performance.
When should a lead be converted to an opportunity?
You can convert your leads to opportunities once they fulfill the specific indicators that you and your team established.
Ensure that your indicator (or set of indicators) helps your team maintain a level of consistency and assess how it impacts your sales workflow and pipeline.
Doing this ensures you have strict exit criteria that are met at each phase of your workflow, including the stages between converting leads to opportunities.
Below are some considerations to help you determine the best time to convert a lead into an opportunity.
- When your legitimate prospect indicates a form of interest in doing business with and purchasing from you.
- Once pricing has been discussed by your sales team and prospect. This is one of the best indicators that your leads are ready to be converted into opportunities.
Conclusion
Slight improvements in your opportunity conversion rates can have exponential effects on your sales revenue.
That’s why it’s critical to track your lead to opportunity conversion rates to see how you can refine and improve your sales processes.
The good news is, tracking your conversion rates and producing the reports in Google Sheets isn’t complicated at all.
By following the steps and strategies pointed in this guide, you can set up your Google Sheets to start pulling data automatically from Salesforce in a matter of minutes.
When you have easy access to crucial information such as your lead to opportunity conversion rates, you are better positioned to streamline and improve your sales processes for better conversions.
Try Coefficient for free today!


