How to Build a Dashboard in Xero: 2025 Guide

Are you looking to harness the full power of Xero’s reporting capabilities?

Whether you’re an accountant, financial controller, or business owner, understanding how to build effective reports and dashboards in Xero is crucial for making informed decisions.

This guide will walk you through everything you need to know about Xero reporting in 2025, from basic report types to advanced dashboard creation and automation.

Common Xero Report Types

Xero offers a variety of report types to help you analyze your financial data. Let’s explore the most commonly used reports and their applications:

Accounting Reports

Xero provides several essential accounting reports that give you a clear picture of your financial health:

  1. Executive Summary: This report offers a high-level overview of your business’s financial performance, including key metrics like income, expenses, and cash flow.
  2. Cash Summary: Track your cash inflows and outflows over a specific period, helping you manage your liquidity effectively.
  3. Income Statement (Profit and Loss): Analyze your revenue, expenses, and profitability over a given timeframe.
  4. Balance Sheet: Get a snapshot of your company’s financial position, including assets, liabilities, and equity.
  5. Accounts Receivable Aging Summary: Monitor outstanding customer payments and identify potential collection issues.
  6. Accounts Payable Aging Summary: Keep track of your unpaid bills and manage your cash flow more effectively.

These reports, along with the Financial Reports & Sales Overview Dashboard, offer a snapshot of your company’s performance. For example, the Executive Summary provides a high-level overview of your financial position, while the Accounts Receivable Aging Summary helps you track outstanding invoices and manage cash flow.

Exporting Reports from Xero

Xero allows you to export reports in various formats for further analysis or sharing with stakeholders. Here’s how to export a report:

Step 1: Generate the desired report in Xero. Navigate to the Reports section and select the report you want to export.

Step 2: Click on the “Export” button. This is typically located at the top of the report page.

Step 3: Choose your preferred export format. Xero usually offers CSV and XLSX (Excel) formats for most reports.

Step 4: Configure any additional export options. Depending on the report, you may be able to customize the data included in the export.

Step 5: Click “Export” to download the file. The report will be saved to your device in the chosen format.

While Xero’s native export functionality is useful, tools like Coefficient can streamline this process for spreadsheet users. Coefficient allows you to pull Xero data directly into Google Sheets or Excel, enabling real-time updates and more flexible reporting options.

How to Build a Custom Report in Xero

Creating custom reports in Xero allows you to tailor the information to your specific needs. Here’s a step-by-step guide to building a custom report:

Step 1: Navigate to the Reports section in Xero. Click on “Reports” in the main menu.

Step 2: Select “New Report” or “Custom Reports.” Look for an option to create a new custom report.

Step 3: Choose a report type. Xero offers various report types as starting points for customization.

Step 4: Set your report parameters. Define the date range, accounts, and other relevant filters for your report.

Step 5: Select the columns and data you want to include. Customize the layout by adding or removing columns and choosing specific data points.

Step 6: Apply any necessary formulas or calculations. Use Xero’s built-in functions to perform calculations within your report.

Step 7: Format and style your report. Adjust fonts, colors, and other visual elements to improve readability.

Step 8: Save and name your custom report. Give your report a descriptive name for easy future access.

Step 9: Run the report and review the results. Make any final adjustments to ensure the report meets your needs.

Remember that the exact steps may vary slightly depending on your Xero plan and any updates to the platform.

Building Advanced Reports & Dashboards in Xero

While Xero’s native reporting capabilities are robust, creating truly advanced reports and dashboards often requires additional tools or expertise. Here’s how you can take your Xero reporting to the next level:

Step 1: Identify your reporting goals. Determine the key metrics and insights you need to track.

Step 2: Gather data from multiple sources. Combine Xero data with information from other systems for a more comprehensive view.

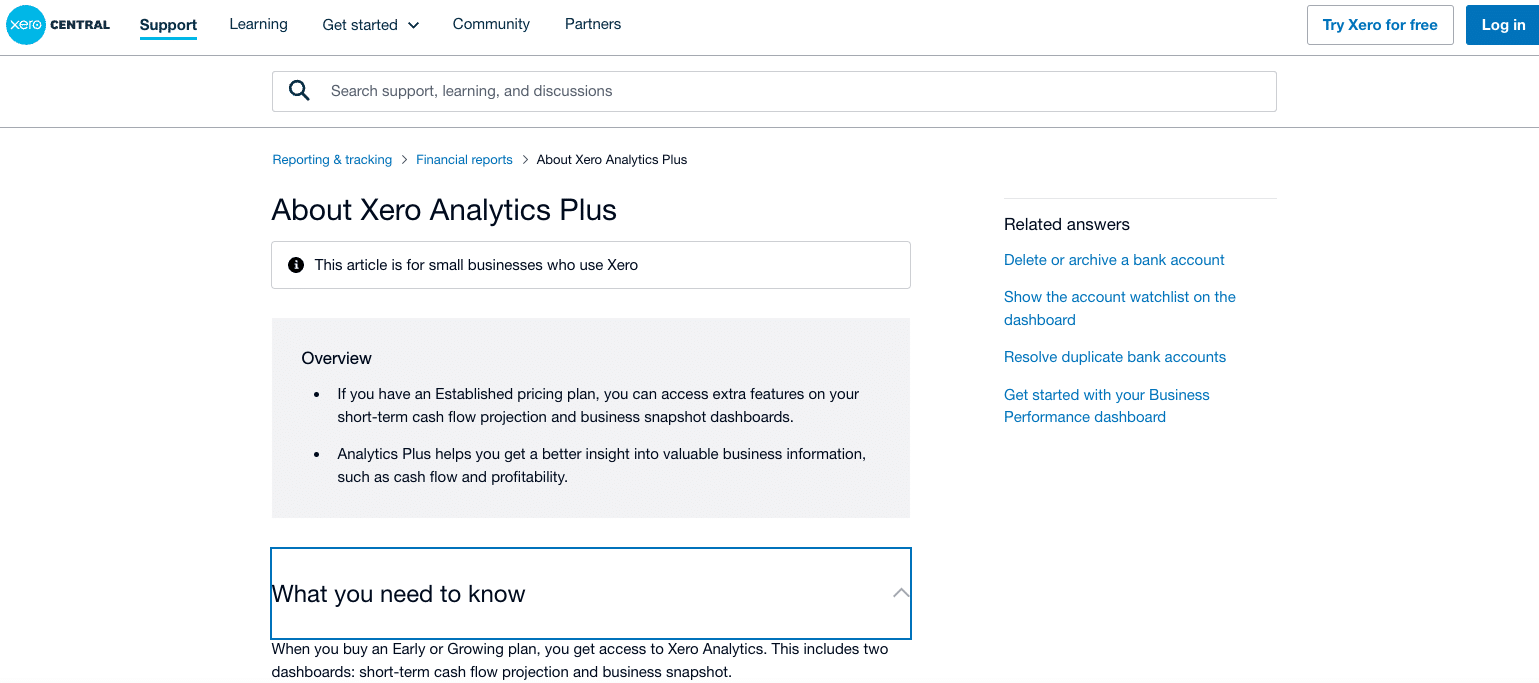
Step 3: Use Xero Analytics Plus (if available). This add-on provides more advanced reporting features, including cash flow projections and business snapshots.

Step 4: Leverage third-party reporting tools. Consider using specialized tools like Coefficient to create more flexible and dynamic reports.

Step 5: Design your dashboard layout. Organize your key metrics and visualizations in a logical, easy-to-read format.

Step 6: Create custom visualizations. Use charts, graphs, and other visual elements to make your data more digestible.

Step 7: Implement interactivity. Add filters and drill-down capabilities to allow users to explore the data.

Step 8: Set up automated data refreshes. Ensure your dashboard always displays the most up-to-date information.

Step 9: Test and refine your dashboard. Gather feedback from users and make improvements as needed.

While Xero offers some advanced reporting features, tools like Coefficient provide greater flexibility and familiarity, especially for users comfortable with spreadsheet environments. Coefficient allows you to pull Xero data directly into Google Sheets or Excel, enabling you to create highly customized reports and dashboards with real-time data updates.

Automating Xero Reporting

Automation is key to efficient reporting. Here’s how you can automate your Xero reporting process:

  1. Schedule regular reports: Set up Xero to automatically generate and email reports on a recurring basis.
  2. Use Xero’s API: For more advanced automation, leverage Xero’s API to pull data into other systems or custom applications.
  3. Implement third-party automation tools: Platforms like Zapier or Coefficient can help automate data transfers and report generation.
  4. Set up alerts: Configure notifications for key financial events or when certain thresholds are met.
  5. Create report templates: Save time by creating reusable report templates for common reporting needs.

By automating your reporting processes, you can save time, reduce errors, and ensure you always have access to the latest financial insights.

Limitations of Xero Reporting

While Xero offers robust reporting capabilities, it’s important to be aware of its limitations:

  1. Cash flow projections: Detailed cash flow projections for 60 or 90 days are only available in higher-tier pricing plans.
  2. Advanced reporting features: Some advanced reporting tools, like Xero Analytics Plus, require an additional subscription.
  3. Limited customization: While Xero offers some customization options, creating highly specialized reports can be challenging within the native platform.
  4. Lack of smart notifications: Xero doesn’t offer advanced alert systems, such as Slack notifications for specific financial events.
  5. Consolidated reporting challenges: Creating consolidated reports for multiple entities can be time-consuming and complex in Xero.

To overcome these limitations, many businesses turn to specialized reporting platforms like Coefficient. These tools can provide greater flexibility, more advanced features, and easier integration with other business systems.

Free Xero Reporting Dashboards for Accountants and Finance Controllers

To help you get started with advanced Xero reporting, Coefficient offers several pre-built dashboard templates:

#1 Xero Inventory Excel Template
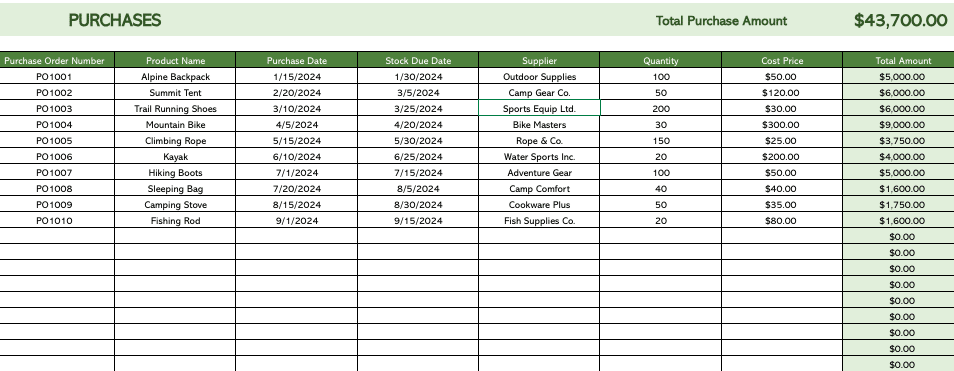
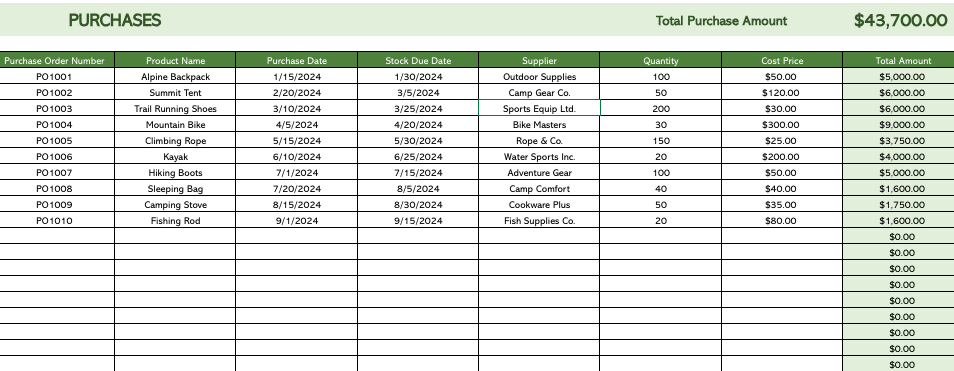
The Xero Inventory Excel Template streamlines your inventory management process. By integrating directly with your Xero account, this template provides real-time visibility into your stock levels, product performance, and inventory trends, all within Excel.

Use Case: Inventory Management and Optimization

This template helps businesses:

  • Monitor current inventory across all products
  • Identify top-selling items and slow-moving stock
  • Set up alerts for when stock reaches reorder levels
  • Manage and track purchase orders efficiently

Metrics Tracked

  • SKU, Size, Colour
  • Original Stock Level
  • Reorder Point
  • Cost Price and Markup
  • Retail Price
  • Total Orders
  • Orders Waiting to be Fulfilled
  • Stock Waiting to be Received
  • Stock on Hand

Get the Xero Inventory Excel Template

#2 Xero3-Year Finance Projections Template
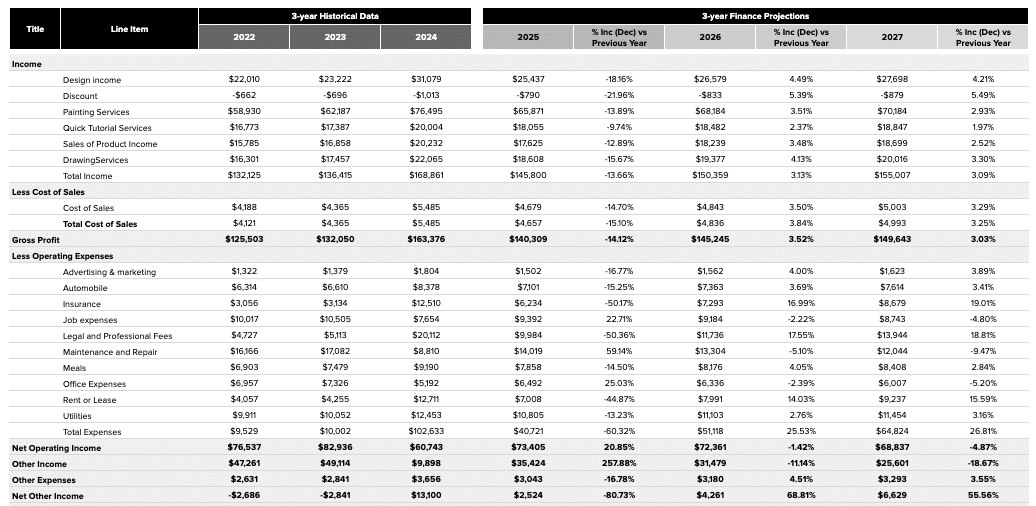
The Xero Finance Projections Template is crucial for businesses aiming to forecast their financial future. This template connects directly to your Xero account, pulling in real-time financial data to create accurate and dynamic financial projections.

Use Case: Financial Forecasting and Planning

This template enables businesses to:

  • Generate detailed financial projections based on historical data
  • Develop multiple financial scenarios to prepare for different outcomes
  • Use projections to inform budget decisions and resource allocation
  • Create professional financial forecasts for stakeholders and potential investors

Metrics Tracked

  • Net Income
  • Changes in Working Capital
  • Depreciation and Amortization
  • Accounts Receivable
  • Accounts Payable
  • Deferred Taxes
  • Cash From Sale Of Capital Assets
  • Cash Paid for Purchase Of Capital Assets
  • Increases in All Other Long-Term Assets

Access the Xero Finance Projections Template

#3 Xero Consolidated Reporting Dashboard
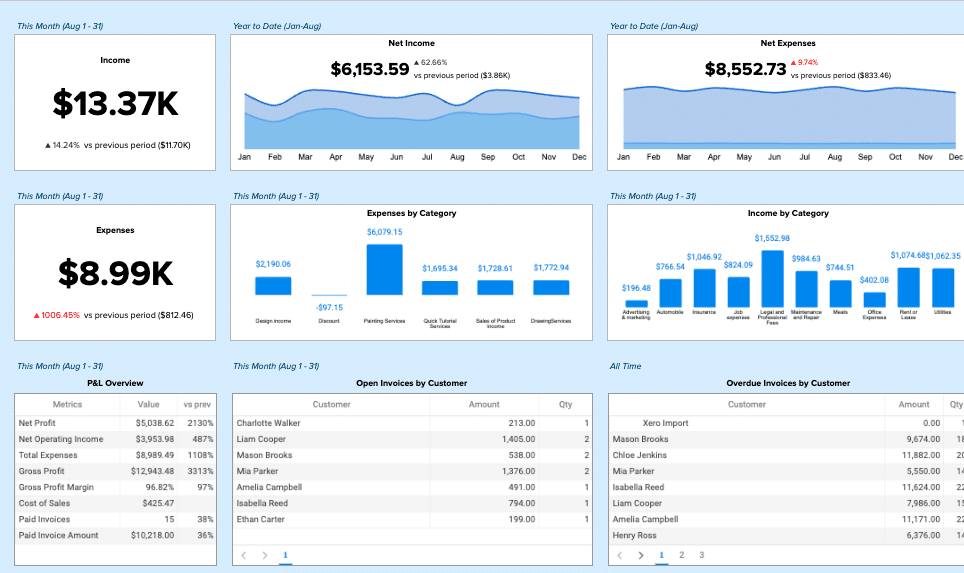
The Xero Consolidated Reporting Dashboard is essential for businesses managing multiple entities or subsidiaries. This dashboard automates the process of consolidating financial data from various Xero organizations, providing a comprehensive view of your overall business performance.

Use Case: Multi-entity Financial Consolidation

This template helps businesses:

  • Automate the process of combining financial data from multiple Xero entities
  • Gain a holistic view of your organization’s financial performance across all entities
  • Reduce errors associated with manual consolidation processes
  • Easily prepare consolidated financial statements for regulatory requirements

Metrics Tracked

  • Gross profit (cash)
  • Open invoices by customer
  • Open invoices amount by customer
  • Overdue invoices by customer
  • Overdue invoices amount by customer
  • Total expenses (cash) by category
  • Paid invoices amount
  • Paid invoices
  • Income (cash) by category

Get Started with the Xero Consolidated Reporting Template

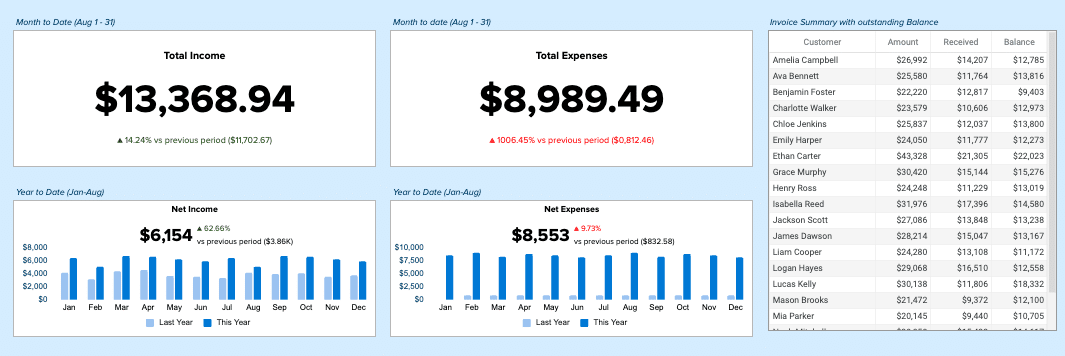
#4 Xero Finance Dashboard
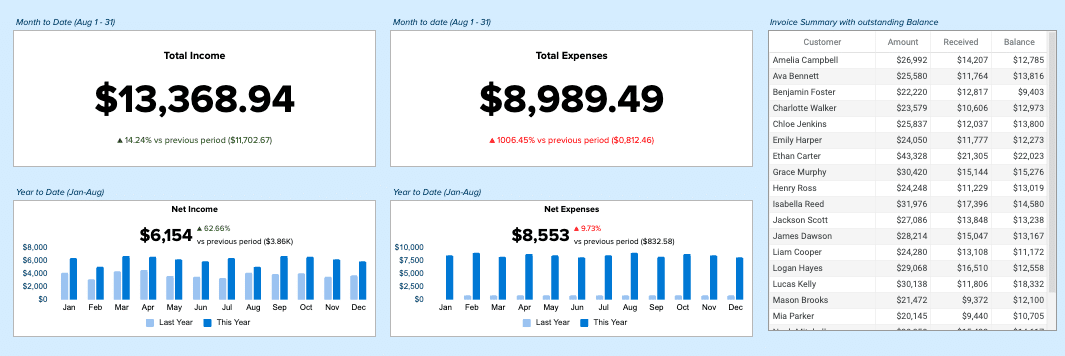
The Xero Finance Dashboard offers a comprehensive visual representation of your business’s financial health. By pulling real-time data directly from Xero, this dashboard provides an at-a-glance overview of key financial metrics, enabling quick and informed decision-making.

Use Case: Financial Performance Monitoring

This dashboard allows businesses to:

  • Track critical financial KPIs in real-time
  • Identify financial trends and patterns through intuitive charts and graphs
  • Easily share financial insights with stakeholders and team members
  • Make data-driven decisions based on up-to-date financial information

Metrics Tracked

  • Income Overview (Total Income, Income by period)
  • Expense Overview (Total Expenses, Expenses by period)
  • Bank Summary (Account balances and received amounts)
  • Profitability (Income, Gross Profit, Net Profit, Other Income, Profit/Loss)
  • Cash Summary (Cash Received, Cash Spent, Cash Surplus/Deficit, Closing Bank Balance)
  • Performance (Gross Profit Margin, Net Profit Margin, Return on Investment)
  • Balance Sheet (Debtors, Creditors, Net Assets)

Explore the Xero Finance Dashboard

Optimize Your Xero Reporting with Live Data

Effective reporting and dashboarding are crucial for making informed business decisions. By leveraging Xero’s built-in features and enhancing them with Coefficient’s advanced capabilities, you can gain deep insights into your financial performance and drive growth.

Ready to take your Xero reporting to the next level? Get started with Coefficient today and discover how easy it can be to create powerful, data-driven reports and dashboards that integrate seamlessly with your Xero data.

Best 5 Xero Reporting Tools in 2025: Supercharge Your Financial Insights

Xero’s built-in reporting capabilities are solid. But for many businesses, they’re just the starting point. Third-party Xero reporting tools take your financial analysis to the next level. They offer deeper insights, more customization, and advanced features that can transform your decision-making process.

Let’s dive into the top 5 Xero reporting tools for 2025. We’ll explore their strengths, weaknesses, and how they can elevate your financial reporting game.

Feature Comparison Table of Top Xero Reporting Tools

Feature

Coefficient

Xero Analytics Plus

Spotlight Reporting

Fathom

Calxa

Row Limits / Export Limits

Up to 5,000 rows for free and starter plans. Unlimited for Pro and Enterprise.

Unlimited

Unlimited

Unlimited

Unlimited

Data Sources

50+ business systems

Xero accounting data

Xero, MYOB, QuickBooks, and 30+ other sources

QuickBooks, Xero, MYOB, and 5000+ via Zapier

Xero, MYOB, QuickBooks, Excel, and 10+ others

Builder License Cost

Free tier available. Paid starts at $49/month

Included with Xero plans (Starting at $33/month)

Starts at $329/month for Small plan

Starts at $55/month for Lite plan

Starts at $54/month for Express plan

Viewer License Cost

Included

Included in main license

$50/month per additional user

Included in main license (up to 3 users in standard plans)

$10/month per additional user

AI Functionality

AI-powered tools for connecting data, building reports, and analysis

AI-powered insights and anomaly detection

AI-assisted reporting and forecasting

AI-powered insights and suggestions

AI-assisted cashflow forecasting

Refresh Frequency

Real-time

Daily

Daily (hourly available on higher plans)

Daily

Daily (hourly available on higher plans)

Alerts

Yes, via Slack and email

Basic alerts via email

Customizable alerts via email and in-app

Customizable alerts via email and in-app

Basic alerts via email

Security

Enterprise-grade security and access controls, likely SOC 2 compliant

SOC 2 compliant, two-factor authentication

SOC 2 compliant, role-based access control

SOC 2 compliant, role-based access control

Role-based access control, data encryption

This table gives you a quick overview. But let’s dig deeper. Each tool has its unique strengths and potential drawbacks.

1. Coefficient

Coefficient stands out as the most versatile and powerful Xero reporting tool. It seamlessly integrates with Xero and 50+ other business systems, allowing you to create comprehensive reports that blend data from multiple sources. Real-time data syncing ensures your reports are always up-to-date, crucial for fast-paced financial decision-making.

Pros

Cons

  • May have a steeper learning curve for non-technical users
  • More features than some small businesses might need

Pricing

  • Free Plan: Includes basic features such as data imports for up to 5,000 rows and 10,000 OpenAI API calls
  • Starter Plan: $49 per user per month, with features like daily automatic refreshes and limited bulk write-backs
  • Pro Plan: $99 per user per month, offering unlimited import size, hourly refreshes, and unlimited bulk write-backs
  • Enterprise Plan: Custom pricing based on specific needs

What do users say about Coefficient?

I used to spend an hour updating sheets so that others had access to real time data and with Coefficient it does it all on it’s own even several times a day if I need. Saves me so much time to focus on real issues instead of manually updating sheets.

Makes it incredibly easy to share data across the org and since the query is visible it is always clear what the source of truth is. It limits breakage and enables fast automation of regular analyses.

Customer Support

  • Email support and chat for all users
  • Knowledge base with comprehensive documentation and tutorials
  • Dedicated account managers, Slack for enterprise clients

2. Xero Analytics Plus

Xero Analytics Plus is the native advanced reporting solution for Xero users. It offers enhanced cash flow forecasting and business snapshot features, making it a solid choice for businesses already deeply integrated with Xero.

Pros

  • Seamless integration with Xero
  • User-friendly interface
  • No additional software to learn
  • Short-term cash flow forecasting

Cons

  • Limited to Xero data only
  • Fewer customization options compared to third-party tools
  • 2,000 row limit may be restrictive for larger businesses

Pricing

Included with Xero Premium plans or as an add-on for $10/month

What do users say about Xero Analytics Plus?

“Xero Analytics Plus provides valuable insights into our business performance, but the interface can be a bit overwhelming for new users. It takes some time to get used to the various features and customization options.”

Quote: “The cash flow forecasting in Xero Analytics Plus has been a game-changer for our business. We can now anticipate potential cash flow issues and make informed decisions to ensure our financial stability.”

Customer Support

Support is provided through Xero’s standard channels, including email and an extensive knowledge base.

3. Spotlight Reporting

Spotlight Reporting offers a range of reporting options, from simple dashboards to complex three-way forecasts. It’s known for its visually appealing reports and customization options.

Pros

  • Visually striking reports
  • Customizable templates
  • Multi-entity consolidation
  • Scenario planning features

Cons

  • Higher price point
  • Can be complex for new users
  • Limited to 10,000 rows

Pricing

  • Builder License: $350/month
  • Viewer License: $50/month

What do users say about Spotlight Reporting?

“The software is quite complex and can be overwhelming for new users. It takes some time to learn how to use all the features and create custom reports. Additionally, the pricing can be expensive for small businesses.”

  • Source: G2

Spotlight Reporting is easy to use and has helped us to provide our clients with valuable insights into their businesses. The reports are visually appealing and easy to understand, and the forecasting feature is invaluable for helping our clients plan for the future.”

  • Source: G2

Customer Support

Spotlight offers email support and a rich library of resources, including webinars and tutorial videos.

4. Fathom

Fathom focuses on providing clear, actionable insights through its reporting and analysis tools. It’s particularly strong in KPI tracking and benchmarking.

Pros

  • Intuitive KPI tracking
  • Benchmarking capabilities
  • Clean, professional report designs
  • Good balance of features and usability

Cons

  • 5,000 row limit
  • Fewer integration options compared to Coefficient
  • Limited customization for more complex reporting needs

Pricing

  • Builder License: $55/month
  • Viewer License: $40/month

What do users say about Fathom?

“Fathom has allowed me to provide so much more value to my clients. I am able to generate reports so much faster, and present them in a way that is easy for my clients to understand. This allows me to spend more time actually consulting with my clients, rather than spending hours putting together reports.”

“Some of the features are not as intuitive as I would like, and it takes some time to figure out how to use them. Additionally, the pricing can be a bit high for smaller businesses.”

Customer Support

Fathom provides email support and offers a comprehensive knowledge base for users.

5. Calxa

Calxa specializes in budgeting and cashflow forecasting, making it a good choice for businesses focused on financial planning and projections.

Pros

  • Strong budgeting and forecasting features
  • Supports multiple entities
  • Suitable for non-profit organizations
  • Free viewer licenses

Cons

  • 3,000 row limit
  • Less focus on general reporting compared to other tools
  • User interface can be less intuitive

Pricing

  • Builder License: $159/month
  • Viewer License: Free

What do users say about Calxa?

“Calxa has been a lifesaver for our non-profit organization. It has simplified our budgeting and reporting processes, allowing us to easily track our financial performance and make informed decisions. The customer support is also excellent, always quick to respond and provide helpful assistance.”

“Calxa is a powerful tool, but it can be overwhelming for beginners. The initial setup and configuration can be time-consuming, and the sheer number of features and options can be intimidating. However, once you get the hang of it,
it’s definitely worth the effort.”

Customer Support

Calxa offers email support and provides a range of tutorial videos and documentation.

Choosing the Right Reporting Tool for Your Business

Reporting tools can significantly enhance Xero’s capabilities, offering deeper insights and streamlined processes. Coefficient’s wide range of integrations and real-time data syncing make it a versatile option for comprehensive reporting.

When selecting a tool, consider your specific reporting needs, data sources, and budget. Many options offer free trials, allowing you to test their features firsthand. The right reporting tool can transform financial data into valuable insights, supporting better business decisions.

Ready to take your Xero reporting to the next level? Get started with Coefficient today and transform your financial data into actionable insights.

Top 4 Xero Reports and Dashboards in 2024

Searching for the most effective Xero reports? This guide presents four essential dashboards that offer clear insights into your financial data, empowering you to make informed decisions and drive business growth in 2024.

#1 Xero Inventory Excel Template

The Xero Inventory Excel Template streamlines your inventory management process. By integrating directly with your Xero account, this template provides real-time visibility into your stock levels, product performance, and inventory trends, all within Excel.

Use Case: Inventory Management and Optimization

This template helps businesses:

  • Monitor current inventory across all products
  • Identify top-selling items and slow-moving stock
  • Set up alerts for when stock reaches reorder levels
  • Manage and track purchase orders efficiently

Metrics Tracked

  • SKU, Size, Colour
  • Original Stock Level
  • Reorder Point
  • Cost Price and Markup
  • Retail Price
  • Total Orders
  • Orders Waiting to be Fulfilled
  • Stock Waiting to be Received
  • Stock on Hand

Get the Xero Inventory Excel Template

#2 Xero 3-Year Finance Projections Template

The Xero Finance Projections Template is crucial for businesses aiming to forecast their financial future. This template connects directly to your Xero account, pulling in real-time financial data to create accurate and dynamic financial projections.

Use Case: Financial Forecasting and Planning

This template enables businesses to:

  • Generate detailed financial projections based on historical data
  • Develop multiple financial scenarios to prepare for different outcomes
  • Use projections to inform budget decisions and resource allocation
  • Create professional financial forecasts for stakeholders and potential investors

Metrics Tracked

  • Net Income
  • Changes in Working Capital
  • Depreciation and Amortization
  • Accounts Receivable
  • Accounts Payable
  • Deferred Taxes
  • Cash From Sale Of Capital Assets
  • Cash Paid for Purchase Of Capital Assets
  • Increases in All Other Long-Term Assets

Access the Xero Finance Projections Template

#3 Xero Consolidated Reporting Dashboard

The Xero Consolidated Reporting Dashboard is essential for businesses managing multiple entities or subsidiaries. This dashboard automates the process of consolidating financial data from various Xero organizations, providing a comprehensive view of your overall business performance.

Use Case: Multi-entity Financial Consolidation

This template helps businesses:

  • Automate the process of combining financial data from multiple Xero entities
  • Gain a holistic view of your organization’s financial performance across all entities
  • Reduce errors associated with manual consolidation processes
  • Easily prepare consolidated financial statements for regulatory requirements

Metrics Tracked

  • Gross profit (cash)
  • Open invoices by customer
  • Open invoices amount by customer
  • Overdue invoices by customer
  • Overdue invoices amount by customer
  • Total expenses (cash) by category
  • Paid invoices amount
  • Paid invoices
  • Income (cash) by category

Get Started with the Xero Consolidated Reporting Template

#4 Xero Finance Dashboard

The Xero Finance Dashboard offers a comprehensive visual representation of your business’s financial health. By pulling real-time data directly from Xero, this dashboard provides an at-a-glance overview of key financial metrics, enabling quick and informed decision-making.

Use Case: Financial Performance Monitoring

This dashboard allows businesses to:

  • Track critical financial KPIs in real-time
  • Identify financial trends and patterns through intuitive charts and graphs
  • Easily share financial insights with stakeholders and team members
  • Make data-driven decisions based on up-to-date financial information

Metrics Tracked

  • Income Overview (Total Income, Income by period)
  • Expense Overview (Total Expenses, Expenses by period)
  • Bank Summary (Account balances and received amounts)
  • Profitability (Income, Gross Profit, Net Profit, Other Income, Profit/Loss)
  • Cash Summary (Cash Received, Cash Spent, Cash Surplus/Deficit, Closing Bank Balance)
  • Performance (Gross Profit Margin, Net Profit Margin, Return on Investment)
  • Balance Sheet (Debtors, Creditors, Net Assets)

Explore the Xero Finance Dashboard

Conclusion

These four Xero reports offer valuable insights into various aspects of your business’s financial health, from inventory management to consolidated reporting and financial projections. By using these dashboards, you’ll be better equipped to make data-driven decisions and keep your business on the path to financial success in 2024 and beyond. Start using these Xero reports today to transform your financial reporting and decision-making processes.

Explore All Xero Connector Dashboards

Additional Resources: