Are you struggling to understand why visitors are abandoning their shopping carts on your eCommerce site? Learning how to track cart abandonment in Google Analytics is crucial for identifying issues in your checkout process and recovering lost sales.
In this comprehensive guide, we’ll walk you through the step-by-step process of setting up cart abandonment tracking, analyzing the data, and taking action to reduce abandonment and boost conversions.
Setting Up Cart Abandonment Tracking on Google Analytics
Prerequisites
Before you can track cart abandonment, you need to have Enhanced Ecommerce tracking enabled in your Google Analytics account. Enhanced Ecommerce provides deeper insights into customer behavior and is required for tracking shopping cart activity.
To enable Enhanced Ecommerce:
- Sign in to Google Analytics
- Navigate to Admin > Ecommerce Settings
- Toggle on “Enable Ecommerce”
- Toggle on “Enable Enhanced Ecommerce Reporting”
- Click “Save”
Step 1: Create a New Goal
With Enhanced Ecommerce enabled, you’re ready to create a new goal in Google Analytics to track cart abandonment:
- In your Google Analytics account, navigate to Admin > View > Goals
- Click “+ New Goal”

Source: https://www.yieldify.com/blog/cart-abandonment-google-analytics/
- Select “Custom” as the goal type
- Click “Continue”
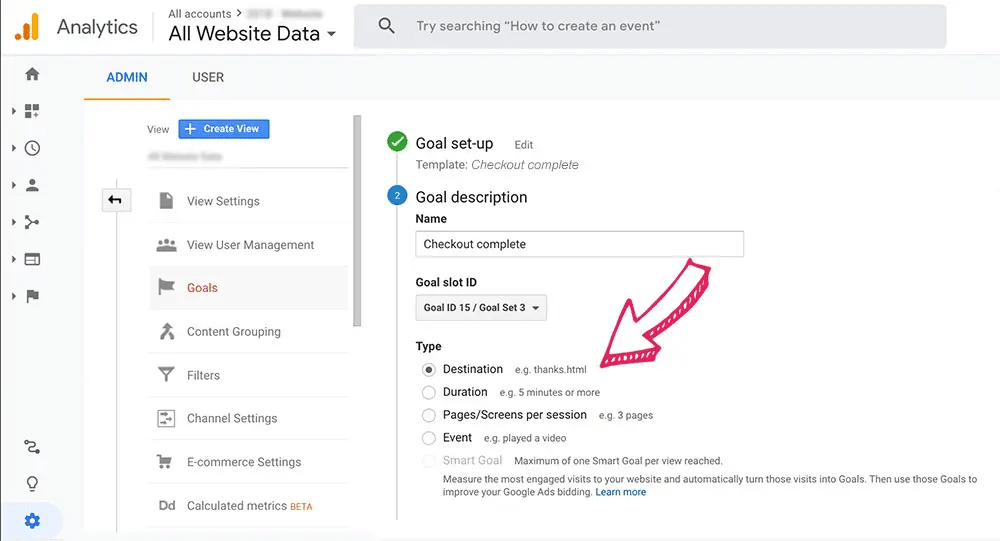
Step 2: Configure Goal Details
Next, you’ll configure the details for your cart abandonment goal:
- Name your goal something clear and descriptive, like “Cart Abandonment”
- For the goal type, choose “Destination”
Source: https://www.yieldify.com/blog/cart-abandonment-google-analytics/
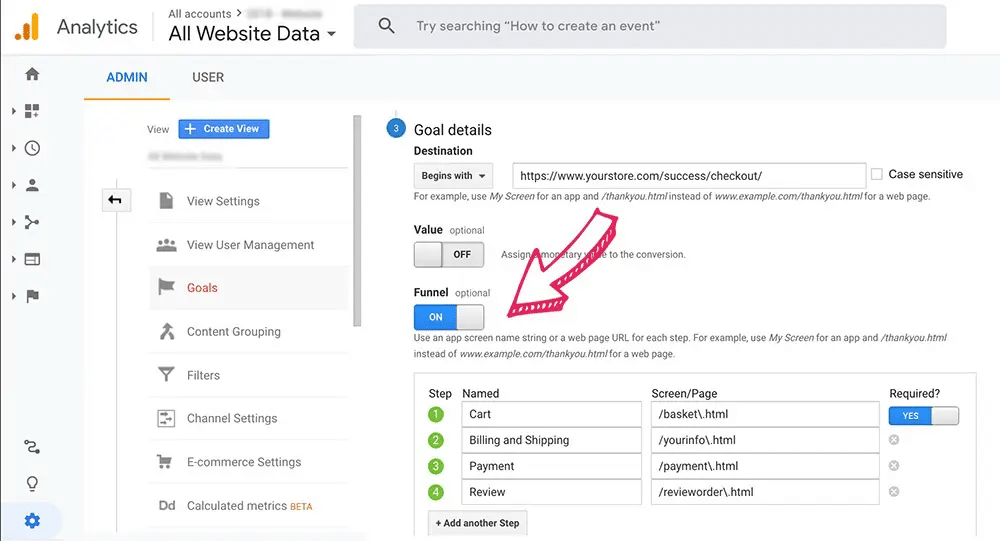
- Under “Destination,” set the goal destination URL to the URL of your shopping cart page (e.g. “/cart”)
- Toggle the “Funnel” option to ON
Source: https://www.yieldify.com/blog/cart-abandonment-google-analytics/
- Click “Continue”
Step 3: Define the Funnel Steps
The funnel visualization in Google Analytics allows you to see how users flow through your checkout process and where they’re dropping off. To set up the funnel:
- In the “Funnel” section, add each step of your checkout process
- For each step, specify the URL and a name (e.g. “Cart”, “Shipping”, “Payment”, “Confirmation”)
- Double check that the URLs are correct for each step
- Click “Save”
That’s it! You’ve now created a goal to track cart abandonment in Google Analytics. It may take up to 24 hours for the first data to appear in your reports.
Analyzing Cart Abandonment Data in Google Analytics
With your cart abandonment goal set up, you can start analyzing the data to gain insights into customer behavior and identify opportunities for improvement.
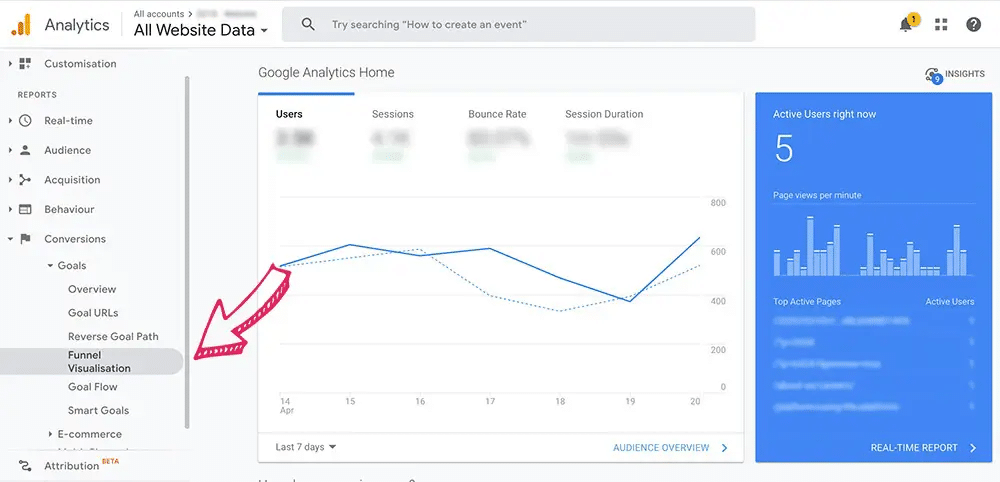
Accessing Cart Abandonment Reports
To view your cart abandonment reports in Google Analytics:
- Sign in to Google Analytics
- Navigate to Conversions > Goals > Funnel Visualization
Source: https://www.yieldify.com/blog/cart-abandonment-google-analytics/
- In the top right corner, select your cart abandonment goal from the dropdown menu
The Funnel Visualization report will display, showing the number and percentage of users who proceeded through each step of your checkout funnel.
Interpreting the Funnel Visualization Report
The Funnel Visualization report is a powerful tool for understanding where and why users are abandoning their carts. Here’s how to interpret the key data points:
- Total Abandonment Rate: The percentage of users who entered the funnel but did not complete the goal. Calculate this by subtracting the goal completion rate from 100%.
- Abandonment Rate Per Step: The percentage of users who abandoned at each step of the funnel. Look for significant drop-off points that indicate potential issues.
- Total Abandonments: The number of users who abandoned the funnel overall. Use this alongside the rates to understand the full scope.
Beyond the funnel visualization, you can also analyze cart abandonment through other lenses in Google Analytics, such as:

Stop exporting data manually. Sync data from your business systems into Google Sheets or Excel with Coefficient and set it on a refresh schedule.
Get Started
- Segmenting abandonment rates by traffic source, device category, browser, etc. to uncover problematic areas
- Using custom dimensions like product category to analyze abandonment rates by product type
- Comparing cart abandonment rates over different time periods to identify trends or spikes
The insights you glean from this data will help inform your optimization efforts and allow you to create a more seamless checkout experience.
Strategies for Reducing Cart Abandonment
Armed with data from Google Analytics, you can start implementing strategies to reduce cart abandonment on your eCommerce site:
- Simplify your checkout process: Reduce the number of steps required to complete a purchase and eliminate unnecessary form fields.
- Be transparent about costs: Clearly display shipping costs, taxes, and fees early in the checkout process to avoid surprises that may lead to abandonment.
- Offer guest checkout: Don’t require users to create an account to make a purchase, as this can be a barrier for some.
- Provide multiple payment options: Accommodate different preferences by offering a variety of payment methods, such as credit cards, PayPal, and Apple Pay.
- Display trust signals: Boost confidence by prominently displaying security badges, SSL certificates, and customer reviews.
- Implement cart abandonment emails: Set up automated emails to remind users about items left in their cart and incentivize them to complete their purchase.
- Use retargeting ads: Show personalized ads to cart abandoners as they browse other sites to bring them back to your store.
By continuously monitoring your cart abandonment rate and testing different optimization strategies, you can improve your checkout process and convert more abandoned carts into completed purchases.
Next Steps
Cart abandonment is a major challenge for eCommerce businesses, but by tracking and analyzing abandonment data in Google Analytics, you can uncover valuable insights to optimize your checkout process and recover lost sales.
With the step-by-step instructions in this guide, you’re well-equipped to set up cart abandonment tracking, interpret the data, and take action to improve conversions. And by leveraging tools like Coefficient, you can streamline the process and make data-driven decisions with ease.
Don’t let cart abandonment eat into your profits – start tracking and optimizing today. Sign up for Coefficient’s free trial to simplify your cart abandonment tracking and reporting.
Further Reading
- GA4 Export to Excel in 2024
- How to Export Google Analytics Data Into Google Sheets
- GA4 E-commerce Report Template
Frequently Asked Questions
How to find cart abandonment in Google Analytics?
To find cart abandonment in Google Analytics, navigate to Conversions > Goals > Funnel Visualization and select your cart abandonment goal from the dropdown menu. This will display the funnel visualization report, showing you where users are dropping off in the checkout process. Coefficient can help simplify this process by automatically syncing your Google Analytics data to Google Sheets or Excel, making it easier to analyze and share cart abandonment insights.
How to track shopping cart abandonment?
To track shopping cart abandonment, you need to set up Enhanced Ecommerce tracking in Google Analytics and create a goal that tracks the checkout funnel. Define each step of the checkout process and specify the URL for each step. Once configured, you can access the Funnel Visualization report to analyze cart abandonment data. Using Coefficient, you can streamline this process by connecting Google Analytics to Google Sheets or Excel, enabling automated data syncing and report generation.
How do I track my add to cart in Google Analytics?
To track “Add to Cart” events in Google Analytics, enable Enhanced Ecommerce tracking. Go to Admin > Ecommerce Settings and toggle on “Enable Ecommerce” and “Enable Enhanced Ecommerce Reporting.” Once enabled, you can track “Add to Cart” events and access related reports under Conversions > Ecommerce. Coefficient’s Google Analytics integration can help you easily export this data to Google Sheets or Excel for further analysis and reporting.
How do I track traffic in Google Analytics?
To track traffic in Google Analytics, go to the “Acquisition” reports. The “Overview” report provides a high-level view of your traffic sources, while the “All Traffic” report allows you to drill down into specific channels, sources, and mediums. You can also use the “Channels” report to see performance by default channel grouping. Coefficient enables you to export this traffic data to Google Sheets or Excel, making it easier to analyze and share insights with your team.
<meta_description> Learn how to set up and analyze cart abandonment tracking in Google Analytics with this step-by-step guide. Plus, discover how Coefficient can simplify the process. </meta_description>


