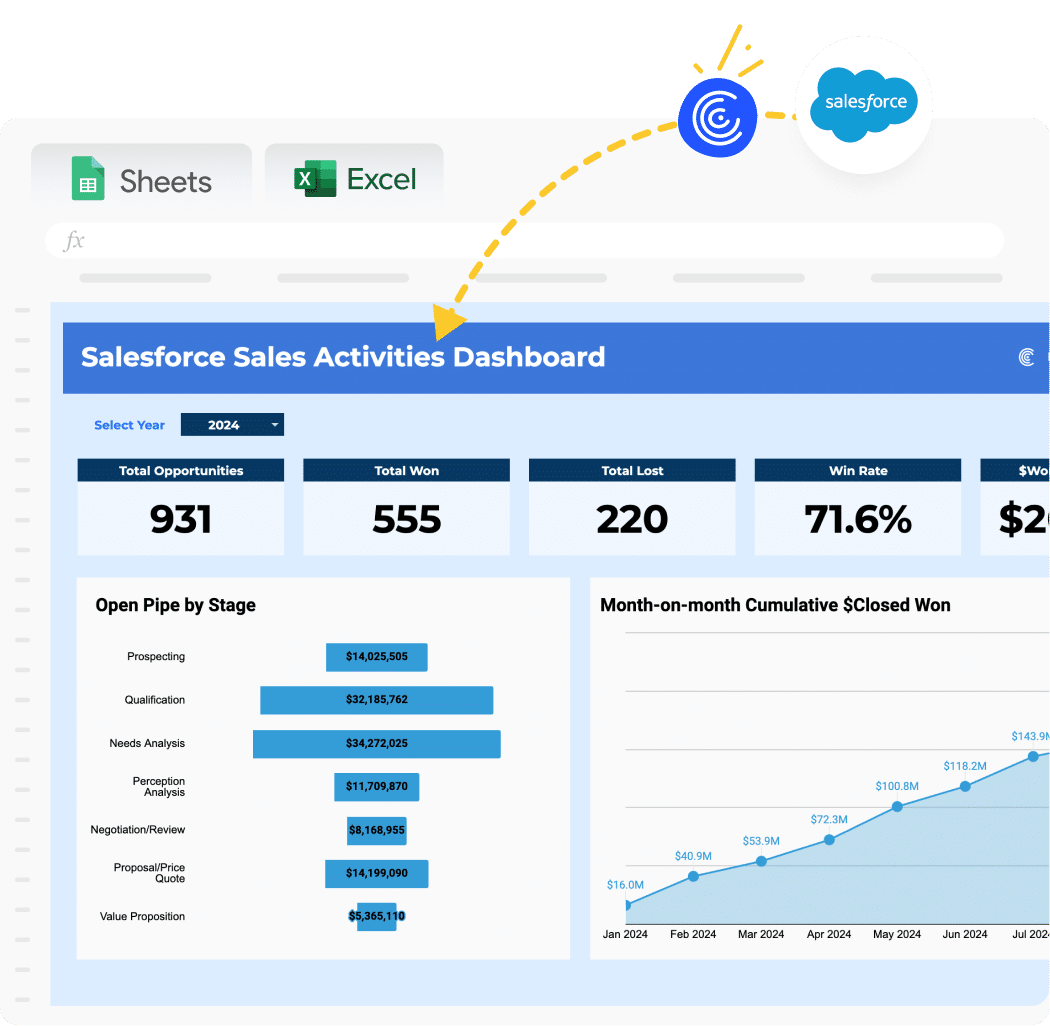
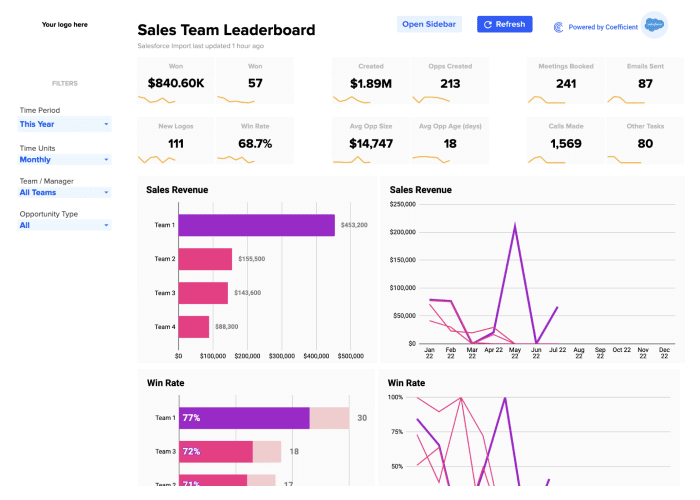
Sales teams often waste hours manually updating activity reports. Our free Salesforce sales activities dashboard template connects to your CRM and updates automatically, giving your team real-time visibility into their performance.
What is a Sales Activities Dashboard Report?
A sales activities dashboard report shows key sales performance metrics and daily tasks in one central view. It helps sales managers and teams track completed activities, monitor progress, and spot trends that affect sales results. The dashboard combines data about calls, meetings, emails, and other essential sales actions to create a complete picture of team performance.
Who is Sales Activities Dashboard Template Built For?
This template serves:
- Sales managers who need quick updates on team performance
- Sales operations professionals tracking activity metrics
- Sales directors measuring team productivity
- Business owners monitoring sales effectiveness
What is the Primary Use Case for Sales Activities Dashboard Template?
The template helps sales leaders track and measure daily sales activities in real-time. It provides clear visibility into team performance, allowing managers to:
Make data-based coaching decisions
Monitor activity completion rates
Track progress toward sales targets
Identify successful patterns
Benefits of Using Salesforce Sales Activities Dashboard Template
- Real-time Updates: Data syncs automatically from Salesforce, eliminating manual updates
- Complete Activity Tracking: See all sales activities, from calls to meetings, in one place
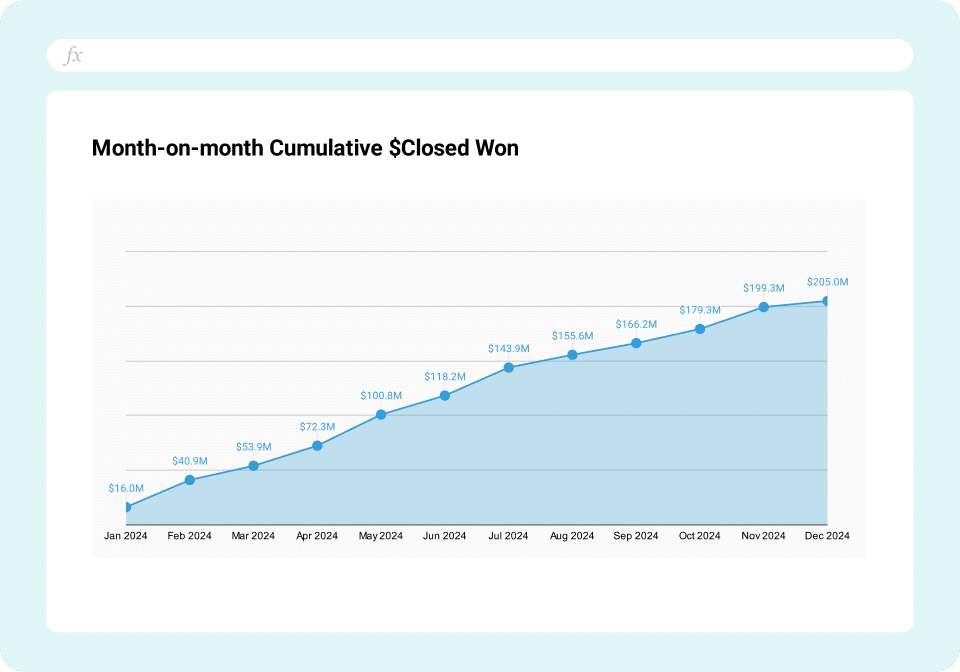
- Performance Comparison: Compare current and past performance with month-over-month metrics
- Quick Problem Detection: Spot declining metrics early and take action
Metrics Tracked in the Report
Key Performance Indicators:
- Total Activities (vs. Last Month)
- Contacts (vs. Last Month)
- Leads Generated
- Open Opportunities
- Follow-up Rate
- Average Response Time
- Average Time to Close
- Average Deal Size
Detailed Breakdowns:
- Top 5 Deals
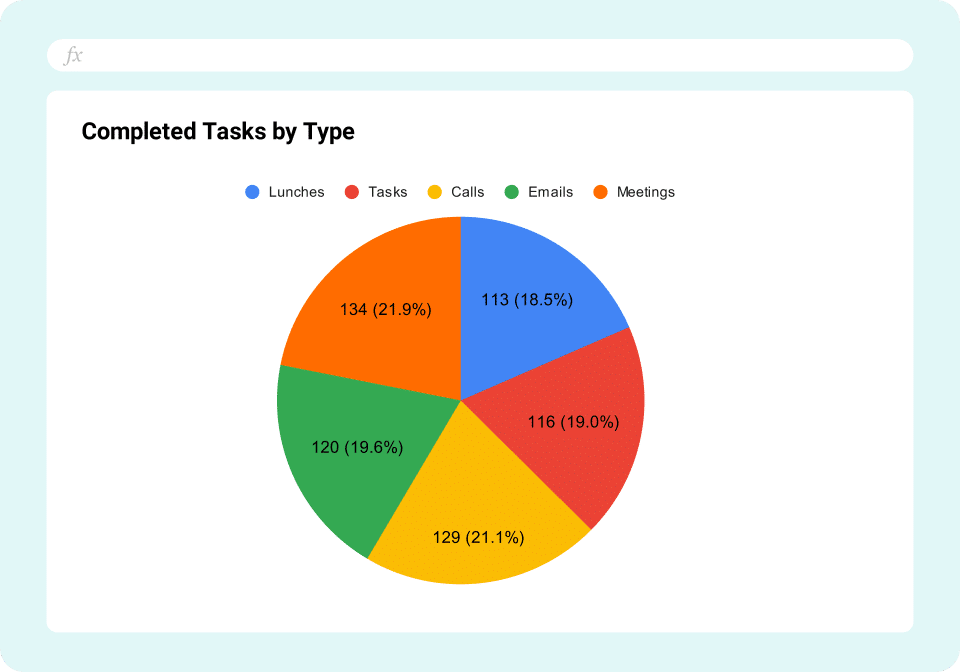
- Completed Activities (Meetings, Calls, Tasks, Lunches, Emails)
- Pipeline Stages
- Activities Summary with timestamps and status
