


Table of Contents
![]()
-
Financial reporting automation: Save time and reduce errors
- Why financial reporting automation matters
- What can be automated in financial reporting
- Key features of automated financial reporting software
- Benefits of financial reporting automation
- Challenges of implementing automated financial reporting
- Types of financial reporting automation tools
- How to choose the right financial reporting automation tool
- Coefficient for financial reporting automation
- Real-world applications of financial reporting automation
- Future of financial reporting automation
- Start automating your financial reports


Finance teams waste hours each week on manual exports and copy-paste work. They pull data from systems like NetSuite or QuickBooks, transform it in spreadsheets, and build the same reports over and over. This approach is slow, error-prone, and keeps skilled teams stuck on repetitive tasks instead of strategic analysis.
Financial reporting automation solves this by connecting business systems directly to reporting tools. It eliminates manual data work and keeps reports current without human intervention.
This guide covers why automation matters, what you can automate, and the top tools for the job.
Why financial reporting automation matters
Manual reporting processes can’t keep up with modern business demands.
Time savings at scale
Mid-market finance teams spend 20+ hours weekly on manual data work. Month-end close takes 6 to 10 days. Mike Lynch at Thornton Capital spent 10 days downloading reports across 16 QuickBooks files. After implementing automation, his team cut that time to 3 days. Automation scales seamlessly as you add entities, currencies, or transaction volumes.
Accuracy and trust
Manual data entry introduces errors. Automated validation catches discrepancies before reports go out. Direct connections eliminate transcription mistakes.
Real-time visibility
Reports go stale the moment you finish them. Automated refresh gives you always-current dashboards showing cash flow, revenue, and profitability metrics as they change.
Strategic focus
Automation frees finance teams for analysis. Sam Sholeff at Cyrq Energy saved several hours weekly after automating NetSuite data pulls. His team now focuses on financial analysis instead of data manipulation.
What can be automated in financial reporting
Most financial reporting tasks can run automatically.
Financial statement preparation
Income statements, balance sheets, and cash flow statements require data from multiple sources. Automation pulls that data on a schedule and populates your templates. You can build P&L dashboards that update hourly or daily. Multi-entity consolidations happen automatically with currency conversions and intercompany eliminations.
Financial analysis
Scenario planning takes time when done manually. Automated what-if analysis lets you test scenarios instantly.
Cyrq Energy automated their NetSuite reporting for an infrastructure sponsor. They manage multiple geothermal power plants across the western US with substantial reporting requirements. By automating data pulls, they perform 80% of data cleaning directly in their ERP before pulling to Excel. This gives them faster, more accurate spreadsheets that update in days instead of months.
Management and operational reports
Finance teams build MRR dashboards with real-time data from Stripe or subscription platforms. KPI tracking for ARR, CAC, and LTV stays current without exports. Budget versus actual reports update automatically as transactions post.
Key features of automated financial reporting software
Live data connections
The best platforms connect directly to your business systems through APIs. When a transaction posts, your reports reflect it immediately.
Scheduled refresh and automation
Your tool should update reports on a schedule you set. Daily refreshes work for management reports. Month-end close might need hourly updates.
Data transformation capabilities
Good automation tools clean and transform data without code. You filter records, join tables, aggregate values, and apply business logic.
Alerts and notifications
Set thresholds for key metrics and get notified when they’re crossed. Your team gets alerts when AR aging exceeds targets or cash balances drop below minimums.
Benefits of financial reporting automation
Faster close cycles
Thornton Capital reduced their month-end close from 10 days to 3 days. That’s a 70% reduction. CFO Mike Lynch saved 20 hours monthly on consolidation work across their 16 QuickBooks files.
Cost reduction
Cyrq Energy saved more than $50,000 annually in software costs by switching from expensive enterprise tools. You also reduce audit fees through better documentation and controls.
Enhanced collaboration
Shared dashboards create a single source of truth. All stakeholders see the same data at the same time. Real-time access eliminates email chains with conflicting spreadsheet versions.
Challenges of implementing automated financial reporting
Data quality issues
Automation exposes data quality problems. Inconsistent naming, duplicate records, and formatting differences cause errors. The solution is to clean data at the source. Implement validation rules in your ERP or CRM. Cyrq Energy handles 80% of data cleaning in NetSuite before pulling to Excel.
Change management resistance
Teams resist new processes. Choose tools that preserve familiar interfaces. Coefficient lets finance teams keep using Excel templates while adding automation underneath. Involve users in tool selection and demonstrate quick wins to build momentum.
Integration complexity
Multiple systems that don’t communicate create integration challenges. Use platforms with pre-built connectors. Coefficient offers 70+ native integrations to business systems. This eliminates custom integration work and reduces implementation time from months to days.
Types of financial reporting automation tools
Spreadsheet-based automation tools
These tools connect live data to Excel or Google Sheets. They’re ideal for teams that want automation without leaving their spreadsheet environment.
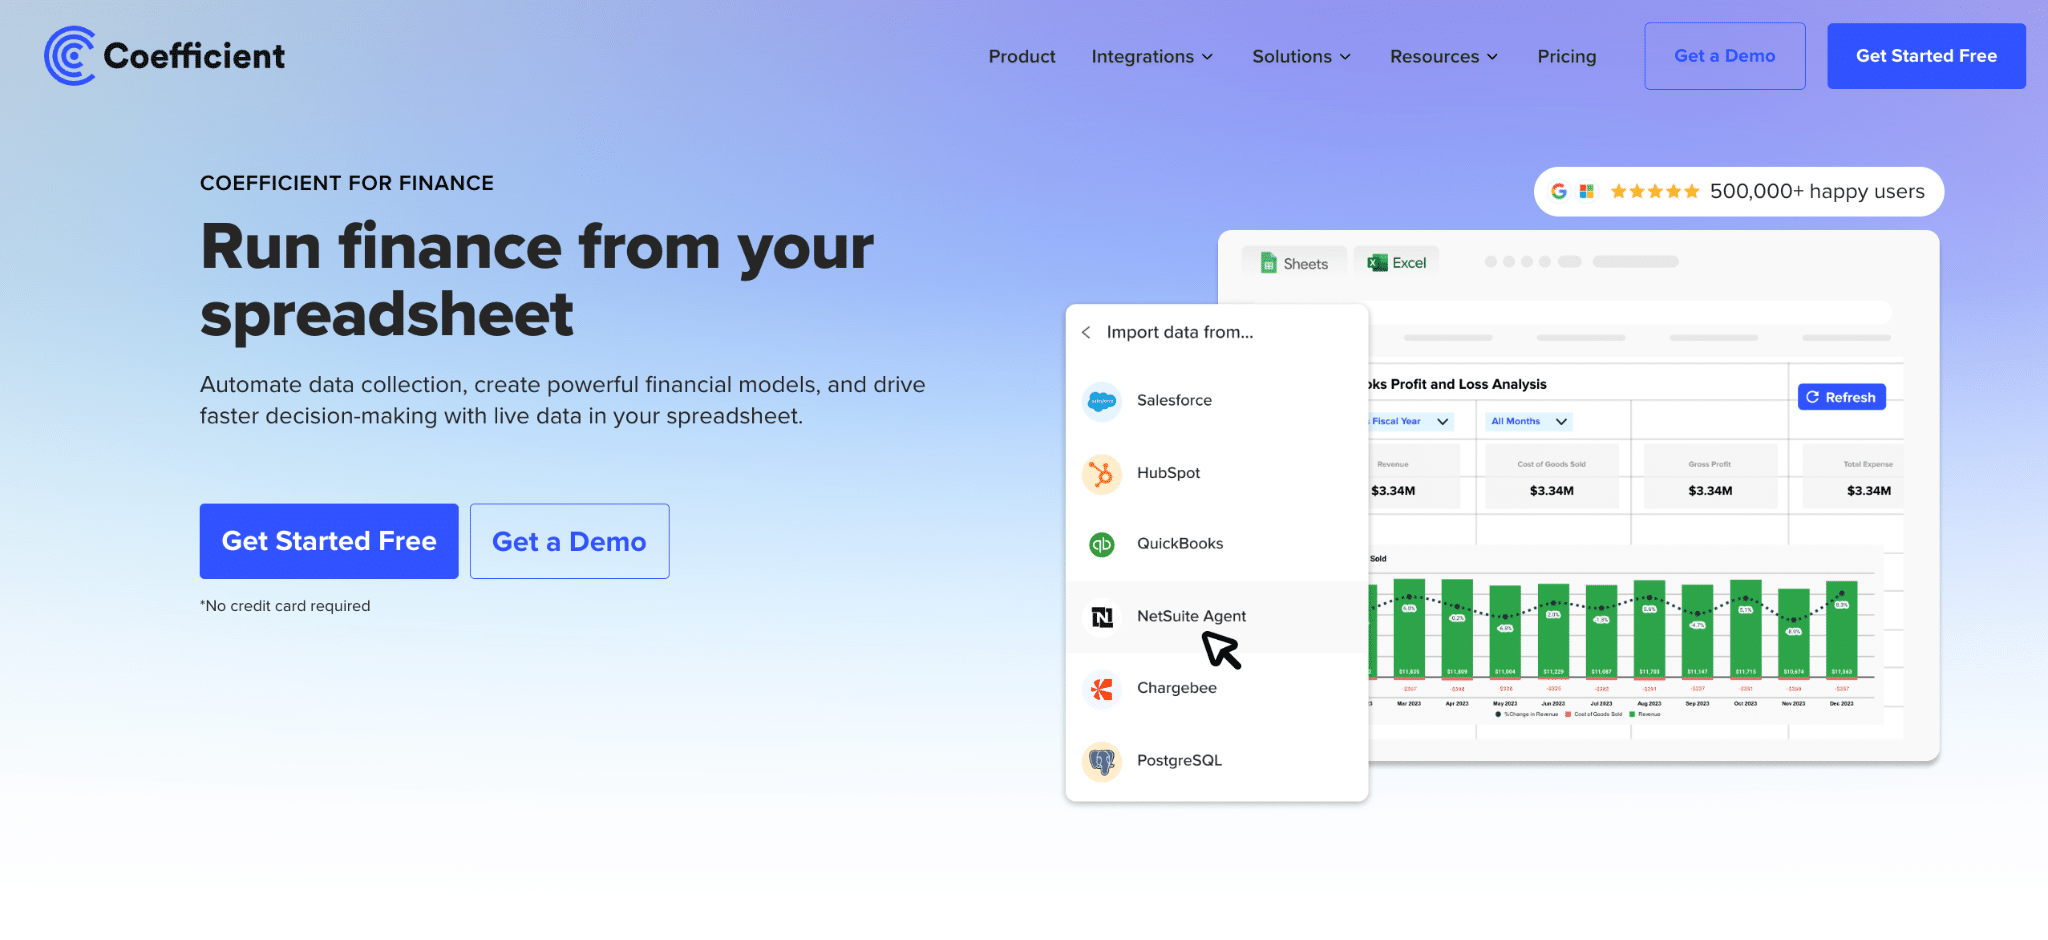
Coefficient
Coefficient connects spreadsheets to live data from 70+ business systems including NetSuite, Sage Intacct, QuickBooks, Snowflake, and Salesforce.
Highlights: Live data connections through Chrome extension. Automated refresh hourly, daily, or weekly. Two-way sync writes data back. Pre-built financial templates.
Pros: No learning curve for Excel users. Setup takes minutes. 70+ native integrations. Cost-effective compared to enterprise tools.
Cons: Inherits Excel row limits. Requires source system access permissions.
Pricing: As of December 2025, contact for pricing. Plans scale with users and data sources.
Python in Excel
Microsoft added Python support in Excel for code-based automation.
Highlights: Run Python code in Excel cells. Access pandas and matplotlib libraries. Results display in worksheet.
Pros: Advanced analytics without exporting data. Users who know Python can automate workflows.
Cons: Requires programming skills. Cloud execution only. Still in preview.
Pricing: As of December 2025, included with Microsoft 365 ($10-$20 per user monthly).
Power Query
Power Query is built into Excel and provides data transformation capabilities.
Highlights: Native Excel integration. Visual interface for data transformations. Query folding optimizes performance.
Pros: Free with Microsoft 365. Powerful data cleaning capabilities.
Cons: Windows only for full features. Steep learning curve. No automatic scheduling without Power Automate.
Pricing: As of December 2025, free with Microsoft 365 ($10-$20 per user monthly).
FP&A platforms
These platforms focus specifically on financial planning and analysis workflows.
Anaplan

Anaplan is an enterprise scenario planning platform for finance, supply chain, and sales operations.
Highlights: AI-powered scenario modeling. Real-time data aggregation. Multi-dimensional planning across departments. Hyperblock technology for complex calculations.
Pros: Handles massive datasets. Highly flexible modeling capabilities. Strong enterprise collaboration features.
Cons: Steep learning curve requiring extensive training. Very expensive. Long implementation timelines.
Pricing: As of December 2025, entry-level starts around $30,000-$50,000 annually. Enterprise deployments average $200,000+ per year according to Vendr.
Datarails

Datarails is an Excel-native FP&A platform combining data consolidation, reporting, budgeting, and forecasting.
Highlights: Preserves existing Excel models. AI-powered Genius assistant. 200+ integrations. Multi-entity consolidation.
Pros: No Excel rebuild needed. Strong consolidation features. Significant automation.
Cons: No transparent pricing. Requires setup time. FP&A focus only.
Pricing: As of December 2025, $25,000 to $50,000+ annually for mid-market.
Cube
Cube is a spreadsheet-native FP&A platform that integrates with Excel and Google Sheets for cloud-based automation.
Highlights: Native Excel and Google Sheets integration. AI-powered insights and forecasting. Slack and Teams apps for collaboration. No-code model building.
Pros: Fast implementation in weeks. Familiar spreadsheet interface. Strong customer support. Good for small to mid-sized businesses.
Cons: Limited headcount planning module. Dashboards less robust than dedicated BI tools. Can outgrow for larger enterprises.
Pricing: As of December 2025, custom pricing starting around $1,500 per month. Annual costs typically $15,000 to $45,000+.
ERP systems
Enterprise resource planning systems manage full financial operations including reporting.
Oracle NetSuite
Oracle NetSuite is a comprehensive cloud ERP unifying financials, CRM, e-commerce, and inventory.
Highlights: Unified ERP platform. Real-time dashboards. Saved Searches and SuiteQL for custom reporting. Multi-subsidiary consolidation.
Pros: Full ERP solution. Scales from small business to enterprise. Highly configurable.
Cons: Steep learning curve. High total cost. Long implementation timeline. Reporting requires training.
Pricing: As of December 2025, base license $999 to $2,999 monthly. Per-user $99 to $199 monthly. First-year cost $50,000 to $200,000+ for mid-market.
Sage Intacct
Sage Intacct is a cloud ERP designed for mid-market businesses with strong multi-entity capabilities.
Highlights: Multi-entity dimensional reporting. Real-time dashboards. Automated workflows. Hundreds of native integrations.
Pros: Best-in-class multi-entity management. Flexible dimensional reporting. True cloud platform.
Cons: Steep learning curve. Quote-based pricing. May need custom integrations.
Pricing: As of December 2025, $20,000 to $50,000+ base subscription annually. Total first-year cost $50,000 to $150,000+.
SAP S/4HANA
SAP S/4HANA is an enterprise ERP built on in-memory database technology for real-time financial processing.
Highlights: Real-time Universal Journal. AI-powered automation for journal entries. Group consolidation and reporting. Deep integration across finance, supply chain, and HR.
Pros: Handles complex enterprise requirements. Real-time financial insights. Strong compliance and audit features. Scales for global organizations.
Cons: Very expensive. Long implementation timelines (often 12+ months). Requires specialized consultants. Overkill for mid-market companies.
Pricing: As of December 2025, cloud subscriptions start around $120 per user monthly. On-premise licenses can exceed $1 million upfront plus 22% annual maintenance. Total first-year cost for mid-market typically $100,000 to $500,000+.
Specialized reporting tools
Business intelligence platforms focus on data visualization and dashboards.
Tableau
Tableau is a leading data visualization platform known for intuitive visual analytics.
Highlights: Best-in-class visualization. Tableau Agent AI assistant. Connects to any data source. Mobile-optimized dashboards.
Pros: Industry-leading interactive dashboards. Intuitive interface. Flexible deployment options. Extensive training resources.
Cons: Expensive at $75 per user monthly. Performance issues with large datasets. Complex calculations require expertise.
Pricing: As of December 2025, Creator ($75 monthly), Explorer ($42 monthly), Viewer ($15 monthly).
Power BI

Microsoft Power BI is a business intelligence platform connecting to hundreds of data sources.
Highlights: AI-powered analytics with Copilot. Deep Microsoft integration. Hundreds of connectors. Drag-and-drop report building.
Pros: Most affordable at $10-$20 per user monthly. Seamless Office 365 integration. Natural language dashboard building.
Cons: Windows only for authoring. Complex DAX formula language. Performance issues with large datasets.
Pricing: As of December 2025, Free ($0), Pro ($10 monthly), Premium ($20 monthly), Capacity ($4,995 monthly).
Looker
Looker (now part of Google Cloud) is an enterprise BI platform with a powerful semantic modeling layer.
Highlights: LookML modeling language for consistent metrics. Real-time queries against source databases. Embedded analytics capabilities. Strong data governance features.
Pros: Excellent reporting and drill-down capabilities. Creates single source of truth through semantic layer. Integrates well with BigQuery and cloud warehouses.
Cons: Expensive starting around $60,000+ annually. Steep learning curve with LookML. Limited visualization customization compared to Tableau.
Pricing: As of December 2025, Standard Users approximately $60 per user monthly, Developer Users approximately $125 per user monthly. Enterprise pricing starts around $60,000+ annually.
How to choose the right financial reporting automation tool
Assess your current pain points
Start with what hurts most. If month-end close takes too long, focus on close automation. If manual exports consume time, prioritize data connectivity.
Consider technical capabilities
Teams without coding skills need no-code tools. Spreadsheet-based platforms work well for finance teams comfortable in Excel.
Evaluate system compatibility
Your tool must connect to the systems you use. Pre-built integrations save months of custom development work. If you run NetSuite, look for robust NetSuite integration.
Factor in implementation time
Quick wins matter for proving ROI. Tools that install in minutes get faster adoption. Balance power with speed.
Calculate total cost of ownership
Look beyond license fees. Factor in implementation costs, training time, and maintenance. Mid-market companies often find better ROI with tools at $5,000 to $30,000 annually versus enterprise platforms at $100,000+.
Coefficient for financial reporting automation
Coefficient connects your spreadsheets to live business data. Finance teams automate reporting without leaving Excel or Google Sheets.
Live data connections to 100+ systems
Connect QuickBooks, NetSuite, Xero, Stripe, Salesforce, and 100 more business systems directly to spreadsheets. Your finance team pulls current data in seconds instead of exporting CSVs and copy-pasting.
The platform uses APIs to access data in real time. When transactions post in your accounting system or deals close in your CRM, your reports reflect it immediately.
Automated report refresh and scheduling
Schedule reports to refresh hourly, daily, or weekly. Set it once and forget it. Your team opens spreadsheets to find current data already there.
Alerts notify you via Slack or email when key metrics cross thresholds. Your AR team knows immediately when aging exceeds targets. Your CFO gets alerts when cash balances need attention.
Pre-built financial dashboard templates
Start with ready-to-use templates for income statements, balance sheets, cash flow reports, and budget versus actuals. The template gallery includes dozens of options. Connect your data source and the template populates automatically.

Real-world applications of financial reporting automation
Month-end close process
Manual consolidation across multiple entities consumes days each month. Thornton Capital manages 16 separate QuickBooks files covering real estate, equities, private investments, and family operations. Their month-end close took 10 days before automation.
After implementing Coefficient, Thornton Capital cut their close to 3 days. CFO Mike Lynch saves 20 hours monthly. “We use Excel templates just like before but now they refresh automatically from QuickBooks. I can fix a journal entry, hit refresh, and have updated financials in seconds.”
Board and investor reporting
Cyrq Energy manages multiple geothermal power plants with substantial reporting requirements. Their lean 20-person office needed enterprise-grade reporting without enterprise costs.
They implemented Coefficient for direct NetSuite-to-Excel connectivity. The team performs 80% of data cleaning in NetSuite before pulling to Excel. Cyrq Energy saved more than $50,000 annually while delivering faster, more accurate board reports.
Multi-entity consolidation
Companies with multiple subsidiaries, currencies, or jurisdictions face complex consolidation requirements. Manual processes break down as complexity grows. Automation handles currency conversion, intercompany eliminations, and local reporting requirements simultaneously.
Christian Budnik, FP&A Analyst at Solv, used Coefficient to combine data from Salesforce, Looker, and QuickBooks into unified financial dashboards. His team saved 364 hours per year by eliminating manual data imports.
Future of financial reporting automation
AI agents will change how finance teams interact with data. Machine learning already helps with anomaly detection, flagging unusual transactions automatically. Predictive analytics improve forecast accuracy by learning from historical patterns.
AI-powered natural language queries let non-technical users ask questions in plain English. Tools like Power BI Copilot and Tableau Agent enable anyone to build dashboards by describing what they want.
The next wave focuses on automated insight generation. Instead of building dashboards to find problems, AI will tell you what needs attention. Continuous accounting will replace period-based closes, making financial position visible any day of the month.
Start automating your financial reports
Financial reporting automation saves time, reduces errors, and gives you real-time visibility into business performance. The technology works. Companies across industries prove it every day.
Start with your biggest pain point. If month-end close drags on, automate consolidation first. If manual exports consume time, connect your systems to spreadsheets. If executives need current data, enable real-time refresh.
Choose tools that fit your team’s skills and your budget. Spreadsheet-based platforms work for most mid-market finance teams. They deliver quick wins without long implementations.
Get started with Coefficient to connect your business systems to spreadsheets and automate your financial reporting today.
