Basic bookkeeping is a critical function for business finances. Organizations need to accurately keep track of and report their financial data. While there are various accounting software solutions available for your organization’s accounting system needs, Microsoft Excel remains a popular choice.
Excel spreadsheets offer many functions for an organization and can be an excellent low-cost option for small business owners. Additionally, Excel accounting is a commonly used platform across all organizations, and most bookkeepers are familiar with its functionality.
In this tutorial, you’ll learn how to set up a bookkeeping system in Excel. Whether you’re a self-employed professional or managing a small business, this guide will help you create an organized system for tracking your financial transactions.
Detailed Guide: Bookkeeping in Excel
Before diving into setup, it’s important to understand the difference between single-entry and double-entry bookkeeping. Single-entry systems work like a checkbook, tracking money in and out. Double-entry accounting provides more accurate records by tracking both sides of each transaction. Most businesses benefit from using double-entry bookkeeping in their Excel template.
In order to do bookkeeping in Excel you will have to set-up the following:
- Chart of Accounts – Lists all of the general ledger accounts that make up your financial statements and business transactions categories. This serves as the foundation of your accounting system.
- Transactions – Contains all the details behind sales, purchases, payroll, and other financial transactions. For your transactions, you will want to have as much information as possible to classify each transaction appropriately. Many businesses track details like invoice numbers, payment methods, and transaction dates.
- Income Statement – Consolidates transactions and reports your chart of accounts in a digestible format that shows revenue, cost of goods sold, and other expenses over a certain period or date range. This crucial financial report helps track profitability.
- Balance Sheet – Consolidates transactions and reports your chart of accounts in a format that shows the assets, liabilities, and equity of a business at a point in time. Think of it as a snapshot of your company’s financial position.
- Journal Entry – Records the business transactions that happen in your business. Each journal entry will have both debit(s) and credit(s) and should always balance where the debits equal your credits. This is the foundation of double-entry bookkeeping.
Chart of Accounts Setup in Excel
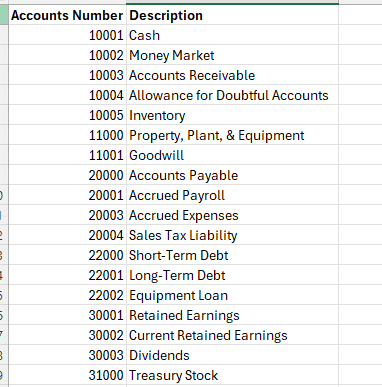
To set up your chart of accounts, first create a new Excel workbook. Start by creating relevant general ledger account numbers for your business. Depending on your business type, your account numbers and descriptions may vary.
For example, a manufacturing company tracking cost of goods sold would want different revenue and expense accounts than a CPA firm offering bookkeeping services. Their balance sheet would also differ significantly depending on whether they are an asset-based or service-based business.
When setting up your chart of accounts, develop a logical number sequence and group similar accounts.
For example, an organization might use a 5-digit system: assets (10000-19999), liabilities (20000-29999), equity (30000-39999), revenue (40000-49999), labor (50000-59999), and other expenses (60000-99999). This systematic approach makes data entry more efficient and reduces errors.
Your Excel workbook should include separate sheets for different components. Consider creating:
- A master chart of accounts sheet
- A cash book for tracking daily transactions
- An accounts receivable aging report
- An accounts payable tracking sheet
- Various income statement views
- A detailed balance sheet
All journal entries posted in your chart of accounts need to balance. In double-entry bookkeeping, every type of transaction has a normal balance. This means each account typically posts as either a debit or credit when recording a journal entry:
- Revenue has a normal account balance of a credit
- Business expenses have a normal account balance of a debit
- Assets have a normal account balance of a debit
- Liabilities have a normal account balance of a credit
- Equity has a normal account balance of a credit

Your chart of accounts will most likely be a fluid list that you are consistently updating as your business changes and you have new streams of revenue or types of expenses as well as new transactions that may not have previously happened in your business like a new loan taken out or type of equipment purchased. You can use a Chart of Accounts template powered by your live data to ensure the process is smooth and automated.
Managing Transactions
Transactions – The financial events that happen in your organization in a given timeframe. Each transaction needs an account from the chart of accounts to properly track it in your financial reports through your income statement or balance sheet. Using Excel templates can help standardize this process.
Revenue – For every sale that your organization makes you will need to account for that in the income statement and balance sheet. When a sale is made you would need to debit accounts receivable (asset) and credit one of your revenue accounts.
This will record the revenue in the income statement and the corresponding amount owed from your customer as an asset on the balance sheet. Once your customer pays you for that particular invoice you would debit the cash received (asset) and credit the accounts receivable (asset) to clear that invoice out of your receivables balance.
Payroll – When your organization pays employees, record the salaries as labor expense by debiting it and crediting the bank account as you pay employees. Many businesses use separate accounts for different types of compensation and benefits.
Expenses – Your organization likely has payment terms with vendors. For each vendor service, record the expense by debiting the corresponding account (trash expense, consulting expense, repair expense, etc.). Then record a liability by crediting payable to show the amount owed on your balance sheet. Credit card expenses should be tracked separately for easy reconciliation.
Consider this example of a $500 office supply purchase on a company credit card:
- Debit Office Supplies Expense: $500
- Credit Credit Card Payable: $500
When you pay the credit card bill:
- Debit Credit Card Payable: $500
- Credit Bank Account: $500
Assets – assets are typically recorded as part of a sales transaction where you post accounts receivable or bank account deposits from a customer.
You may also record an entry to assets when you purchase property, plant, or equipment for your business. This could be a manufacturing company buying a brake press for one of their factories.
In this scenario, you would record the equipment on your balance sheet by debiting the corresponding asset account and credit either cash, if you are buying that piece of equipment with cash, or a note payable/debit account to record a liability for the amount owed to the vendor or a lender.
Liabilities – liabilities are typically recorded as part of a vendor transaction where you are posting accounts payable or cash going out to a vendor.
You may also record an entry by posting a credit to your liabilities when you purchase an asset or take debt out. In this scenario, you would record a debit for the asset to record it on the balance sheet, or in the case of debt, you would record a debit to cash.
Income Statement Organization
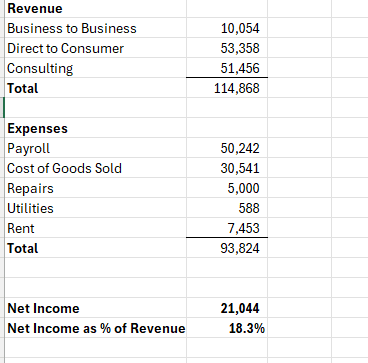
Once you’ve recorded transactions and classified them under the correct accounts, you can consolidate them into an income statement. This reports your revenue, expenses, and net income over a specific period. Many businesses use pivot tables to analyze their financial results from different angles.
In order to set up an income statement in Excel you would want to link the corresponding transactions to the correct category in your income statement. An example of what your income statement could look like if you are doing your bookkeeping in Excel would be.

Balance Sheet
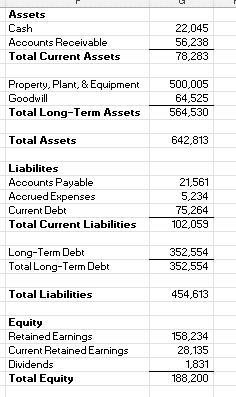
Once you’ve recorded your transactions, you will also be able to consolidate those transactions into the balance sheet. The difference between an income statement and a balance sheet is that your income statement reports transactions over a specified period of time, and your balance sheet reports balances at a specific point in time. Your balance sheet will report the assets, liabilities, and equity of your business at that specific point of time.
In order to set up your balance sheet in Excel, you will want to link the corresponding transactions to the correct category in your balance sheet. An example of your balance sheet if you are doing your bookkeeping in Excel is below.
Your balance sheet should always equal zero when you take your assets minus your liabilities minus equity. If you take assets minus liabilities minus equity and it doesn’t equal zero you are missing a transaction in your balance sheet.

Use Cases for Bookkeeping in Excel
Bookkeeping with Excel can help businesses:
- Provide a low-cost option for small business owners and self-employed individuals
- Perform bookkeeping in an accessible platform with broad usage
- Create custom financial reports for different stakeholders
- Integrate with Coefficient for real-time analysis and sophisticated financial reporting
- Transition from expensive platforms like Quickbooks or Xero
Improve Your Bookkeeping in Excel
Business bookkeeping forms the backbone of companies and guides important decisions as they scale. Excel is vital across organizations, making it sensible for bookkeeping. Excel works well for small businesses starting out or those who want an alternative to expensive accounting software and integrates with tools like Coefficient.
Ready to take your bookkeeping to the next level?
Try Coefficient to seamlessly integrate your Excel with live data from various business systems, enabling real-time analysis and more advanced financial modeling.


