
Managing your company’s chart of accounts in QuickBooks can be complex and time-consuming. Coefficient’s free QuickBooks Chart of Accounts template simplifies this process, allowing you to organize and track your financial data with ease.
Metrics Tracked in the Report
Our QuickBooks Chart of Accounts template tracks essential financial metrics, including:
- Account Name
- Balance
- Currency
- Description
- Detail Type
- Account Type
How to use the Template
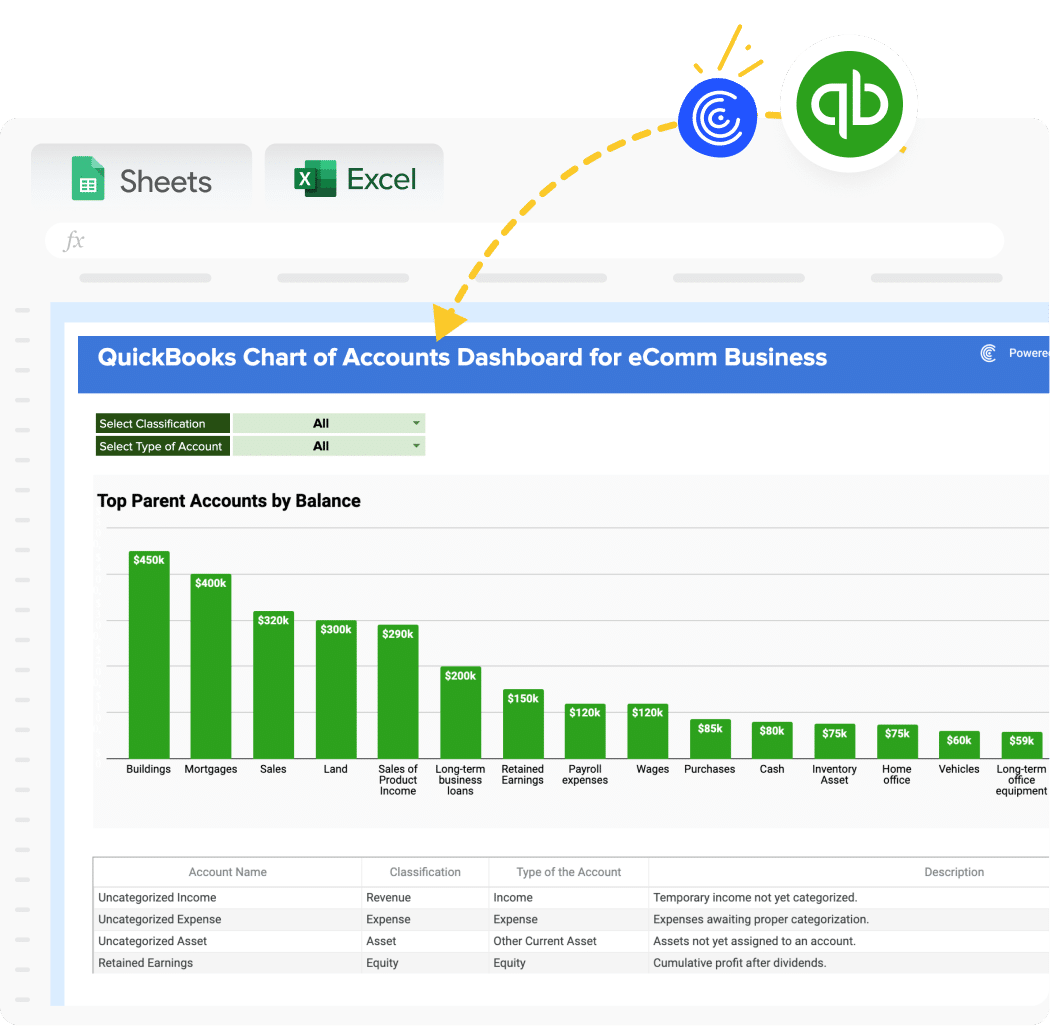
Getting started is simple. Download the template. Connect your QuickBooks data. Your chart of accounts comes to life instantly.
The template works seamlessly with Coefficient’s QuickBooks integration. No complex setup required. No manual data entry. Just clean, organized financial data that updates automatically.
Watch this walkthrough to see exactly how it works:
Benefits of using QuickBooks Chart of Accounts Template
- Streamlined Account Organization: Our template provides a pre-structured format, saving you time in setting up your accounts and ensuring consistency across your financial records.
- Real-time Data Updates: With Coefficient’s integration, your Chart of Accounts stays up-to-date automatically, pulling live data from QuickBooks for accurate financial snapshots.
- Customizable Structure: Easily adapt the template to fit your specific business needs, adding or modifying account categories as required.
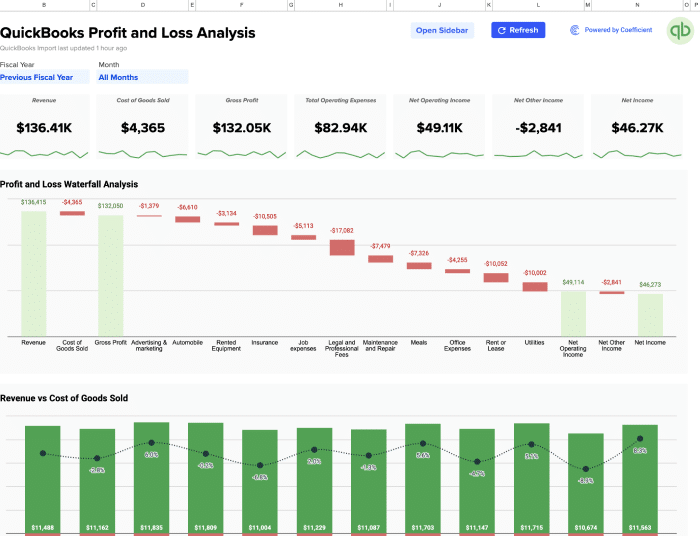
- Enhanced Financial Visibility: Get a clear overview of your company’s financial structure, making it easier to analyze your financial health and make informed decisions.
- Simplified Reporting: Use the well-organized chart of accounts to generate accurate financial reports quickly, saving time during month-end closings and tax seasons.
What is a Chart of Accounts Report?
A Chart of Accounts (COA) report is a financial organization tool that lists all the accounts used by a company to record transactions in its general ledger. It provides a clear, organized view of every area of your business that spends or makes money. In QuickBooks, the COA serves as the foundation for all your financial reports, helping you categorize income, expenses, assets, and liabilities for accurate financial statements and tax reporting.
How to make a chart of accounts in Excel?
Creating a chart of accounts in Excel gives you flexibility and control over your financial organization. Start with a simple structure. Build from there.
Step 1: Set up your columns Create headers for Account Number, Account Name, Account Type, and Description. This basic structure forms your foundation.
Step 2: Organize by account types Group your accounts into five main categories: Assets, Liabilities, Equity, Revenue, and Expenses. Use numbering systems to keep everything organized.
Step 3: Add account details Fill in specific accounts under each category. Cash accounts, accounts receivable, inventory for assets. Accounts payable, loans, credit cards for liabilities.
Step 4: Use consistent formatting Apply clear formatting rules. Bold headers. Different colors for account types. Consistent number formatting for balances.
Step 5: Connect to your data With Coefficient, you can link your Excel chart of accounts directly to QuickBooks. Live data flows automatically. No manual updates needed.
The beauty of Excel lies in its customization options. You can create pivot tables, add formulas, and build custom reports that match your exact business needs.