
Unlock Sales Insights Instantly with Coefficient’s Free Weekly Sales Report Template
Are you struggling to keep track of your team’s sales activities and performance? Do you find yourself spending hours manually compiling data from various sources just to get a clear picture of your sales pipeline? Say goodbye to those headaches with Coefficient’s Sales Weekly Report Template for Google Sheets.
Benefits of Using a Sales Weekly Report Template
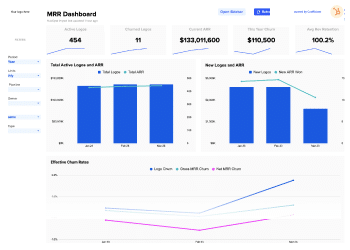
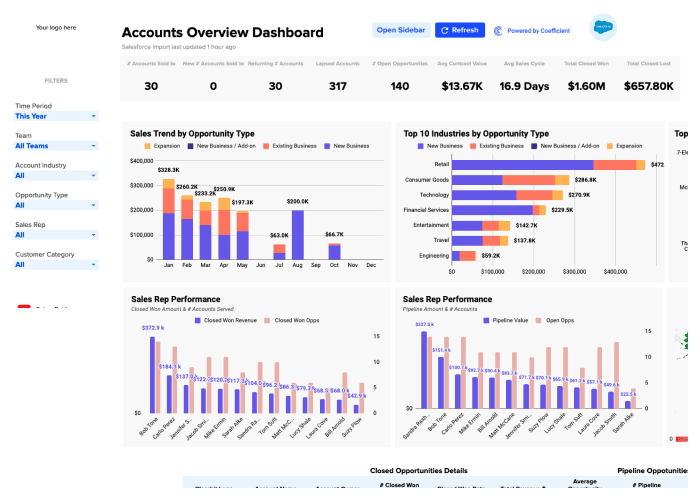
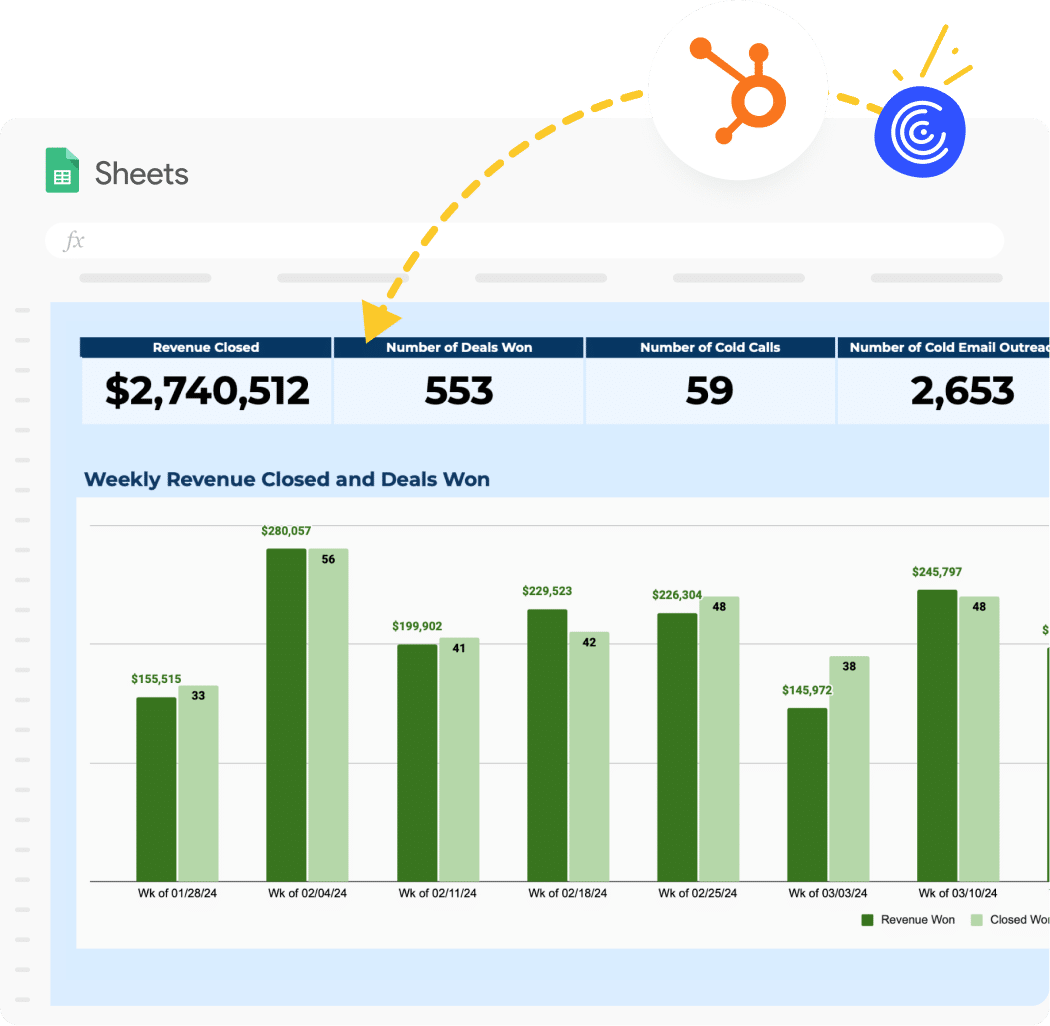
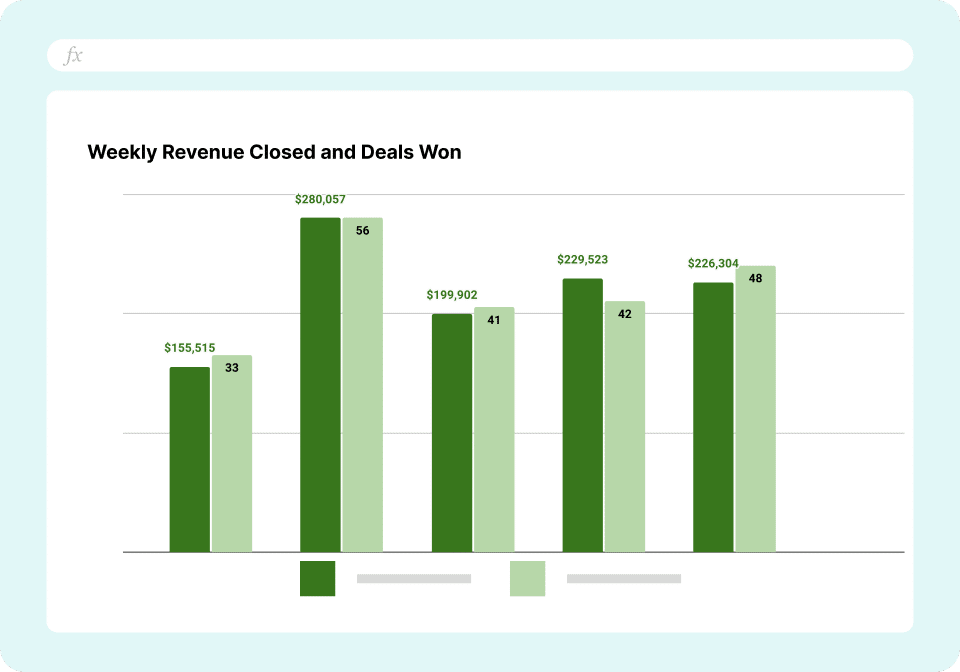
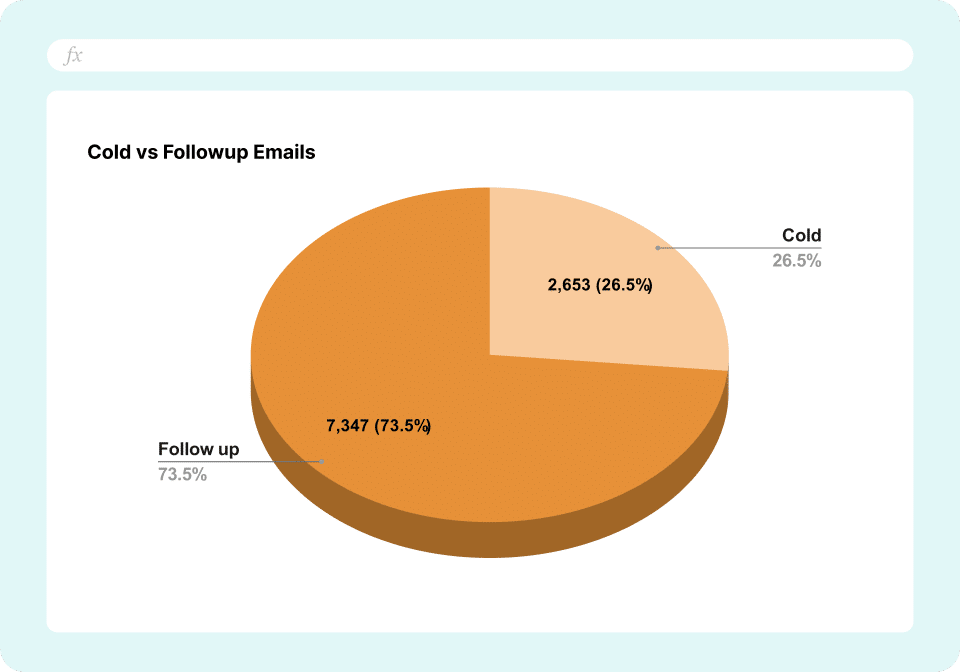
- Gain a comprehensive view of your sales funnel by tracking key metrics such as cold calls, email outreaches, demos, follow-ups, deals in progress, revenue closed, and more.
- Identify trends and opportunities by analyzing weekly sales data, allowing you to make data-driven decisions to optimize your sales strategy.
- Save time and reduce errors by automating the process of gathering and organizing sales data from HubSpot and other sources into a centralized, easy-to-read report.
How to use the Weekly Sales Report Template
Getting started takes minutes. Here’s exactly how to set up your template and connect your live data:
Who is this template built for?
Sales managers who need instant visibility into team performance. Track individual rep metrics, identify coaching opportunities, and forecast pipeline health without building reports from scratch.
RevOps teams drowning in data requests. Give sales leaders self-serve access to the metrics they need. Spend less time pulling reports and more time driving strategic initiatives.
Small business owners wearing multiple hats. You don’t have time to become a data analyst. This template gives you professional-grade reporting without the complexity or cost.
What is the format of a Weekly Sales Report?
A weekly sales report follows a structured format designed for quick scanning and actionable insights. The template includes:
Performance snapshot at the top showing week-over-week changes in key metrics. Activity metrics tracking calls, emails, and meetings by rep. Pipeline progression displaying deals by stage with velocity metrics. Win/loss analysis breaking down closed deals by source, size, and rep. Trending charts visualizing performance over time to spot patterns instantly.
Each section uses visual indicators—colors, charts, conditional formatting—to highlight what needs attention. No hunting through rows of numbers.
How to read a Weekly Sales Report?
Start with the performance snapshot. Red means below target, green means on track. Check activity metrics against goals—low activity predicts future pipeline problems. Review pipeline velocity to spot stuck deals. Compare win rates across reps to identify training needs. Look for week-over-week trends rather than absolute numbers.
Advantages of Using Spreadsheets for Sales Tracking
- Collaborate seamlessly with your team by leveraging real-time co-editing and commenting features, ensuring everyone is aligned on sales goals and progress.
- Access your sales data from anywhere with Google Sheets’ cloud-based platform, allowing you to monitor performance and make decisions on-the-go.
- Customize your reporting to fit your needs with spreadsheets’ flexible formatting and formula options, enabling you to create reports that are tailored to your unique sales process.
FAQs
How to generate a Weekly Sales Report automatically?
Connect your CRM directly to Google Sheets or Excel with Coefficient. Your sales data flows automatically into pre-built templates that update in real-time. No manual exports, no copy-paste, just live reports that build themselves.
How to create a sales report template?
Start with Coefficient’s pre-built templates or customize your own. Pull live data from HubSpot, Salesforce, or any CRM. Add formulas, charts, and conditional formatting. Share with your team for instant collaboration. Templates update automatically as your data changes.
Where can I find sales report templates for my CRM?
Coefficient offers free templates for HubSpot, Salesforce, Pipedrive, and 70+ other platforms. Each template connects directly to your CRM for live data. Download once, use forever. Find templates at coefficient.io/dashboard-examples or start building your own with live data connections.