Salesforce reporting is rigid. Sharing dashboards requires extra licences. Blending pipeline data with marketing spend or financial data inside Salesforce is painful. Looker Studio fixes all of that with custom layouts, shareable links, blend any data source. The problem: Looker Studio has no native Salesforce connector. Every method involves a workaround. This guide covers three — including one that costs nothing and keeps your dashboards automatically current.
Why There’s No Native Salesforce Connector for Looker Studio
Salesforce and Google have not built a native integration. Every refresh is either manual, paid or requires a third-party tool. One thing to flag upfront: as of September 2025, Salesforce requires a Salesforce admin to explicitly install any third-party connected app before users can authenticate. It is a one-time step that takes under five minutes — but it applies to all three methods below. Before choosing a method, it is also worth understanding whether Looker Studio is actually free once connector fees are factored in.
Method 1: Coefficient + Google Sheets — Free and Keeps Data Live
How it works
Coefficient pulls live Salesforce data into Google Sheets on a refresh schedule. Google Sheets then connects to Looker Studio via the free native Sheets connector. Live pipeline dashboards, quota reports and activity tracking in Looker Studio — at zero connector cost.
Step-by-step setup
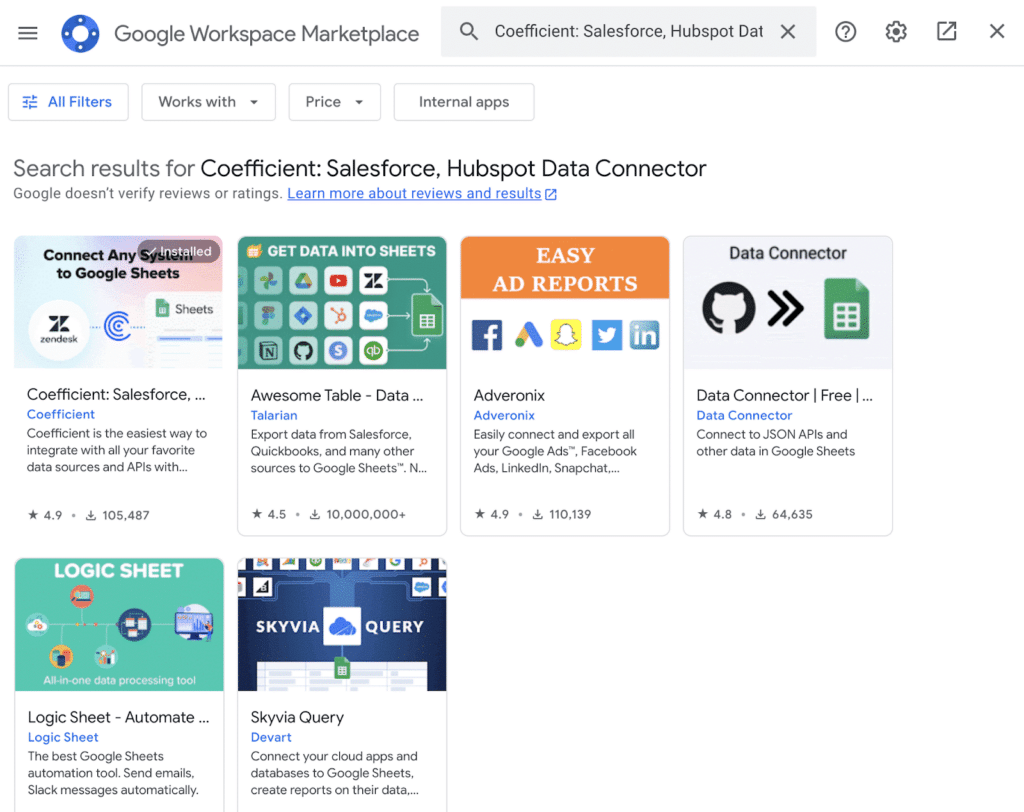
- Step 1: Install Coefficient from Extensions > Add-ons > Get add-ons in Google Sheets (or File > Get Add-ins in Excel). Launch from the Extensions menu.
- Step 2: In the Coefficient sidebar, click Import From > Salesforce and authorise via OAuth. If your admin has not yet installed Coefficient as a connected app, pass them the setup guide. It takes under five minutes. Full walkthrough: how to connect Salesforce to Google Sheets.
- Step 3: Choose your import method: From Report (select any existing Salesforce report — fastest), From Objects and Fields (choose Opportunities, Leads, Contacts, Accounts, Activities, Cases or custom objects and select specific fields) or Custom SOQL for advanced multi-object queries.
- Step 4: Apply filters and click Import. Your Salesforce data populates instantly.
- Step 5: Set a refresh schedule — hourly, daily or weekly. Coefficient keeps the sheet current automatically.
- Step 6: In Looker Studio, click Create > Report > Google Sheets. Select your spreadsheet and tab. Click Add to Report and build your dashboards.
Pricing
Coefficient has a free plan. Paid plans start from $49/month. The Looker Studio Sheets connector is free. See Salesforce reporting tools and pricing.
Pros
- No connector fees – the Google Sheets to Looker Studio path is free.
- Three import methods – existing reports, objects and fields or SOQL. More flexibility than any direct connector.
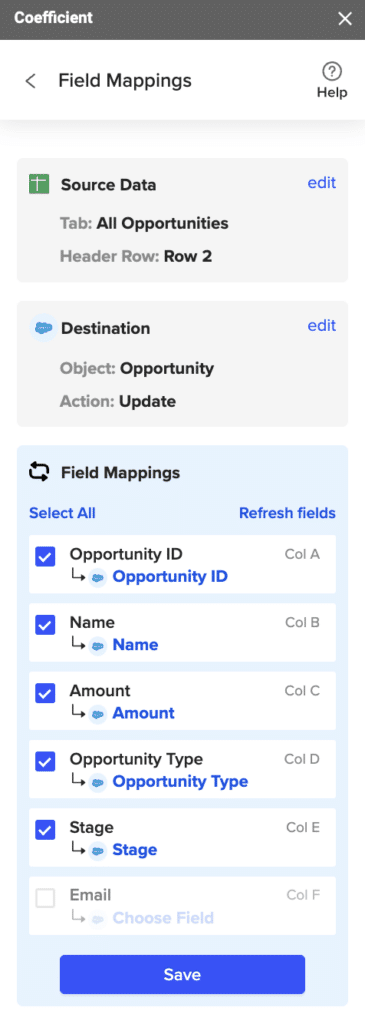
- Two-way sync – update Salesforce records, log activities or change opportunity stages directly from the spreadsheet. Full details: Coefficient Salesforce connector.
- Blend with other sources – add HubSpot, Google Ads or finance data to the same sheet before connecting to Looker Studio.
Cons
- Salesforce admin needs to install Coefficient as a connected app — one-time step, not ongoing.
- Google Sheets as an intermediary is not ideal for millions of rows at high refresh frequency.
- Requires a Coefficient paid plan for scheduled auto-refresh. On-demand data refresh is available on free plan.
Need inspiration for what to build? Browse live Salesforce dashboard templates.
| Coefficient connects Salesforce to Google Sheets in minutes — import from reports, objects or SOQL, set a refresh schedule and feed Looker Studio automatically. Get started free. |
Method 2: Zapier or Make — Automated but Built for Simple Workflows
How it works
Zapier and Make can push Salesforce record updates into Google Sheets via triggers — a new lead is created, an opportunity stage changes, a case is closed — which then feeds Looker Studio via the free Sheets connector. For event-based syncs with low data volume this works. For historical data, bulk records or complex cross-object reporting it falls apart quickly. These are automation tools, not reporting connectors.
Zapier
Zapier free plan includes 100 tasks/month with single-step Zaps only. Starter is $19.99/month (750 tasks, annual) and Professional is $29.99/month (2,000 tasks, annual). Salesforce is a premium app on Zapier — it requires a paid plan. Each action in a workflow counts as one task, so a three-step Zap (trigger + update sheet + notify Slack) burns three tasks per run.
Make
Make is considerably cheaper per operation. Free plan: 1,000 ops/month. Core: $9/month (10,000 ops, annual). Pro: $16/month (10,000 ops plus priority execution, annual). Make’s visual scenario builder handles conditional logic well — useful for more nuanced Salesforce workflows like routing different opportunity types to different sheets.
Pros
- No Sheets intermediary for simple trigger-based syncs if you connect directly.
- Make delivers significantly more operations per dollar than Zapier at the same price point.
- Good for lightweight, event-driven use cases — new lead notifications, stage change logging.
Cons
- Cannot pull historical Salesforce records in bulk — triggers only fire on new or updated events.
- Multi-object reporting (Opportunities + Contacts + Accounts) requires multiple scenarios, multiplying both complexity and cost.
- Monthly task and credit ceilings mean dashboards can go stale silently if limits are hit.
If you prefer a direct Salesforce to Looker Studio connector without the Sheets step, Supermetrics and Coupler.io both offer that starting around $49 to $74 per month.
Method 3: Salesforce CSV Export or Data Loader — Free but Static
How it works
Export Salesforce data as a CSV and upload it to Looker Studio as a File Upload data source. Works for a one-off report. Goes stale immediately.

Stop exporting data manually. Sync data from your business systems into Google Sheets or Excel with Coefficient and set it on a refresh schedule.
Get Started
Option A: Native CSV export (all Salesforce editions)
- Navigate to the Salesforce report or list view you want to export.
- Click Export and select CSV format.
- Download the file from your email.
- In Looker Studio, click Create > Report > File Upload and upload the CSV.
- Build your report. Data will not update automatically.
Option B: Salesforce Data Loader (Enterprise, Performance, Developer and Unlimited editions — Windows only)
- Download and install Salesforce Data Loader.
- Authenticate and select Export.
- Choose your object, configure field selection and export as CSV.
- Upload to Looker Studio as above.
Pricing
Free. Data Loader requires Enterprise edition or above and is only available via command line on Windows.
Cons
- Completely static — every update requires repeating the full export process.
- Not viable for dashboards leadership or sales teams check regularly.
- Data Loader edition and OS restrictions make it inaccessible to many teams.
Which Method Is Right for You?
| Method | Cost | Real-time data | Best for |
| Coefficient + Google Sheets | Free to $49+/month | Yes. Scheduled & On-Demand auto-refresh | Teams wanting live Salesforce data in Looker Studio at no connector cost |
| Zapier or Make | Free to $9–$30+/month | Partial — event-based only | Simple trigger-based syncs; not suitable for bulk or historical records |
| CSV export or Data Loader | Free | No — static snapshot | One-off reports where data freshness is not needed |
Already Have the Data in Sheets? Publish It as a Live Dashboard
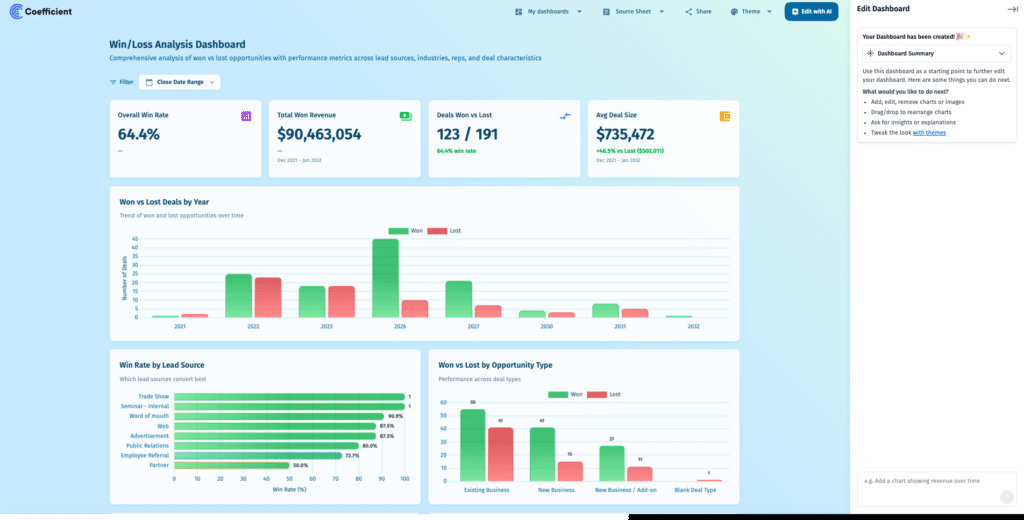
If the Looker Studio setup feels like more overhead than it’s worth, there is a faster option. Coefficient’s Vibe Reporting lets you describe your Salesforce dashboard in plain English — pipeline by stage and close date, quota attainment by rep, win rate by deal source — and builds a live, shareable web dashboard directly from your data in the spreadsheet.
No Looker Studio account needed. No connector fees. The dashboard updates automatically on your Coefficient refresh schedule and can be shared via link with anyone inside or outside your company — including executives and clients who do not have Salesforce access.
For RevOps and sales ops teams already using Coefficient to pull Salesforce data into Sheets, this turns the spreadsheet into a standalone reporting layer without adding another tool.
| Pull live Salesforce data into Sheets with Coefficient, describe your pipeline dashboard in plain English and publish it as a live web report. See Coefficient in action. |
The Bottom Line
You do not need a paid connector to get live Salesforce data into Looker Studio. Coefficient pulls it into Google Sheets and the free native Sheets connector handles the rest. Two-way sync means you can update Salesforce records from the same spreadsheet your dashboard runs on. Or skip Looker Studio entirely and publish a live dashboard straight from your spreadsheet with Vibe Reporting. Get started free.


