HubSpot can’t create waterfall charts natively and lacks the ability to categorize MRR changes into the specific components needed for waterfall analysis. You can see subscription revenue and deal changes, but building waterfall visualizations that show new MRR, expansion, contraction, and churn requires capabilities that HubSpot doesn’t offer.
Here’s how to build professional MRR waterfall charts using your HubSpot subscription revenue data with automated component categorization and dynamic visualizations in spreadsheets, whether you use Google Sheets or Excel.
Create dynamic MRR waterfall charts with live HubSpot data using Coefficient
Coefficient offers a 2-way sync between HubSpot and Google Sheets or Excel, and it’s certified on HubSpot’s marketplace. With Coefficient, you can extract subscription data from HubSpot into your spreadsheet where you can build waterfall charts that automatically categorize MRR changes and update with new data. This gives you the visual MRR analysis that subscription businesses need but HubSpot can’t create.
Here’s a quick video of how the connector works.
How to make it work
Step 1. Import comprehensive subscription data.
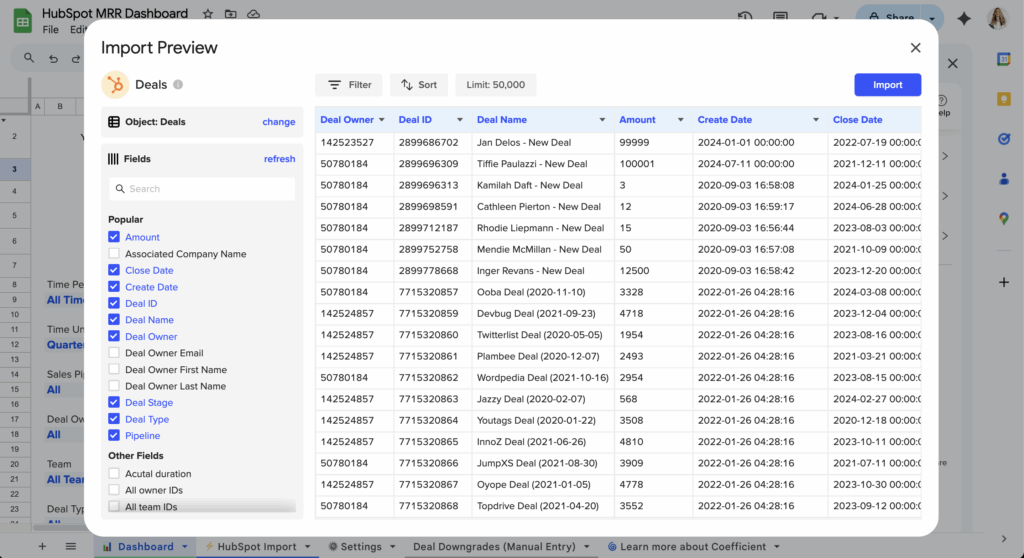
Connect to HubSpot and extract deals, contact data, subscription start and end dates, and revenue amounts with historical data. Include custom fields that help identify subscription changes and customer lifecycle events for accurate waterfall categorization.

Step 2. Calculate waterfall components automatically.
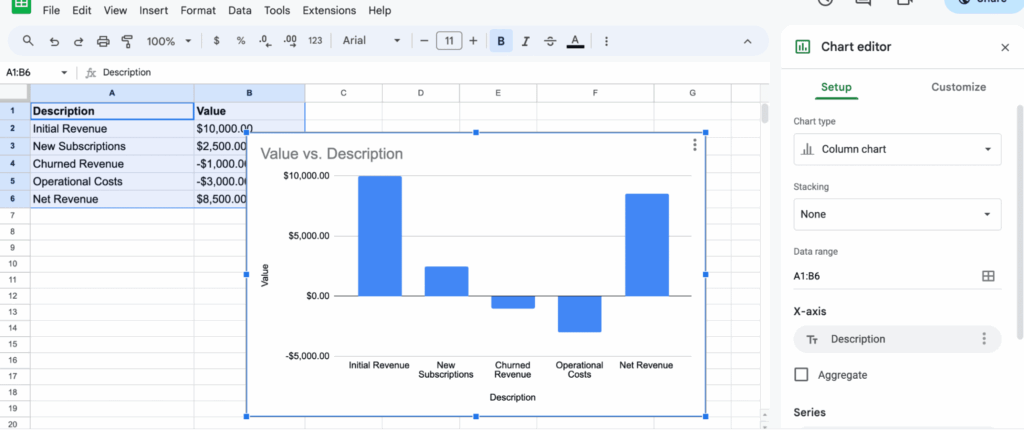
Build formulas that automatically categorize MRR changes into beginning MRR, new MRR, expansion MRR, contraction MRR, churned MRR, and ending MRR. Use period-over-period analysis to track MRR movements between specific time periods like month-over-month or quarter-over-quarter. You can leverage Coefficient’s AI Sheets Assistant in Google Sheets if you need help with your formulas.
Step 3. Build waterfall visualizations and drill-downs.
Use spreadsheet charting capabilities to create professional waterfall charts showing MRR progression and component contributions. Create detailed breakdowns showing which specific customers or deals contributed to each waterfall component for deeper analysis.

Step 4. Automate chart updates and maintain history.
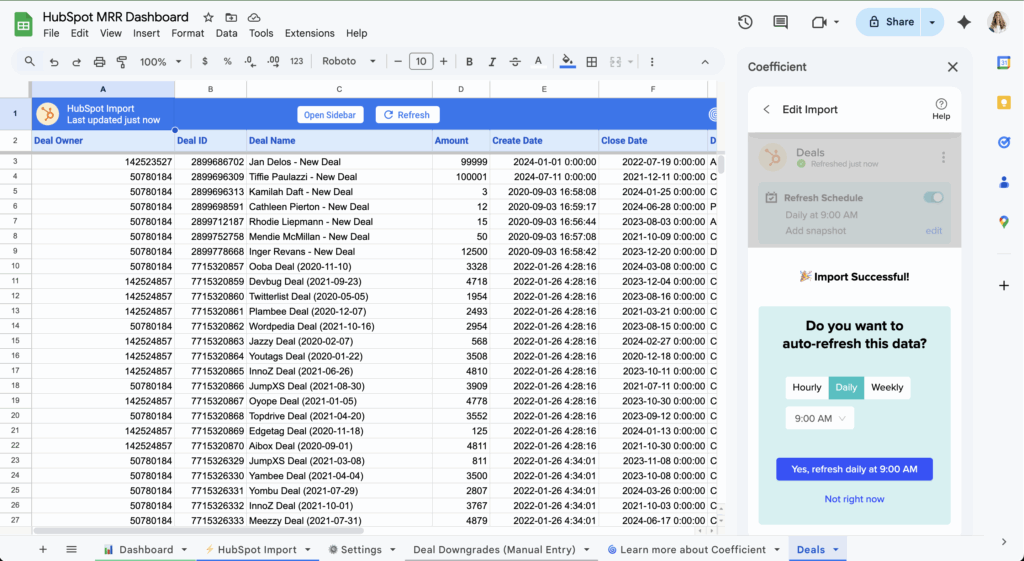
Schedule regular data refreshes so waterfall charts automatically update with new HubSpot subscription data. Formula Auto Fill Down ensures that waterfall calculations are automatically applied to new data, maintaining accurate MRR categorization while preserving historical waterfall analysis.

Visualize your MRR story clearly
MRR waterfall charts with HubSpot subscription data tell the complete story of your revenue growth and help identify which components drive or hurt performance. With automated updates and professional visualizations, your team gets clear MRR insights. Get started with Coefficient for free.
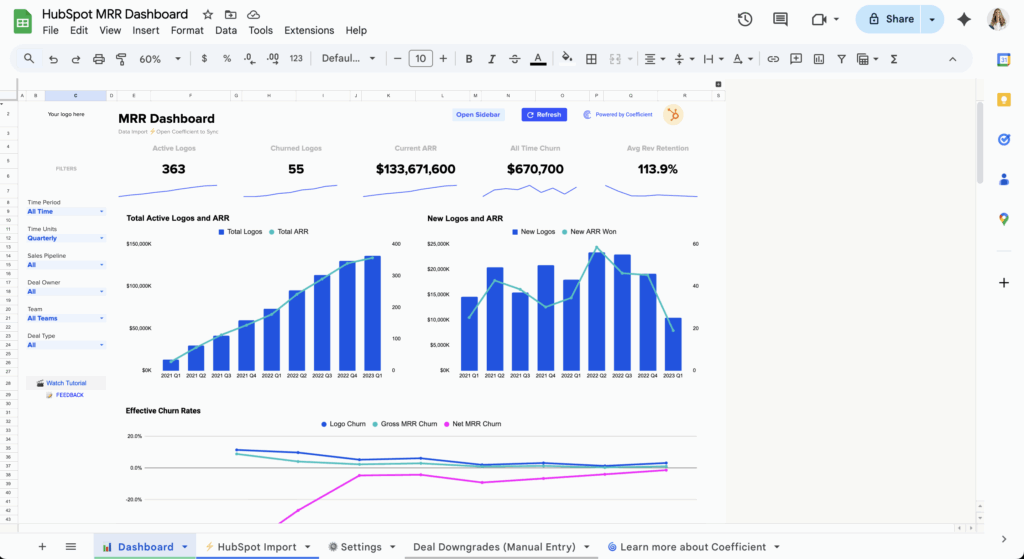
Want to get started fast? Leverage our pre-built HubSpot MRR dashboard, and it just a few clicks you can power it with your live data.

)


