QuickBooks is a powerhouse for small business accounting. But when it comes to reporting? It’s like trying to paint a masterpiece with crayons. You can do it, but it’s not ideal.
That’s where specialized reporting tools come in. They transform your QuickBooks data into actionable insights. Let’s dive into the top 5 options for 2024.
QuickBooks Reporting Tools Feature Comparison Table
| Feature | Coefficient | QuickBooks Advanced Reporting | Fathom | Reach Reporting | Spotlight Reporting |
| Row Limits / Export Limits | Up to 5,000 rows for free and starter plans. Unlimited for Pro and Enterprise. | Unlimited within QuickBooks data | Unlimited | Unlimited | Unlimited |
| Data Sources | 50+ business systems | QuickBooks data | QuickBooks, Xero, MYOB, and 5000+ via Zapier | QuickBooks, Xero, Excel | Xero, MYOB, QuickBooks, and 30+ other sources |
| Builder License Cost | Free tier available. Paid starts at $49/month | Included with QuickBooks Online Advanced ($200/month) | Starts at $55/month for Lite plan | Starts at $55/month | Starts at $329/month for Small plan |
| Viewer License Cost | Included | Included in main license | Included in main license (up to 3 users in standard plans) | Additional users from $15/month | $50/month per additional user |
| AI Functionality | AI-powered tools for connecting data, building reports, and analysis | Basic AI-driven insights | AI-powered insights and suggestions | Limited AI features | AI-assisted reporting and forecasting |
| Refresh Frequency | Real-time | Real-time within QuickBooks | Daily | Daily | Daily (hourly available on higher plans) |
| Alerts | Yes, via Slack and email | Basic alerts within QuickBooks | Customizable alerts via email and in-app | Basic email alerts | Customizable alerts via email and in-app |
| Security | Enterprise-grade security and access controls, likely SOC 2 compliant | QuickBooks security standards, likely SOC 2 compliant | SOC 2 compliant, role-based access control | Role-based access control, data encryption | SOC 2 compliant, role-based access control |
1. Coefficient: Real-time Reporting and Automation

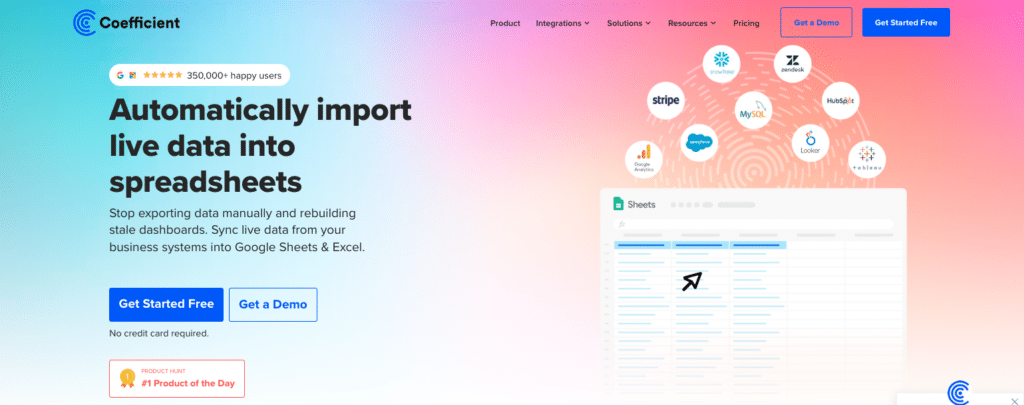
Coefficient is ideal for finance teams and analysts who are comfortable with spreadsheets and need to combine QuickBooks data with information from other systems. It’s particularly useful for businesses that rely heavily on Excel or Google Sheets for financial reporting and analysis.
Key Features
- Real-time data synchronization from QuickBooks and 50+ other sources
- Automated report refreshing and distribution
- Advanced data blending and manipulation capabilities
- Two-way sync allowing data push-back to QuickBooks
Pros
- Leverages existing spreadsheet skills, reducing the learning curve
- Enables complex, multi-source data analysis without coding
- Eliminates manual data entry and reduces errors
- Offers flexibility in report design and data manipulation
- Pre-built financial dashboards in spreadsheets that you can power with your live data, including a Profit and Loss template, SaaS P&L template, Cash Runway template, Accounts Payable Dashboard, Account Receivable Dashboard, Revenue Dashboard, and Cashflow template
Cons
- Requires proficiency in spreadsheet use for advanced features
- Initial setup time can be significant for complex reports
- May require data cleansing for optimal performance
Pricing
- Free Plan: Includes data imports for up to 5,000 rows and 10,000 OpenAI API calls.
- Starter Plan: $49 per user per month.
- Pro Plan: $99 per user per month.
- Enterprise Plan: Custom pricing based on specific needs.
What Users Are Saying
I used to spend an hour updating sheets so that others had access to real time data and with Coefficient it does it all on it’s own even several times a day if I need. Saves me so much time to focus on real issues instead of manually updating sheets.
- Source: AppExchange
Makes it incredibly easy to share data across the org and since the query is visible it is always clear what the source of truth is. It limits breakage and enables fast automation of regular analyses.
- Source: Workspace Marketplace
Support and Training
- Email support and chat for all users
- Knowledge base with comprehensive documentation and tutorials
- Dedicated account managers, Slack for enterprise clients
2. QuickBooks Advanced Reporting for Enterprise Plans

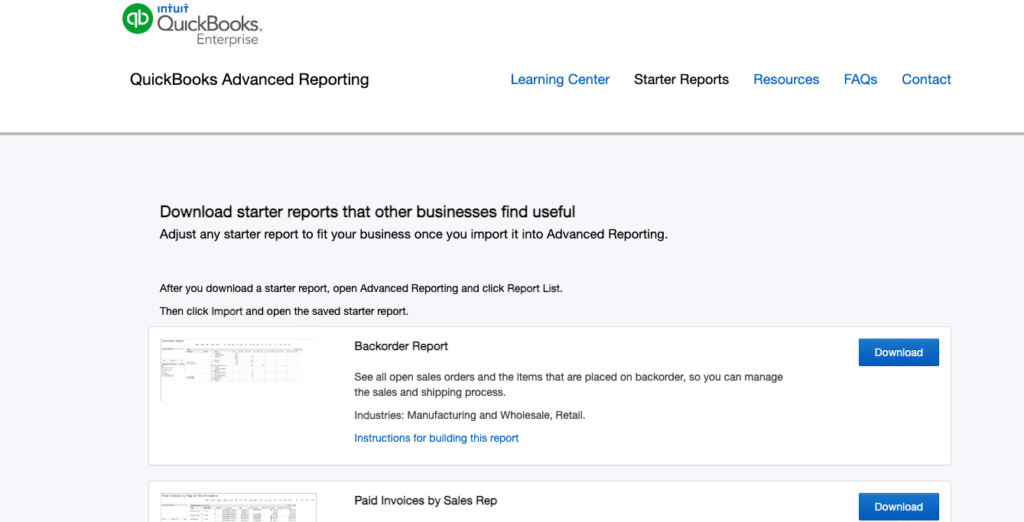
QuickBooks Advanced Reporting (QBAR) is the built-in advanced reporting solution for QuickBooks Enterprise users.
QBAR is designed for QuickBooks Enterprise users who need more advanced reporting capabilities than what’s offered in standard QuickBooks reports. It’s particularly useful for businesses with multiple entities or those requiring highly customized financial reports.
Key Features
- Customizable report templates
- Multi-company consolidation
- Advanced filtering and sorting options
- Direct access to QuickBooks data tables
Pros
- Seamless integration with QuickBooks Enterprise
- No need for data export or third-party tools
- Familiar interface for QuickBooks users
- Robust security and data access controls
Cons
- Limited to QuickBooks Enterprise users
- Less flexible than some third-party solutions
- May require SQL knowledge for advanced customization
- Learning curve can be steep for complex report creation
Pricing
- Silver Plan: $156 per month for cloud access; $114 per month for local only.
- Gold Plan: $185 per month for cloud access; $155 per month for local only.
- Platinum Plan: $215 per month for cloud access; $185 per month for local only.
- Diamond Plan: $368 per month for cloud access; $311 per month for local only.
What Users Are Saying
“QuickBooks Online Advanced has been a great addition to our workplace. I am the main user and I like the ease of reports and other functions.”
- Source: GetApp
“As I mentioned, I think the software is not always intuitive, so it can be frustrating for less experienced users.”
- Source: Capterra
Support and Training
- Access to standard QuickBooks support channels
- Online resources and community forums
- Optional paid training and consultation services
3. Fathom: Visual Financial Analysis and Reporting

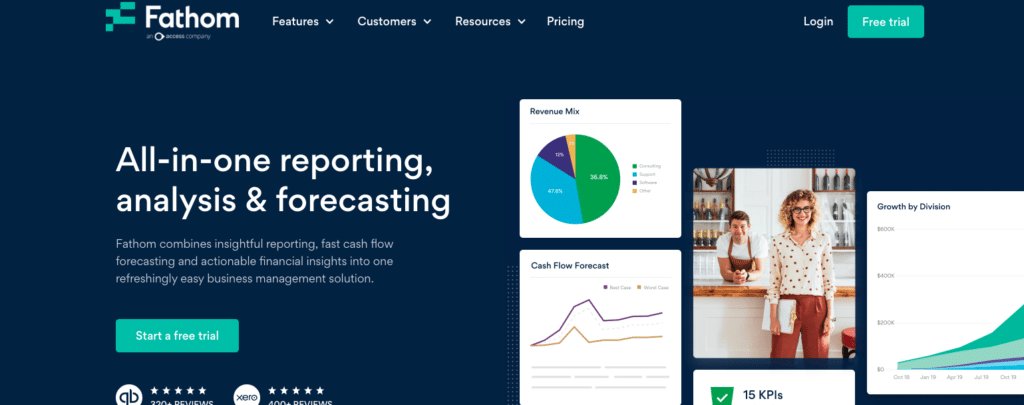
Fathom is a cloud-based financial analysis and reporting tool that integrates with QuickBooks to provide enhanced visualization and KPI tracking capabilities.
Fathom is excellent for businesses that need to present financial data in a visually appealing, easy-to-understand format. It’s particularly useful for companies that want to track both financial and non-financial KPIs and need robust forecasting capabilities.
Key Features
- Visual dashboards and performance reports
- Benchmarking and goal-setting tools
- Cash flow forecasting
- Three-way financial forecasting
- Custom KPI tracking
Pros
- User-friendly interface with drag-and-drop report building
- Strong focus on visual presentation of data
- Includes non-financial KPI tracking
- Powerful benchmarking and forecasting tools
Cons
- Limited customization compared to spreadsheet-based solutions
- May be overkill for businesses with simple reporting needs
- Pricing can be high for smaller businesses
Pricing
- Starts at $44 per month, with various plans available depending on features and company size.
What Users Are Saying
“Fathom has allowed me to provide so much more value to my clients. I am able to generate reports so much faster, and present them in a way that is easy for my clients to understand. This allows me to spend more time actually consulting with my clients, rather than spending hours putting together reports.”
- Source: Capterra
“Some of the features are not as intuitive as I would like, and it takes some time to figure out how to use them. Additionally, the pricing can be a bit high for smaller businesses.” Source: Capterra
Support and Training
- Email support and comprehensive knowledge base
- Video tutorials and regular webinars
- Phone support for higher-tier plans
- Optional paid training sessions
4. Reach Reporting: Automated Financial Report Generation

Reach Reporting is a financial reporting and analytics platform that offers seamless integration with QuickBooks and focuses on automated, presentation-ready reports.
Reach Reporting is ideal for businesses that need to regularly produce professional-looking financial reports for stakeholders, boards, or investors. It’s particularly useful for companies that want to automate their reporting process and need a tool that can generate narrative insights.

Stop exporting data manually. Sync data from your business systems into Google Sheets or Excel with Coefficient and set it on a refresh schedule.
Get Started
Key Features
- Automated report generation
- Custom branding options
- Budgeting and forecasting tools
- Board and investor reporting templates
- Narrative insights feature
Pros
- Saves time with automated report generation
- Produces professional, presentation-ready reports
- Offers tools for financial planning and analysis
- Narrative insights feature adds context to numbers
Cons
- May have more features than needed for small businesses
- Some users report a steeper learning curve
- Less flexible for highly customized reports compared to spreadsheet solutions
Pricing
Reach Reporting offers tiered pricing starting at $55/month for small businesses, with custom enterprise plans available.
What Users Are Saying
“I used this tool for the first time for this month’s reporting. It was easy to use, analyzed the year-to-date reporting thoroughly, and saved me tons of time. My experience with Reach has been very pleasant; their customer service is fast and very helpful.”
- Source: QuickBooks App Store
Support and Training
- Email support and knowledge base
- Onboarding assistance for new users
- Regular training webinars
- Dedicated account managers for enterprise plans
5. Spotlight Reporting: Comprehensive Tool for Accounting Firms

Spotlight Reporting is a cloud-based reporting and forecasting tool designed for accountants and financial professionals using QuickBooks.Spotlight Reporting is primarily designed for accounting firms and financial advisors who work with multiple clients.
Key Features
- Multi-entity consolidation
- Scenario planning and forecasting
- Industry benchmarking
- Custom KPI tracking
- White-labeling options for accounting firms
Pros
- Robust forecasting and scenario planning tools
- Strong focus on advisory services for accountants
- Comprehensive consolidation features for multi-entity businesses
- White-labeling options for customized client reporting
Cons
- Primarily designed for accounting firms rather than end-users
- Can be complex for non-financial users
- Pricing may be high for smaller accounting practices
Pricing
Spotlight Reporting’s pricing is quote-based, depending on the number of clients and required features.
What Users Are Saying
“The software is quite complex and can be overwhelming for new users. It takes some time to learn how to use all the features and create custom reports. Additionally, the pricing can be expensive for small businesses.”
- Source: G2
Spotlight Reporting is easy to use and has helped us to provide our clients with valuable insights into their businesses. The reports are visually appealing and easy to understand, and the forecasting feature is invaluable for helping our clients plan for the future.”
- Source: G2
Support and Training
- Email and phone support
- Extensive knowledge base and tutorial videos
- Regular training webinars
- Dedicated account managers for larger firms
Elevate Your QuickBooks Reporting with the Right Tools
Reporting tools can greatly expand QuickBooks Online’s analytical capabilities. Coefficient’s broad integration options and real-time data syncing offer versatile reporting for QBO users. When choosing a tool, focus on your reporting priorities, required data sources, and cost considerations.
Free trials are often available, providing hands-on experience with different options. An effective reporting tool turns QuickBooks data into actionable insights, driving informed business decisions.
Ready to transform your QuickBooks reporting? Get started with Coefficient today and experience the power of automated, real-time financial insights.

