How to filter activity reports by user custom fields on Salesforce dashboards

Filtering Activity reports by User custom fields on Salesforce dashboards is problematic because Activity objects don’t expose related User fields in dashboard filter contexts, even when these fields are available in the underlying reports.

Native workarounds like formula fields or custom report types don’t consistently resolve field visibility issues. Here’s a complete solution that works reliably.

Get robust filtering capabilities for activity reports using user custom fields with Coefficient

Coefficient provides robust filtering capabilities for Activity reports using User custom fields by importing Task and Event records with User relationship fields included directly.

How to make it work

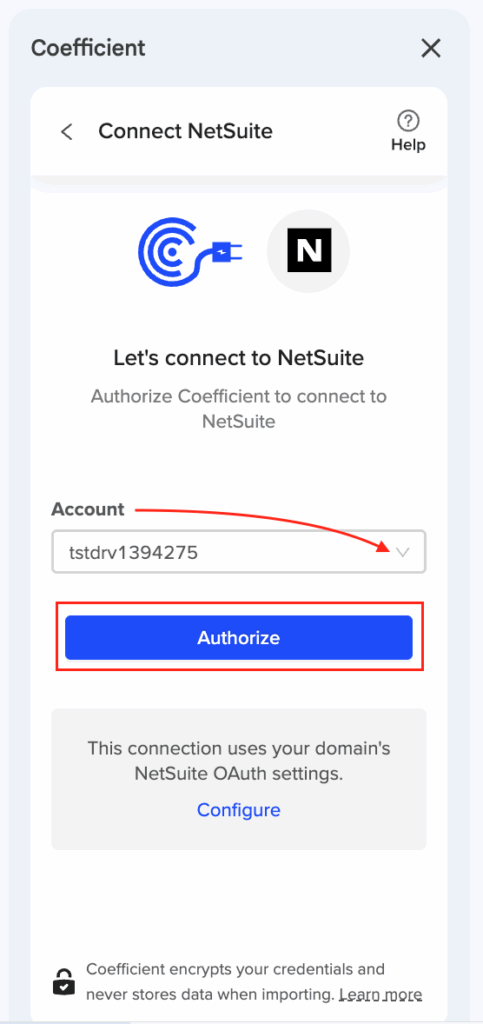
Step 1. Import Activity data with User relationship fields.

Use Coefficient’s Salesforce connector to pull Task and Event records. Include User relationship fields like “Sales_Region__c (Owner)”, “Department__c (Owner)”, or “Territory__c (Owner)” to access all the User custom fields you need for filtering.

Step 2. Create dynamic filter controls in your spreadsheet.

Set up dropdown filters or input cells that reference User custom fields directly. These filters can use AND/OR logic for complex combinations, reference cell values for easy stakeholder control, and combine multiple User custom fields simultaneously.

Step 3. Build interactive dashboards with advanced filtering.

Create pivot tables, charts, and summary views with full filtering functionality. Filter by Sales Region and Department together, use date ranges for Activity dates, and create dynamic filters that update when stakeholders change criteria.

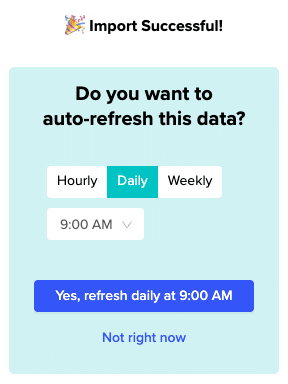
Step 4. Schedule automatic updates to maintain current data.

Set up hourly, daily, or weekly refresh schedules to keep your Activity and User data current. Your filtering setup remains intact while the underlying data updates automatically from Salesforce.

Get flexible filtering without platform restrictions

This approach eliminates the inconsistent field availability issues in native Salesforce dashboard filters while providing more flexible filtering options than the platform allows. Start building better activity reports with reliable User field filtering.

How to fix exported reports showing values instead of formulas after system update

System updates often change export behavior, converting formula-based reports to static values when QuickBooks updates its export engine for security or performance reasons. This breaks existing workflows that depend on dynamic calculations.

Here’s how to implement a permanent fix that bypasses the export mechanism entirely and remains unaffected by future system updates.

Implement a permanent fix that bypasses export limitations using Coefficient

Coefficient provides a permanent fix by bypassing the export mechanism entirely. The API connection remains unaffected by export changes, ensuring consistent formula-based reporting regardless of QuickBooks system updates.

How to make it work

Step 1. Install Coefficient and establish immediate resolution.

Add the Coefficient add-on and connect to QuickBooks with your existing credentials. Import the same reports directly without using the export function, which eliminates the system update issue entirely.

Step 2. Restore formula functionality with live data.

Import the same reports via Coefficient’s “From QuickBooks Report” feature. Recreate formulas by referencing the imported cells instead of static values. These formulas persist regardless of QuickBooks updates.

Step 3. Document and migrate existing formula logic.

Document your existing formula logic from old reports, then rebuild formulas using imported data references. Test calculations to ensure they match historical results while maintaining dynamic functionality.

Step 4. Future-proof your workflow with API connections.

Configure automatic refreshes through QuickBooks API connections. Updates to QuickBooks won’t break formula preservation since the connection method is independent of export functionality.

Prevent future disruptions from system updates

This approach not only fixes the immediate issue but prevents future disruptions from system updates, ensuring consistent formula-based reporting. Get started with a permanent solution that maintains formula functionality regardless of QuickBooks changes.

How to fix NetSuite exporting Excel files as .XLS instead of .XLSX format

NetSuite exports files with a .XLS extension, but they’re actually XML Spreadsheet 2003 format, not true Excel files. This creates compatibility issues with modern Excel versions and triggers security warnings.

Here’s how to get your NetSuite data in proper .XLSX format without dealing with file conversions or compatibility errors.

Skip NetSuite exports entirely using Coefficient

Coefficient eliminates the export problem by connecting directly to your NetSuite instance and importing data straight into Excel or NetSuite in native format. No more file downloads, no more format mismatches, and no more security warnings.

How to make it work

Step 1. Install Coefficient and connect to NetSuite.

Add Coefficient to Excel from the Office Add-ins store or to Google Sheets from the workspace marketplace. Your NetSuite admin will need to configure the OAuth connection once – this involves deploying a RESTlet script and setting up external URL configuration.

Step 2. Choose your import method.

Select from Records & Lists for direct access to any NetSuite data, Saved Searches to import existing searches, Reports for financial statements, or SuiteQL Query for custom data pulls. Each method delivers data directly to your spreadsheet in proper format.

Step 3. Set up automated refreshes.

Configure hourly, daily, or weekly refresh schedules to keep your data current. The data updates automatically in your spreadsheet without any manual exports or file handling.

Get clean NetSuite data without the export headaches

Stop wrestling with file format issues and security warnings. Coefficient gives you live NetSuite data in proper Excel format, ready for analysis and sharing. Try Coefficient and eliminate export problems for good.

How to fix Salesforce dashboard filters not recognizing custom fields on Activity reports

Salesforce dashboard filters have a known limitation where custom fields from related objects aren’t recognized on Activity report components, preventing you from filtering by important User attributes like Sales Region or Team assignments.

This restriction occurs because Activity reports handle field relationships differently than standard object reports. Here’s how to bypass these limitations completely.

Bypass dashboard limitations with complete field access using Coefficient

Salesforce dashboard filters only recognize direct lookup fields on Activity reports, blocking access to custom fields from related objects that you need for meaningful segmentation.

Coefficient provides a complete workaround by importing all your data into Salesforce spreadsheets where every field becomes filterable and accessible.

How to make it work

Step 1. Import Activity data with all standard fields.

Use Coefficient’s Salesforce connector to import your Activity data including Subject, Status, Owner ID, and other standard fields. This creates your base dataset without the dashboard filter restrictions.

Step 2. Import User object data including all custom fields.

Create a separate import for the User object, making sure to select all custom fields like Sales_Region__c, Team__c, or Territory__c that you need for filtering but can’t access through dashboard filters.

Step 3. Merge custom fields using lookup formulas.

Use Coefficient’s =salesforce_lookup formula to pull User custom fields directly into your Activity data. For example: =salesforce_lookup(“User”, “Id”, A2, “Sales_Region__c”) where A2 contains the Activity owner ID.

Step 4. Create filter dropdowns using Data Validation.

Build dropdown filters that reference your custom field values. These filters work with all imported data, not just the limited lookup fields available in Salesforce dashboards.

Step 5. Build dynamic dashboards with pivot tables.

Create pivot tables and charts that respond to all filter selections. Apply complex filter logic using AND/OR conditions while maintaining real-time data sync with scheduled refreshes.

Make all custom fields filterable without field visibility issues

This solution provides the custom field filtering that Salesforce dashboards can’t deliver while maintaining data accuracy through automated syncing. Get started with unrestricted Activity filtering today.

How to fix SOQL query errors for billing address fields in Salesforce NPSP Households

SOQL query errors for NPSP billing address fields typically happen because NPSP uses custom field names like npsp__MailingStreet__c instead of standard BillingStreet, plus field permission issues that aren’t immediately obvious.

Instead of debugging complex queries, you can access all your NPSP address data through a visual interface that prevents errors entirely.

Import NPSP address data without writing SOQL

Traditional SOQL debugging requires verifying field API names, checking permissions, and using correct object references. But Coefficient eliminates this complexity by automatically discovering all accessible fields and displaying them in a searchable list.

You’ll see exactly which billing address fields are available in your NPSP instance without guessing at API names or permissions.

How to make it work

Step 1. Install Coefficient and connect to your NPSP org.

Add Coefficient to Google Sheets or Excel, then authenticate with your Salesforce Salesforce NPSP org credentials.

Step 2. Choose “Import from Salesforce” then “From Objects & Fields”.

Select the Account object (or your custom Household object if you’re using that model). Coefficient automatically detects your NPSP configuration.

Step 3. Browse to the Address fields section.

All available billing address components appear with their proper API names. You’ll see BillingStreet, BillingCity, BillingState, BillingPostalCode, BillingCountry, or their NPSP custom equivalents like npsp__MailingStreet__c.

Step 4. Select all needed address fields and apply filters.

Check the billing address fields you want to import. Use dynamic filters to import specific household segments based on any criteria you need.

Step 5. Set up automated refreshes and alerts.

Schedule automatic refreshes to keep address data current, and set up alerts when addresses change. You can also export updated addresses back to Salesforce with preserved field mapping.

Stop debugging SOQL queries

Visual field selection eliminates malformed query errors and makes NPSP data accessible to anyone on your team. No technical expertise required, no syntax to memorize. Get started and access your NPSP data reliably.

How to get 13-month trailing P&L from QuickBooks Online into Excel automatically

Coefficient excels at creating rolling period reports like a 13-month trailing P&L with automatic updates. You can set up dynamic date filters that automatically adjust each day, eliminating the need for manual CSV downloads and re-imports.

Here’s the complete step-by-step process to automate your 13-month P&L with live data that stays current without any manual intervention.

Set up your automated 13-month P&L using Coefficient

The key is using dynamic date filters that create a rolling window. When you set the start date as “13 months ago from today” and end date as “today,” this creates a rolling window that automatically adjusts each day without any manual updates needed.

How to make it work

Step 1. Connect to QuickBooks and choose your import method.

Connect QuickBooks to Excel using admin permissions. Choose “From Objects & Fields” import method and select the relevant objects like Account, Transaction List, or Journal Entry depending on your P&L structure needs.

Step 2. Apply dynamic date filters for the rolling 13-month window.

Set your start date as “13 months ago from today” and end date as “Today.” This creates the rolling window that automatically adjusts. You can also use the formula =TODAY()-395 for the start date to get exactly 13 months of data.

Step 3. Configure your P&L structure and fields.

Select revenue and expense account fields, group by account type or class for proper P&L formatting, and add any custom fields or dimensions needed for your analysis. This gives you the exact P&L structure you want.

Step 4. Set up automated refresh scheduling.

Click “Schedule” in the import settings and choose daily refresh (recommended for P&L reports). Set your timezone and specific refresh time. The 13-month window will automatically roll forward with each refresh, and historical data is preserved while new data appends.

Step 5. Add calculated fields for enhanced analysis.

Create calculated fields for month-over-month comparisons, build dynamic dashboards that update automatically, and set up any variance calculations you need. Your formulas will remain intact during each refresh.

Get your automated P&L running today

This approach gives you a truly automated 13-month trailing P&L that stays current without any manual intervention. You can start building your automated P&L report and eliminate the manual export process entirely while getting more flexibility than QBO’s native tools offer.

How to handle date format conversion when preparing CSV files for NetSuite import

Date format mismatches cause frequent NetSuite import failures and data corruption. You can eliminate manual date conversion by using automated import processes that handle format standardization automatically.

Here’s how to avoid date format headaches and ensure consistent date handling across all your NetSuite imports.

Automate date format conversion with intelligent imports using Coefficient

Coefficient eliminates date format conversion problems by automatically handling date standardization in its import process. Instead of manually preparing CSV files with proper date formatting, the platform recognizes various date formats and converts them to NetSuite -compatible formats without manual intervention.

The system handles automatic date format recognition from source systems, correctly interpreting MM/DD/YYYY, DD/MM/YYYY, ISO 8601, and other common formats. Date/Time fields are imported as Date only, ensuring compatibility with NetSuite ‘s expectations.

How to make it work

Step 1. Connect your data source with date fields.

Import your data using Coefficient’s Records & Lists method or other import options. The platform automatically detects date fields and begins format recognition without requiring manual specification of date formats.

Step 2. Review date formatting in the preview.

Use the preview feature to verify that date fields appear correctly formatted. The first 50 rows show how NetSuite will interpret your dates, allowing you to catch format issues before completing the import.

Step 3. Set up timezone consistency for scheduled imports.

Configure scheduled imports knowing that the timezone is based on the user who created the schedule. This ensures consistent date calculations across all automated refreshes without timezone confusion.

Step 4. Import directly without manual conversion.

Complete your import knowing that date fields maintain their integrity through the process. The platform prevents common issues like dates being interpreted as text strings or month/day confusion in international formats.

Eliminate date format guesswork

Automated date handling prevents the trial-and-error typically associated with CSV date conversions. You get reliable imports without format mismatches, timezone confusion, or Excel’s automatic date conversions that corrupt data. Start importing with confidence today.

How to handle multi-subsidiary journal entries in automated NetSuite imports

Multi-subsidiary journal entries require precise control over entity assignments, intercompany relationships, and validation across different subsidiaries. Automated imports can handle these complex scenarios with proper filtering and subsidiary management configuration.

This guide shows you how to set up automated imports that handle multi-entity journal entries while maintaining audit trails and proper subsidiary assignments.

Automate multi-subsidiary journal entries using Coefficient

Coefficient provides robust support for multi-subsidiary journal entry imports through advanced filtering and subsidiary management features. During OAuth setup, the system can be configured to access multiple subsidiaries, with permissions inherited from the authenticating user’s NetSuite role.

You can filter imports by specific subsidiaries using AND/OR logic, map subsidiary fields directly from your Excel data, and handle elimination entries between subsidiaries. The platform also supports filtering by departments and classes for precise control over multi-entity transactions.

How to make it work

Step 1. Configure multi-subsidiary access during OAuth setup.

Work with your NetSuite admin to ensure the OAuth connection has permissions across all relevant subsidiaries. The system inherits access rights from the authenticating user’s role, so proper role configuration is essential for multi-entity imports.

Step 2. Structure your Excel template with subsidiary identifiers.

Create columns for primary subsidiary, intercompany subsidiary (if applicable), account, debit, credit, and memo. Use clear subsidiary identifiers that match your NetSuite subsidiary setup for accurate mapping.

Step 3. Set up filtering logic for each subsidiary.

Use Coefficient’s AND/OR filtering capabilities to separate entries by subsidiary and route transactions to correct entities. You can create separate import configurations for each subsidiary or use dynamic filtering based on your Excel data.

Step 4. Validate entries across subsidiaries before import.

Use the preview feature to validate journal entries across different subsidiaries before committing the import. This ensures balanced entries, proper subsidiary assignments, and correct intercompany account relationships.

Step 5. Schedule autoamted imports for intercompany transactions.

For intercompany journal entries, set up separate import configurations for each subsidiary and use Coefficient’s scheduling feature to coordinate imports across entities. This maintains transaction timing consistency and proper elimination entry handling.

Streamline complex multi-entity accounting

Multi-subsidiary journal entries become manageable with proper filtering, validation, and scheduling. Maintain audit trails and control while automating complex multi-entity transactions. Set up your multi-subsidiary import workflow today.

How to handle NetSuite API rate limits when automating frequent data pulls to Excel

Coefficient provides built-in mechanisms to work within NetSuite ‘s API rate limits while enabling frequent automated data pulls to Excel. The key is intelligent scheduling and query optimization to avoid hitting the 15 simultaneous API call limit.

Understanding these constraints and implementing smart strategies ensures reliable data automation without throttling or failed refreshes.

Manage NetSuite API rate limits for Excel automation using Coefficient

NetSuite limits you to 15 simultaneous RESTlet API calls (plus 10 more per SuiteCloud Plus license) and 100,000 rows per SuiteQL query. Coefficient handles these constraints through intelligent scheduling and NetSuite query optimization.

How to make it work

Step 1. Stagger refresh schedules to avoid simultaneous API calls.

Set different refresh times for your imports instead of running them all at once. For example, schedule financial summaries at 6 AM, sales transactions hourly, customer data weekly, and inventory levels every 4 hours to distribute API load.

Step 2. Use optimized import methods for better API efficiency.

Choose Saved Searches for pre-filtered data to reduce API processing time, leverage Datasets for commonly accessed information, and apply filters to Records & Lists imports to minimize data volume and API calls.

Step 3. Break large data requests into smaller, targeted imports.

Instead of one massive import, create multiple smaller imports with date range filters or subsidiary segmentation. Use incremental-style updates by filtering for only new or modified records since the last refresh.

Step 4. Optimize query structure and data selection.

Select only necessary fields to reduce payload size, use date range filters to import only recent transactions, and leverage SuiteQL for complex queries that would otherwise require multiple API calls.

Step 5. Monitor and adjust based on performance patterns.

Track import execution times in Coefficient and adjust schedules based on data volume patterns. Use off-peak hours for large data pulls and implement error handling with automatic retries for failed requests.

Build reliable NetSuite automation within API constraints

Working within NetSuite’s API limits doesn’t mean sacrificing automation quality. Smart scheduling and query optimization ensure consistent data flow while preventing throttling issues. Start optimizing your NetSuite to Excel automation today.

How to handle QuickBooks Online API pagination when extracting large transaction lists by account

QuickBooks Online API pagination presents significant challenges when extracting large transaction datasets, particularly for account-specific queries. The API typically returns 1000 records per page, requiring multiple calls to retrieve complete transaction lists by account.

Here’s how to handle pagination automatically without the complex logic and error handling that manual API pagination requires.

Manual API pagination challenges and automated solutions

Manual pagination handling for QuickBooks transaction data involves:

  • Manual tracking of pagination tokens across multiple API calls
  • Complex logic to determine when all pages are retrieved
  • Risk of data inconsistency if new transactions are added during pagination
  • Memory management issues when accumulating large datasets
  • Error handling when pagination calls fail mid-process

Coefficient eliminates these challenges through automated pagination management that handles complete transaction datasets reliably.

How to make it work

Step 1. Set up transaction imports without pagination concerns.

Use Objects & Fields method to access Transaction objects from QuickBooks . The system automatically handles all pagination behind the scenes, retrieving complete datasets without manual intervention.

Step 2. Apply account-specific filtering across all paginated results.

Set up account-based filters that automatically apply across all pages of transaction data. The system ensures consistent filtering regardless of dataset size or pagination complexity.

Step 3. Let automatic error recovery handle pagination failures.

Built-in error handling ensures that if pagination fails mid-process, the system resumes from the appropriate page rather than restarting the entire extraction. This prevents data loss and reduces extraction time.

Step 4. Benefit from memory optimization for large datasets.

The system efficiently manages large transaction datasets during pagination, preventing memory issues that commonly occur when accumulating thousands of transaction records manually.

Step 5. Handle the 400,000 cell limit automatically.

When pagination results exceed QuickBooks’ 400,000 cell limit for report responses, the system automatically implements incremental date ranges to work around this constraint.

Extract complete transaction lists without pagination complexity

Large transaction dataset extraction doesn’t require complex pagination logic or error handling. Automated pagination management reliably extracts complete transaction lists by account regardless of dataset size. Start extracting your large transaction datasets today.